Counterintuitive results from observational
data: a case study and discussion
The MIT Faculty has made this article openly available.
Please share
how this access benefits you. Your story matters.
Citation
Doty E., et al., "Counterintuitive results from observational data: a
case study and discussion." BMJ Open 9,5 (2019) no. 9:e026447 doi:
10.1136/bmjopen-2018-026447 ©2019 Author(s)
As Published
10.1136/bmjopen-2018-026447
Publisher
BMJ
Version
Final published version
Citable link
https://hdl.handle.net/1721.1/124305
Terms of Use
Creative Commons Attribution NonCommercial License 4.0
Counterintuitive results from
observational data: a case study
and discussion
Erik Doty,1 David J Stone,2,3 Ned McCague,3,4 Leo Anthony Celi 5
To cite: Doty E, Stone DJ, McCague N, et al. Counterintuitive results from observational data: a case study and discussion. BMJ Open 2019;9:e026447. doi:10.1136/ bmjopen-2018-026447
►Prepublication history and additional material for this paper are available online. To view these files, please visit the journal online (http:// dx. doi. org/ 10. 1136/ bmjopen- 2018- 026447). Received 2 September 2018 Revised 21 February 2019 Accepted 1 April 2019 1Department of Biomedical
Informatics, Harvard Medical School, Boston, Massachusetts, USA
2University of Virginia School
of Medicine, Charlottesville, Virginia, USA
3Laboratory for Computational
Physiology, Massachusetts Institute of Technology, Cambridge, Massachusetts, USA
4Verily, Cambridge, Massachusetts, USA 5Massachusetts Institute of Technology, Cambridge, Massachusetts, USA Correspondence to Dr Leo Anthony Celi; lceli@ bidmc. harvard. edu © Author(s) (or their employer(s)) 2019. Re-use permitted under CC BY-NC. No commercial re-use. See rights and permissions. Published by BMJ.
AbstrACt
Objective To explore the issue of counterintuitive data
via analysis of a representative case in which the data obtained was unexpected and inconsistent with current knowledge. We then discuss the issue of counterintuitive data while developing a framework for approaching such findings.
Design The case study is a retrospective analysis of a
cohort of coronary artery bypass graft (CABG) patients. Regression was used to examine the association between perceived pain in the intensive care unit (ICU) and selected outcomes.
setting Medical Information Mart for Intensive Care-III,
a publicly available, de-identified critical care patient database.
Participants 844 adult patients from the database who
underwent CABG surgery and were extubated within 24 hours after ICU admission.
Outcomes 30 day mortality, 1 year mortality and hospital
length of stay (LOS).
results Increased pain levels were found to be
significantly associated with reduced mortality at 30 days and 1 year, and shorter hospital LOS. A one-point increase in mean pain level was found to be associated with a reduction in the odds of 30 day and 1 year mortality by a factor of 0.457 (95% CI 0.304 to 0.687, p<0.01) and 0.710 (95% CI 0.571 to 0.881, p<0.01) respectively, and a 0.916 (95% CI −1.159 to –0.673, p<0.01) day decrease in hospital LOS.
Conclusion The finding of an association between
increased pain and improved outcomes was unexpected and clinically counterintuitive. In an increasingly digitised age of medical big data, such results are likely to become more common. The reliability of such counterintuitive results must be carefully examined. We suggest several issues to consider in this analytic process. If the data is determined to be valid, consideration must then be made towards alternative explanations for the counterintuitive results observed. Such results may in fact indicate that current clinical knowledge is incomplete or not have been firmly based on empirical evidence and function to inspire further research into the factors involved.
IntrODuCtIOn
What do we mean by counterintuitive data? It is data that presents unexpected results that may clash with common sense or what has been previously published and accepted
by the medical community. In practice, clini-cians have long dealt with such results in individual bits but have had the vast advan-tage of being able to examine the concurrent state of the patient and react in real time by repeating a lab test or tracking ongoing monitor data. These responses function to identify the prior result as a non-repeatable error or as a genuine anomaly. However, this approach is not applicable to the context of retrospective data analysis. Furthermore, the counterintuitive data revealed in such anal-yses is likely to be more involved than a single aberrant lab or vital sign value. In today’s data driven healthcare system, retrospective data analyses are becoming more and more common. We can therefore logically expect to encounter a greater incidence and variety of counterintuitive values and results that are impossible to confirm by repetition, diffi-cult to confirm or deny by context, but still require interpretation.
The question then becomes how best to approach such results? Are they incor-rect simply because they weren’t what was expected? And was the expectation itself based on subjective assumptions or objec-tive conclusions? When our prior expecta-tions are not met, are we dealing with truly faulty data or do our expectations need to be reset by what are reliable, but counterin-tuitive, results. For example, we have learnt
strengths and limitations of this study
► Large sample size with minimal covariate data missing.
► Multiple regression models with multiple sensitivity analyses.
► High internal validity shown by use of falsification hypothesis testing.
► Lack of oral analgesic data.
► Recognising that correlation does not equal causation and further work is needed to confirm case results.
Protected by copyright.
on October 22, 2019 at Massachusetts Institute of Technology.
Open access
that intensive care practices common in the past such as large tidal volume ventilation, the use of pulmonary artery catheters and the use of lidocaine infusions in myocardial infarction led to no benefit or injury.1–3 Were these unexpected negative outcomes initially missed because outcomes data was not being carefully analysed or perhaps ignored or interpreted as counterintuitive to the level of unbelievability? How can the situation be dissected retrospectively so that counterintuitive data can be identified as truly spurious versus simply not being consistent with our prior experience which may itself be faulty and require data driven correction?
In this paper, we explore a case in which the results contradicted previous reports and our clinical expec-tations. Using the Medical Information Mart for Inten-sive Care-III (MIMIC-III) a critical care database that was developed and maintained by the Laboratory for Computational Physiology at the Massachusetts Institute of Technology,4 we retrospectively selected a cohort of patients that underwent a coronary artery bypass graft (CABG) procedure and evaluated the effect of perceived pain on mortality and hospital length of stay (LOS). Our initial hypothesis was that increased levels of perceived pain would correlate with worse patient outcomes such as increased hospital length of stay. This would be in line with the current literature that suggest optimal pain control leads to increased mobility, earlier ambulation and improved outcomes.5–7 Contrary to the literature, we found that higher levels of pain were associated with reduced mortality and reduced LOS. We then discuss potential causes of these results and the general issue of dealing with counterintuitive results in retrospective data analyses.
CAse Population
We selected patients from the MIMIC database who met all of the following inclusion criteria and none of
the exclusion criteria. Inclusion criteria included: (1) Adult >18 years old, (2) who underwent CABG surgery and (3) was extubated within 24 hours after arrival to the intensive care unit (ICU). Exclusion criteria were: (1) Non-CABG surgical procedure and (2) missing data on confounding variables. Patients were identified using Current Procedural Terminology (CPT) codes: The following CPT codes corresponded to the CABG proce-dure: 33 510 to 33 516 for venous grafting only for coro-nary artery bypass and 33 533 to 33 548 for arterial grafting for coronary bypass. The final study cohort contained 844 patients (figure 1).
The MIMIC-III database included 1917 patients who underwent CABG with 844 meeting the study criteria. CABG was chosen for the investigation as it is a common procedure with the majority of patients having no or few postoperative complications and relatively predictable recoveries.5 Due to the nature of the surgical procedure which requires sternal spreading for exposure, there is an expected high analgesic burden immediately after surgery.
Outcomes
The primary outcome assessed was mortality at 30 days. Secondary outcomes were mortality at 1 year and hospital LOS. In the MIMIC database, mortality data for patients who die after hospital discharge is derived from the social security death registry.4
exposures
The exposures of interest were pain levels reported by the patient immediately and in the subsequent interval after ICU extubation. Pain levels on a scale of 0 to 10 were regularly self-reported by patients to ICU nurses and recorded in the database, generating a continuum of measurements for each patient. The mean, median and maximum pain levels were used for separate analyses. Concomitant measurements of heart rates, respiratory rates and systolic blood pressures were also compared against their simultaneously recorded pain measurement.
Intravenous (IV) opiate administration was extracted from the database. MIMIC contained data for the following medications: Morphine, fentanyl, hydromor-phone and meperidine. The was no data in MIMIC corre-sponding to the administration of oral analgesics.
We also looked for an association of pain and nausea for use in falsification hypothesis testing. The presence of nausea was derived from the nursing notes stored in the database. A positive nausea exposure was defined as the mention ‘nausea’ or ‘nauseous’ in the nursing note with no negative descriptor, such as ‘not nauseous’ or ‘denies nausea’, attached.
Covariates
Several variables found to be linked to worse patient outcomes in previous studies were included to control for confounding in the regression models; demographic factors, comorbid conditions and illness severity score
Figure 1 Shows selection of patient cohort from MIMIC database. After selecting those who underwent CABG procedure and excluding those with no pain measurements, 844 patients were extubated within 24 hours following surgery and included in the cohort. CABG, coronary artery bypass graft; MIMIC, Medical Information Mart for Intensive Care.
Protected by copyright.
on October 22, 2019 at Massachusetts Institute of Technology.
http://bmjopen.bmj.com/
on admission to the ICU.8 9 Comorbid burden was repre-sented by the Elixhauser index which is determined by the aggregate presence or absence of 30 different comorbid conditions as detected by International Clas-sification of Diseases (ICD)-9 codes.10 These conditions include but are not limited to cardiovascular disorders such as hypertension, congestive heart failure, coronary artery disease and peripheral vascular disease; pulmo-nary disorders such as chronic obstructive pulmopulmo-nary disease; endocrine disorders such as diabetes and hypo-thyroid; obesity; drug and alcohol use disorders; renal disease; liver disease. Illness severity was captured using the Oxford Acute Severity of Illness Score (OASIS), which is calculated on admission to the ICU and takes into account age, heart rate, Glasgow coma scale, mean arterial pressure, temperature, respiratory rate, ventila-tory status, urine output, pre-ICU in-hospital LOS and whether or not the patient underwent elective surgery. Studies have shown OASIS is comparable to other illness severity ratings in predicting outcomes such as mortality and length of stay.11
Patient and public involvement
This research was done without patient or public involve-ment. They were not invited to contribute to the develop-ment of our methodology, our outcomes, nor the writing of our paper.
statistical analysis
Analysis was carried out using R V.3.4.0 and SAS V.9.4. Binomial logistic regression models were fitted using maximum likelihood estimation to compare the pain measures with 30 day and 1 year mortality. Linear regres-sion was used to model the relationship between mean pain scores and hospital LOS. Age, gender (male refer-ence), Elixhauser index and OASIS score were included in the models to account for potential confounders. In a separate regression, mean pain levels were catego-rised into four ordinal groups of no pain (0/10), mild pain (1 to 3), moderate pain (3 to 6) and severe pain (7 to 10) in accordance with the National Institutes of Health (NIH) Pain Consortium.12
Analysis of variance (ANOVA) was used to determine if there was a significant variation in heart rate, respiratory rate and/or systolic blood pressure, when compared with the concurrent pain assessment.
IV analgesia medications were converted to their morphine equivalents based on the National Pharma-ceutical Council guidelines.13 The IV analgesia was subdi-vided into total dose in the first 24 hours, mean dose per ICU course day and total dose during ICU course. ANOVA models were used to determine if there were any significant variation in administration of IV analgesics among the four categorised pain groups.
Two sensitivity analyses were performed to assess the robustness of the observed effects. The first included the same statistical tests in all postoperative CABG patients
regardless of duration of intubation. The second sensi-tivity analysis excluded patients who died in the hospital.
To add validity to the potential observed associations, falsification hypothesis testing using Prasad and Jena’s methodology was employed. A distinct and highly unlikely hypothesis is tested against the exposure of interest, pain in this case.14 We used nausea, a symptom with no known correlation to pain, and tested it against the four different pain metrics.
results
The database included 844 patients who underwent a CABG procedure and were extubated within 24 hours. There were 68 patients who on average reported no pain during their ICU stay after extubation, 419 with mild pain, 336 with moderate pain and 21 with severe pain. The mean frequency of pain measurements was 19.8 measure-ments per patient. The distribution of patient charac-teristics, including age, gender, illness acuity on ICU admission (OASIS) and comorbidity index is reported in table 1. There was no significant difference noted in the frequency in which pain was assessed in those who experienced lower pain levels when compared with those who experienced increased pain levels. The number of comorbidities ranged from 0 to 9. Bivariate analysis showed increasing OASIS was significantly associated with increased mortality and increased LOS (p<0.05). No significant differences were found in the amount of IV analgesia administered among the pain subgroups.
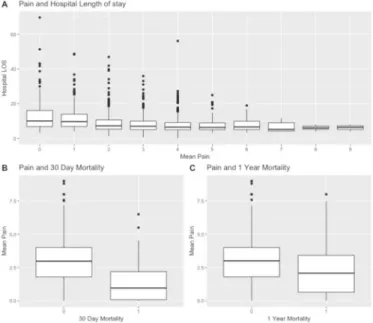
Bivariate analysis (figure 2) shows a correlation between increasing pain levels and improved outcomes among these patients who had no intra-operative complications and were extubated within 24 hours of arrival in the ICU. Higher pain levels for this specific cohort of patients who were fast-tracked after CABG were found to be associated with decreased hospital LOS. Those who experienced lower levels of pain in the ICU were more likely to be dead at 30 days and 1 year.
Multivariate regression analysis was performed to adjust for confounding. Four different models using mean, median and maximum pain scores and pain cate-gories were tested against the clinical outcomes with the results displayed in table 2. The logistic regression models consistently showed that increasing pain was associated with reduced odds of death at 30 days and 1 year after adjustment for illness severity and comorbid conditions. All the linear models demonstrated that increasing pain levels were also associated with decreased hospital LOS, except for the model that looked at the maximum pain score, which showed an opposite effect. R-squared values for the linear regression models varied between 0.25 and 0.3 for all the models. Complete statistical data from all regression models can be found in the online supplemen-tary materials file.
No significant variations were noted in heart rate, respi-ratory rate or blood pressure with increasing pain levels.
Protected by copyright.
on October 22, 2019 at Massachusetts Institute of Technology.
Open access
Sensitivity analysis was employed to examine all patients regardless of duration of intubation, expanding the sample size to 1889 patients. The results were similar for 30 day mortality and hospital LOS as regards effect size and statistical significance; however, the results were not statistically significant for 1 year mortality (table 2). A total of 22 CABG patients were noted to have expired in the hospital, our cohort included 15 of these in hospital deaths. An additional sensitivity analysis excluded patients who died in the hospital - these results were consistent with the prior models and were statistically significant for hospital LOS, but not for mortality (table 2).
As expected, the presence of nausea was not found to be associated with any of our pain measures in our falsifi-cation testing, decreasing the possibility that the previous results are erroneous or solely due to chance.
DIsCussIOn Case study
We will first discuss our unexpected results and then discuss the general issue of counterintuitive data. Our results that increasing levels of patient-reported pain severity post-CABG surgery are associated with better
clinical outcomes were not consistent with our initial hypothesis that better outcomes correlate with better pain control as per the reported literature. In fact, prior studies have found increased levels of pain in the hospital to be associated with increased mortality.15
The difference in the study cohort between our study and others may explain some of the discordance. Our initial analysis was limited to ‘fast-tracked’ patients who did not have intra-operative complications and were extu-bated early in their ICU course. These patients made up 44% of the database patients. Studies that have reported worse clinical outcomes associated with postoperative pain did not select for a relatively healthy sub-cohort of patients. Why would patients with higher levels of pain have better outcomes? It is well documented that an increased inflammatory reaction is associated with increased pain. Pro-inflammatory cytokines such as interleukin-1 beta, interleukin-6 and tumour necrosis factor-alpha have been directly implicated in the physiology of pain.16 17 These cytokines have also been found to be directly involved in wound healing through the stimulation of processes such as keratinocyte and fibroblast proliferation and synthesis and breakdown of extracellular matrix proteins.18 We
Table 1 Shows the distribution of the outcomes and covariates in the patient cohort
No Pain Mild Moderate Severe P value
n 68 419 336 21 Age (mean [SD]) 71.50 (10.61) 67.75 (10.54) 64.98 (9.73) 65.13 (12.85) <0.001 Gender = male (%) 45 (66.2) 333 (79.5) 282 (83.9) 14 (66.7) 0.003 OASIS (mean [SD]) 31.96 (7.25) 30.32 (6.47) 31.44 (6.35) 30.57 (6.20) 0.056 E_score (%) <0.001 0 4 (5.9) 96 (22.9) 87 (25.9) 7 (33.3) 1 12 (17.6) 116 (27.7) 97 (28.9) 4 (19.0) 2 12 (17.6) 81 (19.3) 79 (23.5) 4 (19.0) 3 10 (14.7) 61 (14.6) 46 (13.7) 3 (14.3) 4 12 (17.6) 29 (6.9) 16 (4.8) 1 (4.8) 5 6 (8.8) 19 (4.5) 8 (2.4) 2 (9.5) 6 7 (10.3) 8 (1.9) 2 (0.6) 0 (0.0) 7 2 (2.9) 4 (1.0) 1 (0.3) 0 (0.0) 8 0 (0.0) 4 (1.0) 0 (0.0) 0 (0.0) 9 3 (4.4) 1 (0.2) 0 (0.0) 0 (0.0) Mortality In hospital (%) 9 (13.2) 5 (1.2) 1 (0.3) 0 (0.0) <0.001 30 day (%) 10 (14.7) 10 (2.4) 1 (0.3) 0 (0.0) <0.001 1 year (%) 16 (23.5) 22 (5.3) 7 (2.1) 1 (4.8) <0.001 Narcotics First 24 hours (SD) 4.17 (5.52) 6.24 (9.85) 9.28 (25.89) 6.38 (8.07) 0.059 Daily mean (SD) 5.23 (5.43) 8.43 (7.82) 17.09 (89.87) 8.68 (8.06) 0.162 Total narcotics (SD) 37.30 (101.39) 21.19 (70.34) 29.15 (188.08) 9.87 (8.94) 0.682
E_score, Elixhauser index. OASIS score ranges from 0 to 75, with higher scores indicating more severe disease. Elixhauser index ranges from 0 to 9, with higher scores indicating a greater number of comorbid conditions; OASIS, oxford acute severity of illness score.
Protected by copyright.
on October 22, 2019 at Massachusetts Institute of Technology.
http://bmjopen.bmj.com/
speculate that those patients who demonstrated better outcomes mounted a more robust inflammatory response leading to more pain, but also to increased healing ability.
Another possibility is that higher perceived pain levels represent a proxy for a generally better state of health, including superior physiological function of the cardio-vascular, respiratory, renal and hepatic systems. In tandem, these systems act to metabolise and eliminate anaesthetic and analgesic drugs so that the net pharma-cokinetic result would likely be increased susceptibility to pain due to less administered agent remaining at active sites. Furthermore, patients with better cardiovascular
function would likely have better cerebral perfusion with improved central neurological function, and thereby have a pharmacodynamic reason for perceiving more pain. Also patients who are generally in better overall condi-tion would be expected to manifest better outcomes. These thoughts are admittedly speculative and additional research is needed to explore these possibilities.
It is important to point out that the goal of clinicians should not be in any way to maximise pain to optimise outcomes. Conventional approaches that aim to control pain adequately should be employed. Our observation is just that - an observation of an association and conjec-tures of possible linking mechanisms but is not intended in any way to drive pain management policy in the direc-tion of tolerating undertreated pain.
We performed sensitivity analyses, one including all patients regardless of postoperative ventilation duration and another excluding patients who died during hospital-isation and reached similar conclusions. When excluding in-hospital deaths, we discovered the 30 day mortality rate had a similar OR, but was no longer statistically signifi-cant. This is most likely due to the low mortality rate after hospital discharge following CABG, making it difficult to detect a statistically significant effect.
We believe that researcher bias is a non-issue as these findings were not expected, but rather, the opposite. Sampling bias was also minimal. Our inclusion criteria were predefined prior to database sampling and only 28 patients needed to be excluded due to missing data. We performed multiple sensitivity analyses to deter-mine if those that were excluded would have influenced our results. However, the study has several limitations inherent in any retrospective data analysis. We acknowl-edge that correlation does not equal causation and further research is needed to determine the underlying physiological mechanism for the results seen. Due to the self-reported nature of the pain scores, reporting bias is a concern. Some patients may have over-reported
Figure 2 Three plots demonstrating the bivariate
relationship between the outcomes of interest and mean pain. Plot A shows decreased length of stays with increased mean pain levels. Plot B and Plot C show that, on average, those who expired at 30 days and 1 year marks experienced lower in hospital pain levels than those who did not expire. LOS, length of stay.
Table 2 Shows results from main analysis and the two sensitivity analyses
Model 30 day mortality odds(95% CI) 1 year mortality odds(95% CI) Length of stay estimate(95% CI)
Primary analysis:
Mean pain 0.457*** (0.304 to 0.687) 0.710*** (0.571 to 0.881) −0.916*** (−1.159 to 0.673) Median pain 0.639*** (0.466 to 0.877) 0.856* (0.727 to 1.008) −0.696*** (−0.886 to 0.506) Max pain 0.812*** (0.693 to 0.951) 0.887** (0.790 to 0.995) 0.148* (−0.02 to 0.32) Categorical pain 0.214*** (0.091 to 0.502) 0.450*** (0.266 to 0.760) −2.270*** (−2.903 to 1.637) Sensitivity analysis 1: including all patients regardless of intubation lengths
Mean pain 0.592*** (0.456 to 0.768) 0.898 (0.785 to 1.027) −0.709*** (−0.866 to 0.552) Categorical pain 0.328*** (0.184 to 0.586) 0.740* (0.527 to 1.037) −1.706*** (−2.110 to 1.302) Sensitivity analysis 2: excluding hospital mortality patients
Mean pain 0.803 (0.567 to 1.137) 1.027 (0.889 to 1.187) −0.701*** (−0.858 to 0.544) Categorical pain 0.709 (0.309 to 1.625) 1.038 (0.714 to 1.509) −1.680*** (−2.082 to 1.278) *, **, *** denotes significance at the 90%, 95% and 99% level, respectively.
Protected by copyright.
on October 22, 2019 at Massachusetts Institute of Technology.
Open access
and others under-reported their pain. We also recog-nise that analgesic administration is a confounder and were unable to completely control for this due to lack of information regarding oral analgesics in the data-base. However, with respect to intravenous analgesics, we attempted to limit this potential confounder by excluding those with prolonged intubations who would inherently have received and required greater doses of sedatives and analgesics. We also compared the amount of narcotics that patients were receiving and did not observe any significant differences among the various pain groups. Despite measures taken to guarantee internal validity, we anticipate appropriate scepticism with regard to gener-alisability of the findings. This, of course, is of genuine concern given the current state-of-affairs where clinicians are already inundated with conflicting studies of ques-tionable quality. We therefore invite other investigators to replicate (and expand) our analysis in other databases.
Counterintuitive results and examples
As noted, our findings were contrary to clinical expec-tations and to most published works which associate increased pain with worse outcomes.15 19 20 Encountering counterintuitive results is not unique to retrospective data analysis. Clinicians encounter unexpected, possibly aber-rant, values in situations such as the evaluation of labo-ratory and monitor data. When a possibly spurious lab result is obtained, the usual response is to repeat the test. When the second test comes back with a more acceptable value, we generally then ignore the unexpected value. But what if the repeat value is also aberrant? Do we repeat it again or do we begin to believe that the value is ‘real’ and start to formulate a response to a clinical problem? In this case, it is the consistency and reproducibility of the counterintuitive value that drives its possible validity. The details of this process are determined by the overall clin-ical risks involved. The consistency we found in the pain score values drove us to consider the possibility that the values were ‘real’ even though they were counterintuitive in terms of our expectations.
Another issue in evaluating to counterintuitive values is whether they are possible. Impossible values would include a potassium of 64.5, one incompatible with life. But a potassium of 7.3 is a possible value. The pain values asso-ciated with better outcomes were unexpected, but not so high that they were impossible in the observed context.
One question that would arise with a potassium of 7.3 would be that of continuity - did the value occur suddenly or gradually in a stream of normal values? Were surrounding values similarly abnormal? In the context of persistently abnormal values, for example, untreated uraemia, a normal value would be counterintuitive. So that while most counterintuitive values will tend to be out of the ‘normal range’, they will not necessarily be so. In the context of increasing values, it might simply be the first one that was not only out of the normal range, but that crossed the line into a critical range.
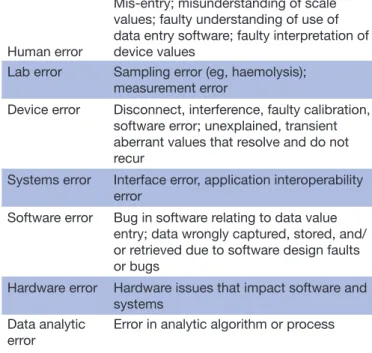
The fundamental question is whether counterintuitive results are actually false results or does the problem lie in our perception of what should be. Table 3 displays a cate-gorisation of error types that could result in faulty data. We are not able to attribute the counterintuitive data we observed to any of these factors, however.
How can counterintuitive results be approached in secondary data analyses? Table 4 displays characteristics that may distinguish reliable (but counterintuitive) from truly faulty data. With consideration of these factors, the first investigative step is to retrace the process and work flow involved in data entry so far as possible. Our data was obtained at the institution of several of the authors where nurses are trained to assess pain on a stan-dard scale from 0 to 10. There are several potential faults to this method. The nursing staff could neglect to regu-larly assess pain or neglect to enter the information into the medical record generating the database. While this may alter a few data points, it is unlikely to systematically affect all data unless there was an obvious glaring insti-tutional issue affecting every nurse and every data entry.
After determining that the data source is valid, addi-tional statistical tests can be run on the patient cohort. Tests such as the falsification hypothesis testing we used, add validity to the results as they show that the cohort follows other generally known principles. In our study, falsification analysis provided support for our findings.
Concurrent contextual data can also help to confirm the veracity of data - for example, one could examine ECGs if hyperkalaemia was being analysed. We examined concomitant vital signs during the time of pain measure-ments. We expected to observe significant increases with higher pain levels, but did not: With the combination of analgesics, residual anaesthetics and the concurrent use of
Table 3 Putative causes of truly faulty data
Human error
Mis-entry; misunderstanding of scale values; faulty understanding of use of data entry software; faulty interpretation of device values
Lab error Sampling error (eg, haemolysis); measurement error
Device error Disconnect, interference, faulty calibration, software error; unexplained, transient aberrant values that resolve and do not recur
Systems error Interface error, application interoperability error
Software error Bug in software relating to data value entry; data wrongly captured, stored, and/ or retrieved due to software design faults or bugs
Hardware error Hardware issues that impact software and systems
Data analytic
error Error in analytic algorithm or process
Protected by copyright.
on October 22, 2019 at Massachusetts Institute of Technology.
http://bmjopen.bmj.com/
drugs that directly affect vital signs such as beta-blockers, the lack of correlation is probably not surprising. In fact, we learnt that in this setting, it appears to be inadvisable to use vital sign changes as a proxy for the presence of unvoiced pain. Finally, one can attempt to physiologically explain the disparity between the observed and expected results as we did above for the case of post - CABG pain.
The use of lower thresholds for blood transfusions in the ICU is an example of a counterintuitive finding. ICU target haemoglobin levels were historically set at greater than 10 g/dL, theoretically to ensure adequate oxygen delivery.21 This led to increased transmission of blood borne diseases, unnecessary healthcare expenditures and actually worse outcomes.22 Later research showed that this rule was not necessary for most patients, but only for selected patients such as those with acute coronary syndrome actively experiencing chest pain. The initially counterintuitive findings that lower haemoglobin levels were not only acceptable but preferable in most cases, served as research triggers to more fully elucidate optimal clinical practice. Our case may serve as an analogous research trigger in terms of optimally managing postop-erative pain. Outcomes such as mortality and LOS are complex phenomena driven by many factors - to observe a clear and robust statistical effect such as we did is strongly
suggestive that something ‘real’ is occurring even if the data were counterintuitive.
The final step when dealing with counterintuitive data is to look for additional evidence that confirms the reliability of the results (perhaps this could be termed ‘confirmatory metadata’). With respect to our CABG case, the analysis should be rerun on additional databases and in different settings. Just as clinicians continued to manage intensive care unit anaemia as they always had until more definitive results were reported, our results should not impact the analgesic care of patients at this point. However, we hope that we have raised the issue in the appropriate minds that outcomes may benefit from approaches slightly different from usual. After all, one can easily eliminate all pain from postoperative patients, but they would have to remain sedated and ventilated for an indefinite period of time to do so and after they are extubated, pain management should not be so aggressive that it leads to apnoea and respiratory arrest. In other words, there may be a detectable level of tolerable pain that leads patients to their best outcomes and no honest clinician will guarantee a patient that they will have no pain at all after a procedure like a sternal-disrupting CABG.
COnClusIOn
Contrary to our expectations, we observed, in a retro-spective analysis of electronic health records, that post-CABG fast-track patients with higher pain scores had better outcomes. The increasing use of electronic health records for secondary analysis will likely lead to an increasing incidence of such apparently counterintuitive results. While the first step in this situation is to attempt to confirm the reliability of both the analytical process and the data itself, such findings that prove to be robust may lead to further ideas and subsequent research that drive future clinical care. On the other hand, clinicians must be careful in terms of modifying their practices until the implications of such counterintuitive (or any) data have been thoroughly vetted and confirmed in diverse data-base contexts and via the peer review process.
Acknowledgements We would like to thank J Michael Jaeger, MD, PhD of the University of Virginia School of Medicine, for his assistance with background information r eferences.
Contributors ED was responsible for the data extraction, the initial statistical analysis and writing and editing the manuscript. NM was involved in validating the statistical models and participated in editing the manuscript. DS was responsible for assisting with background information and editing the manuscript. LC was the project supervisor, responsible for project conception and manuscript editing.
Funding Leo Anthony Celi receives extramural funding from the National Institute of Health.
Competing interests None declared.
Patient consent for publication Not required.
Provenance and peer review Not commissioned; externally peer reviewed.
Data sharing statement The datasets generated for the current study were derived from the MIMIC-III Database available at https:// mimic. physionet. org/. The
Table 4 Criteria to establish possible validity of counterintuitive data
Viability
Is the value consistent with clinical reality? Are the values even possible ones?
Consistency If applicable (not always the case in retrospective analysis), is the value observed consistently, such as in our pain score observations?
Continuity What is the context of the value - does it occur as a sudden aberrant value (a ‘blip’) or as one of increasingly aberrant values (a trend)?
Identity Are the circumstances that produced the data truly identical so far as identifiable? ie, Would the same circumstances produce the same data results in a different database, institutional or cultural context?
Reproducibility Is the value reproducible on repetition? While reproduction cannot be performed on retrospective data, can the values be reproduced on observation across different clinical databases or in the same database over ongoing time?
Sensibility Even if it does not meet current clinical expectations, does it make potential sense in associated clinical context? Curiosity Does it drive the observer to seek
alternative better solutions and pose questions for further research?
Protected by copyright.
on October 22, 2019 at Massachusetts Institute of Technology.
Open access
data subsets and statistical code used in this project can be found at https:// github. com/ ErikWDoty/ PainProject.
Open access This is an open access article distributed in accordance with the Creative Commons Attribution Non Commercial (CC BY-NC 4.0) license, which permits others to distribute, remix, adapt, build upon this work non-commercially, and license their derivative works on different terms, provided the original work is properly cited, appropriate credit is given, any changes made indicated, and the use is non-commercial. See: http:// creativecommons. org/ licenses/ by- nc/ 4. 0/. reFerenCes
1. Gajic O, Dara SI, Mendez JL, et al. Ventilator-associated lung injury in patients without acute lung injury at the onset of mechanical ventilation. Crit Care Med 2004;32:1817–24.
2. Connors AF, Speroff T, Dawson NV, et al. The effectiveness of right heart catheterization in the initial care of critically ill patients. SUPPORT Investigators. JAMA 1996;276:889–89.
3. Hine LK, Laird N, Hewitt P, et al. Meta-analytic evidence against prophylactic use of lidocaine in acute myocardial infarction. Arch Intern Med 1989;149:2694–8.
4. Johnson AE, Pollard TJ, Shen L, et al. MIMIC-III, a freely accessible critical care database. Sci Data 2016;3:160035.
5. Sutherland J, Liu G, Crump T, et al. Relationship between
preoperative patient-reported outcomes and hospital length of stay: a prospective cohort study of general surgery patients in Vancouver, Canada. J Health Serv Res Policy 2019;24:29–36.
6. Bykowski MR, Sivak W, Garland C, et al. A Multimodal preemptive analgesic protocol for alveolar bone graft surgery: decreased pain, hospital stay, and health care costs. Cleft Palate Craniofac J
2019;56:479–86.
7. Ljungqvist O, Scott M, Fearon KC. Enhanced recovery after surgery: a review. JAMA Surg 2017;152:292–8.
8. Hawkes AL, Nowak M, Bidstrup B, et al. Outcomes of coronary artery bypass graft surgery. Vasc Health Risk Manag 2006;2:477–84. 9. Shroyer AL, Coombs LP, Peterson ED, et al. The Society of Thoracic
Surgeons: 30-day operative mortality and morbidity risk models. Ann Thorac Surg 2003;75:1856–65.
10. Elixhauser A, Steiner C, Harris DR, et al. Comorbidity measures for use with administrative data. Med Care 1998;36:8–27.
11. Johnson AE, Kramer AA, Clifford GD. A new severity of illness scale using a subset of Acute Physiology And Chronic Health Evaluation data elements shows comparable predictive accuracy. Crit Care Med
2013;41:1711–8.
12. Pain Intensity Instruments. 2003, July. from https:// painconsortium. nih. gov/ pain_ scales/ NumericRatingScale. pdf (Retrieved April 9, 2017).
13. Pain: Current understanding of assessment, management, and
treatments. Reston, VA: National Pharmaceutical Council, 2001.
14. Prasad V, Jena AB. Prespecified Falsification End Points. JAMA
2013;309:241.
15. Lewis KS, Whipple JK, Michael KA, et al. Effect of analgesic treatment on the physiological consequences of acute pain. Am J Hosp Pharm 1994;51:1539–54.
16. Watkins LR, Milligan ED, Maier SF. Glial proinflammatory cytokines mediate exaggerated pain states: implications for clinical pain. Adv Exp Med Biol 2003;521:1–21.
17. Zhang JM, An J. Cytokines, inflammation, and pain. Int Anesthesiol Clin 2007;45:27–37.
18. Werner S, Grose R. Regulation of wound healing by growth factors and cytokines. Physiol Rev 2003;83:835–70.
19. Rodgers A. Reduction of postoperative mortality and morbidity with epidural or spinal anaesthesia: results from overview of randomised.
BMJ 2000;321:1493.
20. Wu CL, Hurley RW, Anderson GF, et al. Effect of postoperative epidural analgesia on morbidity and mortality following surgery in medicare patients. Reg Anesth Pain Med 2004;29:525–33. 21. Wang JK, Klein HG. Red blood cell transfusion in the treatment
and management of anaemia: the search for the elusive transfusion trigger. Vox Sang 2010;98:2–11.
22. Seitz KP, Sevransky JE, Martin GS, et al. Evaluation of RBC Transfusion Practice in Adult ICUs and the Effect of Restrictive Transfusion Protocols on Routine Care. Crit Care Med
2017;45:271–81. Protected by copyright.
on October 22, 2019 at Massachusetts Institute of Technology.
http://bmjopen.bmj.com/