S
EMICONDUCTOR
D
ISK
L
ASER
-B
ASED
F
REQUENCY
C
OMBS
Thesis presented to the Faculty of Science for the degree of
Doctor of Science
Nayara Jornod
M. Sc. in Physics
submitted on 13.04.2018 to the jury:
Prof. Thomas Südmeyer
Director
Prof. Majid Ebrahim-Zadeh
Examiner
Dr. Keith G. Wilcox
Examiner
Dr. Stéphane Schilt
Examiner
2000 Neuchâtel – Suisse Tél : + 41 (0)32 718 21 00 E-mail : [email protected]
IMPRIMATUR POUR THESE DE DOCTORAT
La Faculté des sciences de l'Université de Neuchâtel
autorise l'impression de la présente thèse soutenue par
Madame Nayara JORNOD
Titre:
“Semiconductor Disk Laser-Based
Frequency Combs”
sur le rapport des membres du jury composé comme suit:
• Prof. Thomas Südmeyer, directeur de thèse, Université de Neuchâtel, Suisse • Prof. Majid Ebrahim-Zadeh, ICFO-The Institute of Photonic Sciences,
Barcelone, Espagne
• Dr Keith G. Wilcox, University of Dundee, Royaume-Uni • Dr Stéphane Schilt, Université de Neuchâtel, Suisse • Dr Valentin J. Wittwer, Université de Neuchâtel, Suisse
Keywords – Mots-clés
Keywords
Semiconductor disk laser (SDL), vertical external-cavity surface-emitting laser (VECSEL), modelocked laser, optical frequency comb, optical amplifier, waveguide, supercontinuum generation, carrier-envelope offset (CEO), self-referencing, laser stabilization, metrology, frequency noise, phase noise, optical parametric oscillator (OPO)
Mots-clés
Laser à disque semi-conducteur (SDL), laser à cavité verticale externe à émission de surface (VECSEL), laser à verrouillage de modes, peigne de fréquences optique, amplificateur optique, guide d’onde, génération de supercontinuum, décalage de phase entre porteuse en enveloppe (CEO), auto-référencement, stabilisation de laser, métrologie, bruit de fréquence, bruit de phase, oscillateur paramétrique optique (OPO)
Abstract
This thesis studies the first self-referenced frequency combs based on modelocked semiconductor disk lasers (SDLs).
The generation of stabilized frequency combs based on ultrafast lasers has been a significant breakthrough for many applications in various fields of physics, spectroscopy and metrology. Optical frequency combs can serve as a frequency ruler that provides a direct and phase-coherent link between optical and microwave frequencies. Despite the fact that optical frequency combs revolutionized numerous scientific areas, so far, they have not entered large-scale markets. For this, comb laser sources have to be improved, targeting high reliability, while keeping the source compact and cost-efficient.
Ultrafast SDLs, also referred to as vertical external-cavity surface-emitting lasers (VECSELs), are a very promising technology for this purpose as they are based on the semiconductor technology, allowing for low-cost wafer-scale mass-production. They enable very compact laser setups and have large emission wavelengths flexibility inherited from the band-gap engineering. In addition, they do not suffer from Q-switching instabilities and stable fundamental modelocking was demonstrated at repetition rates ranging from 100 MHz to 100 GHz. High repetition rate frequency combs have an increased power per comb line that is beneficial
laser, the repetition frequency and the carrier-envelope offset (CEO) frequency is required for most comb applications. However, the detection of the CEO frequency is challenging and no stabilization was achieved before for any ultrafast semiconductor laser. The CEO detection is usually done using a self-referencing scheme that requires a coherent octave-spanning spectrum, which can be generated using highly nonlinear fibers such as photonic crystal fibers (PCFs). In order to maintain the coherence in the spectral broadening process, ultrashort femtosecond pulses (typically <200 fs) with kilowatt peak power are required. However, even though peak powers up to 6.3 kW and pulse durations down to 96 fs have been demonstrated in SDLs, the combination of both has still not been reached. Therefore, the octave-spanning spectrum generation in a PCF directly from the output of the laser could not be demonstrated until now and additional amplification and compression stages are necessary.
In this work, an efficient fiber amplifier has been developed, which led to the first demonstration of the CEO frequency stabilization of an ultrafast SDL. The amplified pulses were temporally compressed and sent to a commercially available PCF for the coherent octave-spanning supercontinuum spectrum generation. A self-referencing scheme enabled the CEO detection and stabilization via a modulation of the pump power. This result demonstrates the feasibility of a frequency comb based on the SDL technology and constitutes an important step in the further development of compact frequency combs.
Finally, wavelength conversion in an optical parametric oscillator is studied to overcome the current limitations in the emission wavelength of ultrafast SDLs. Emission in the mid-infrared is highly attractive since a large number of molecules have strong rotational-vibrational transitions in this spectral range and the development of mid-infrared frequency combs enables simple, fast and highly sensitive molecular spectroscopy sensing methods.
Résumé
Cette thèse présente une étude des premiers peignes de fréquences auto-référencés basés sur des lasers à disques semi-conducteurs (SDLs) à modes verrouillés en phase.
L’avènement des peignes de fréquences stabilisés basés sur des lasers à impulsions ultra-courtes a permis une avancée significative et de nombreuses applications dans divers domaines de la physique, de la spectroscopie et de la métrologie. Les peignes de fréquences optiques peuvent être utilisés comme une règle de mesure dans le domaine des fréquences fournissant un lien direct et cohérent entre les fréquences optiques et micro-ondes. Bien que les peignes de fréquences optiques aient révolutionné de nombreux domaines scientifiques, ils n'ont pas encore pénétré les marchés à grande échelle. Pour cela, les sources laser doivent être améliorées, en ciblant une haute fiabilité tout en gardant la source compacte et économiquement attractive.
Les SDLs à impulsions ultra-courtes, également appelés lasers à cavité verticale externe à émission de surface ou VECSELs (de l’anglais
vertical external-cavity surface-emitting lasers), constituent une source laser
très prometteuse à cet égard de par la technologie des semi-conducteurs qui permet une production de masse à faible coût. Ils rendent possibles des configurations de lasers très compactes et présentent une grande
démontré à des taux de répétition allant de 100 MHz à 100 GHz. Les peignes de fréquences à taux de répétition élevés ont une puissance accrue par mode, ce qui est bénéfique pour des applications telles que l'astronomie ou la génération de signaux micro-ondes à faible bruit.
La stabilisation des deux degrés de liberté du laser à verrouillage de mode, la fréquence de répétition et la fréquence du décalage de phase entre la porteuse et l'enveloppe (carrier-envelope offset en anglais, CEO) est nécessaire pour la plupart des applications. Cependant, la détection de la fréquence CEO est difficile et aucune stabilisation n'avait été obtenue auparavant pour un laser à semi-conducteur à impulsions ultra-courtes. La détection de la fréquence CEO est généralement effectuée à l'aide d'une méthode d'auto-référencement qui nécessite un spectre cohérent couvrant une octave de fréquence. Ce dernier peut être généré en utilisant des fibres optiques hautement non linéaires telles que des fibres à cristaux photoniques (photonic crystal fibers en anglais, PCFs). Afin de maintenir la cohérence durant le processus d'élargissement spectral, des impulsions ultra-courtes dans le domaine des femtosecondes (typiquement <200 fs) avec une puissance de crête de l’ordre du kilowatt sont nécessaires. Cependant, même si des puissances maximales allant jusqu'à 6.3 kW et des durées d'impulsion allant jusqu'à 96 fs ont été démontrées pour des SDLs, la combinaison des deux n'a pas encore été atteinte. Par conséquent, la génération d’un spectre d'une octave utilisant une PCF directement à partir de la sortie du laser n'a pas pu être démontrée jusqu'à présent et des étapes supplémentaires d'amplification et de compression des impulsions sont nécessaires.
Dans ce travail, un amplificateur à fibre a été développé permettant la première démonstration de stabilisation de la fréquence CEO d'un SDL à impulsions ultra-courtes. Les impulsions amplifiées ont été comprimées temporellement et couplées dans une PCF pour la génération cohérente d’un spectre supercontinuum couvrant une octave. Une technique
d'auto-référencement permet la détection et la stabilisation de la fréquence CEO via une modulation de la puissance de la diode de pompe du laser. Ce résultat démontre la faisabilité d'un peigne de fréquences basé sur la technologie SDL et constitue une étape importante dans le développement des peignes de fréquences compacts.
Finalement, une conversion de longueur d'onde à l’aide d’un oscillateur paramétrique optique a été étudiée, permettant de surmonter les limites actuelles de la longueur d'onde d'émission atteignable avec des SDL à impulsions ultra-courtes. L'émission dans l'infrarouge moyen est très intéressante car un grand nombre de molécules ont de fortes transitions rotationnelles-vibrationnelles dans cette gamme spectrale et le développement de peignes de fréquences dans l'infrarouge moyen permet l’accès à des méthodes de détection de spectroscopie moléculaire simples, rapides et très sensibles.
Contents
Abstract ... v
Résumé ... vii
Contents ... xi
List of symbols and acronyms ... xv
Publications ... xix
Journal publications ... xix
Conference presentations ... xx
Introduction ... 1
Chapter 1 Noise analysis of an ultrafast SDL ... 9
Chapter 2 2.1 Noise in lasers ... 10
2.1.1 CW laser noise and linewidth ... 11
2.1.2 Noise of modelocked lasers ... 14
2.2 Repetition rate frequency noise characterization and stabilization of an ultrafast SDL ... 20
noise without f-to-2f interferometry ... 25
2.4 First investigation of the noise and modulation properties of the carrier-envelope offset in a modelocked semiconductor laser ... 28
2.4.1 References ... 38
Amplification of an ultrafast SDL ... 43
Chapter 3 3.1 High-power amplification of a femtosecond vertical external-cavity surface-emitting laser in an Yb:YAG waveguide ... 44
3.1.1 Introduction ... 45
3.1.2 Experimental setup ... 47
3.1.3 Results and discussion ... 50
3.1.4 Conclusion ... 53
3.1.5 References and links ... 54
CEO frequency stabilization of an ultrafast SDL ... 59
Chapter 4 4.1 Carrier-envelope offset frequency stabilization of a gigahertz semiconductor disk laser ... 62
4.1.1 Introduction ... 63
4.1.2 Experiment and results ... 65
4.1.3 Conclusion ... 74
4.1.4 References ... 75
Towards longer wavelengths ... 81
Chapter 5 5.1 Basic principle of OPOs ... 83
5.1.1 Energy conservation ... 83
5.1.2 Phase matching and conservation of momentum... 84
5.1.3 Quasi-phase matching ... 85
5.1.4 Parametric gain ... 87
5.2 Ultrafast optical parametric oscillator pumped by a vertical
external-cavity surface-emitting laser ... 89
5.2.1 Introduction ... 89
5.2.2 Experiment... 91
5.2.3 Results ... 95
5.2.4 Conclusion ... 98
5.2.5 References and links ... 98
Conclusion and Outlook ... 103
Chapter 6 Bibliography ... 107
List of symbols and acronyms
Symbols
𝑑𝑑eff nonlinear coefficient (pm/V)
𝜀𝜀0 vacuum permittivity (J/V2/m)
𝐸𝐸S signal electric field (V/m)
𝑓𝑓CEO carrier-envelope offset frequency (Hz)
𝑓𝑓rep repetition frequency (Hz)
ℎ Planck constant (J/Hz) 𝐼𝐼p pump intensity (W/m2) 𝑘𝑘 wavenumber (m-1) 𝐿𝐿cr crystal length (m) 𝜆𝜆 wavelength (m) Λ poling period (m) 𝑛𝑛(𝜆𝜆) refractive index 𝑃𝑃av average power (W)
𝑇𝑇meas measurement time (s)
𝛿𝛿𝛿𝛿 optical linewidth (Hz)
𝛿𝛿𝑁𝑁 frequency of the 𝑁𝑁th line of the spectrum of a
comb (Hz)
𝜒𝜒(2) second order nonlinearity 𝛿𝛿 optical frequency (Hz)
𝑤𝑤P pump beam waist 1/𝑒𝑒 field amplitude (m)
Γ gain factor (% or dB) 𝑍𝑍R Rayleigh range (m)
Acronyms
CEO carrier-envelope offset CW continuous wave
DPSSL diode-pumped solid-state laser FN frequency noise
FWHM full width at half maximum HVA high voltage amplifier LBO lithium triborate Mid-IR mid-infrared
MIXSEL modelocked integrated external-cavity surface-emitting laser
OC output coupler
PCF photonic crystal fiber PI proportional integral PLL phase-locked loop
PPLN periodically poled lithium niobate PSD power spectral density
PZT piezo-electric transducer QCL quantum cascade laser QPM quasi-phase matching RIN relative intensity noise RMS root-mean-square SC supercontinuum
SDL semiconductor disk laser
SESAM semiconductor saturable absorber mirror SNR signal-to-noise ratio
SSB single sideband
VCSEL vertical cavity surface-emitting lasers
Publications
Parts of this thesis are published in the following journal papers and conference proceedings. The text and figures are printed as published, only the format of the text, the numbering and the size of figures were adapted to the style of this thesis. All papers are reprinted with permission from the corresponding publishers. The copyright of the original publications are held by the respective copyright holders.
Journal publications
1. N. Jornod, K. Gürel, V. J. Wittwer, P. Brochard, S. Hakobyan, S. Schilt, D. Waldburger, U. Keller, and T. Südmeyer, "Carrier-envelope offset
frequency stabilization of a gigahertz semiconductor disk laser," Optica 4,
1482-1487 (2017).
2. N. Jornod, V. J. Wittwer, C. Kränkel, D. Waldburger, U. Keller, T. Südmeyer, and T. Calmano, "High-power amplification of a femtosecond
vertical external-cavity surface-emitting laser in an Yb:YAG waveguide,"
Opt. Express 25, 16527–16533 (2017).
3. N. Jornod, V. J. Wittwer, M. Gaponenko, M. Hoffmann, N. Hempler, G. P. A. Malcolm, G. T. Maker, and T. Südmeyer, “Ultrafast optical
D. Waldburger, S. M. Link, C. G. E. Alfieri, M. Golling, L. Devenoges, J. Morel, U. Keller, and T. Südmeyer, "First investigation of the noise and
modulation properties of the carrier-envelope offset in a modelocked semiconductor laser," Opt. Lett. 41, 3165–3168 (2016).
5. K. Balskus, S. Schilt, V. J. Wittwer, P. Brochard, T. Ploetzing, N. Jornod, R. A. McCracken, Z. Zhang, A. Bartels, D. T. Reid, and T. Südmeyer, "Frequency comb metrology with an optical parametric oscillator," Opt. Express 24, 8370-8381 (2016).
Conference presentations
1. N. Modsching, C. Paradis, P. Brochard, N. Jornod, K. Gürel, C. Kränkel, S. Schilt, V. J. Wittwer, T. Südmeyer, “Frequency Comb
Stabilization of a 50-fs Thin-Disk Laser Oscillator Operating in a Strongly SPM-broadened Regime”, CLEO, San Jose, May 2018, oral, p. SM4L.6.
2. N. Modsching, C. Paradis, P. Brochard, N. Jornod, K. Gürel, C. Kränkel, S. Schilt, V. J. Wittwer, T. Südmeyer, “Frequency Comb
Stabilization of a 4 W, 50-fs Thin-Disk Laser Oscillator”, EFTF, Torino,
April 2018, oral, p. B2L-A-6.
3. K. Gürel, S. Hakobyan, V. J. Wittwer, N. Jornod, S. Schilt, T. Südmeyer,
“Novel Methods for CEO Stabilization in Fiber Laser Frequency Combs”,
EFTF, Torino, April 2018, oral, p. B2L-A-3.
4. N. Jornod, K. Gürel, V. J. Wittwer, P. Brochard, S. Hakobyan, S. Schilt, D. Waldburger, U. Keller, T. Südmeyer, “Carrier-envelope o↵set frequency
stabilization of an ultrafast semiconductor laser”, Photonics West, San
5. K. Gürel, V. J. Wittwer, S. Hakobyan, N. Jornod, S. Schilt, T. Südmeyer, “Novel techniques for stabilizing fiber laser frequency combs”, Photonics West, San Francisco, CA, February 2018, oral, p. 10512-58.
6. K. Gürel, S. Hakobyan, V. J. Wittwer, N. Jornod, S. Schilt, T. Südmeyer, “CEO frequency stabilization of an ultrafast fiber laser by opto-optical
modulation (OOM) of a semiconductor absorber”, UFO, Jackson Hole, WY,
October 2017, oral.
7. N. Jornod, K. Gürel, V. J. Wittwer, P. Brochard, S. Hakobyan, S. Schilt, D. Waldburger, U. Keller, T. Südmeyer, “Carrier-envelope offset frequency
stabilization of a mode-locked semiconductor disk laser”, ASSL, Nagoya,
September 2017, oral, p. AW1A.6.
8. N. Jornod, K. Gürel, V. J. Wittwer, P. Brochard, S. Hakobyan, S. Schilt, D. Waldburger, U. Keller, T. Südmeyer, “Towards Self-Referencing of a
VECSEL Frequency Comb”, CLEO EU, Munich, June 2017, oral, p.
CF-1.4.
9. N. Jornod, V. J. Wittwer, M. Gaponenko, M. Hoffmann, N. Hempler, G. P. Malcolm, G. T. Maker, T. Südmeyer, “First Ultrafast Optical
Parametric Oscillator (OPO) Pumped by a Vertical External Cavity Surface Emitting Laser (VECSEL)”, Europhoton, Vienna, August 2016, oral,
p. SSl-2.3.
10. N. Jornod, V. J. Wittwer, T. Südmeyer, C. Kränkel, T. Calmano, “High
Power Yb:YAG Waveguide Amplification of a Femtosecond Semiconductor Disk Laser”, CLEO, San Jose, June 2016, oral, p. SF2I.1.
11. N. Jornod, P. Brochard, V. J. Wittwer, S. Schilt, S. Hakobyan, D. Waldburger, S. M. Link, C. G. E. Alfieri, M. Golling, L. Devenoges, J. Morel, U. Keller, T. Südmeyer, “First Investigation of the Noise and
Modulation Properties of the Carrier Envelope Offset Frequency in a Modelocked Semiconductor Laser”, CLEO, San Jose, June 2016, oral,
R. A. McCracken, Z. Zhang, A. Bartels, D. T. Reid, T. Südmeyer, “Frequency comb metrology with a near-infrared optical parametric
oscillator”, CLEO, San Jose, June 2016, oral, p. SM1H.6.
13. P. Brochard, N. Jornod, V. J. Wittwer, S. Schilt, D. Waldburger, S. M. Link, C. G. E. Alfieri, M. Golling, L. Devenoges, J. Morel, U. Keller, T. Südmeyer, “Carrier-envelope offset characterization in a
semiconductor modelocked laser without f-to-2f interferometry”, EFTF, York,
April 2016, oral, p. 1070.
14. S. Schilt, K. Balskus, V.J. Wittwer, P. Brochard, T. Ploetzing, N. Jornod, R. A. McCracken, Z. Zhang, A. Bartels, D. T. Reid, T. Südmeyer, “Noise
characterization and optical frequency measurement with an optical parametric oscillator frequency comb”, 8th Frequency Standard and
Chapter 1
Introduction
Time and frequency are the physical quantities that can be measured with the highest precision. Since the prehistoric era, humankind has been trying to keep track on time. The first reference was the primary source of light on Earth, the apparent motion of the Sun. Later, new methods were developed to reach a finer division of the day. An example is the sundial that consists of a plate and a stick that cast the shadow of the Sun onto a dial divided into the 12 hours of a daytime. The precision of this device strongly depends on its configuration, but cannot be better than a few minutes in one day. In comparison, the optical clocks based on the laser technology developed nowadays can demonstrate stability that corresponds to a clock running with a precision of 4 seconds in the lifetime of the universe1. Throughout the ages, the study of light has played an
important role and has become a physical science called photonics.
A key milestone in the development of photonics was the demonstration of the first laser in 1960 by Maiman2. Since then, lasers have
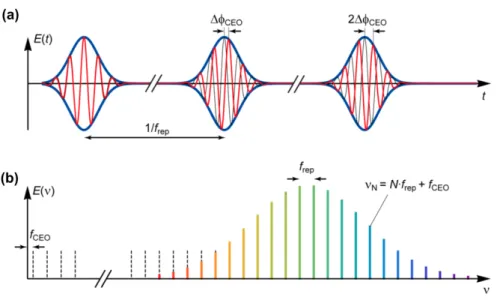
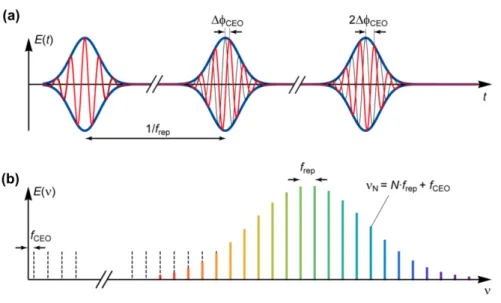
with durations ranging from microseconds down to few femtoseconds. If one looks at the spectrum of a pulse train generated by a modelocked laser in the frequency domain, it corresponds to a comb of lines evenly spaced (Figure 1.1). Two radio frequencies characterize the frequency position in the optical spectrum: the repetition frequency, which is the spacing between two lines and corresponds to the inverse of the time between two consecutive pulses; and the carrier-envelope offset (CEO) frequency, which is the offset of the comb spectrum from the origin of the frequency axis. If these frequencies are known or stabilized, the optical spectrum of the modelocked laser is called a frequency comb. A fully-stabilized frequency comb is a precious tool which can be used as a ruler to measure optical frequencies with high precision. Its discovery was awarded by the Nobel Prize in Physics in 20053,4. Since then, frequency combs have
enabled huge progress and exciting new applications in many domains such as spectroscopy, medicine and fundamental science.
A crucial point for most applications is the stabilization of both the repetition and CEO frequencies. The stabilization of the repetition frequency has been demonstrated in 19865 by simply detecting the pulse
train with a fast photodetector at the output of the laser and applying a feedback to the cavity length, usually via a piezo-electric transducer (PZT). The detection of the CEO frequency was much more challenging as it is not directly measurable from the laser spectrum. Innovative techniques had to be invented to propose a detection scheme. The most commonly used method is based on a nonlinear interferometric detection6 which
beats the blue part of the spectrum with the frequency-doubled red part. The resulting beat note corresponds to the CEO frequency, which can be stabilized using a modulation of the intracavity dispersion or the nonlinearity, in most cases performed by modulation of the optical pump power. However, this technique requires an octave-spanning spectrum that is typically not directly available from the modelocked laser. In 2000,
the development of nonlinear fibers for the generation of a supercontinuum (SC) spectrum7 was the key milestone that enabled the
demonstration of stabilized frequency combs8,9.
Figure 1.1: Time (a) and frequency (b) domain representation of the frequency comb from a modelocked laser. Figure taken from Schilt and Südmeyer10.
The first frequency comb systems were based on Ti:sapphire lasers. Ti:sapphire lasers enable extremely short pulses and repetition frequencies that can go up to multi-GHz in a low noise setup, but need to be pumped in the green, which requires bulky and complex pumping schemes. Fiber-based frequency combs can operate at the very interesting telecom wavelength spectral range at 1.5 μm and are very reliable. They demonstrated extremely low noise operation11 and were even operated
outside the lab in a moving car12. Their typical operation regime is at
repetition frequencies in the range of several tens to a few hundreds of MHz. Even though a fs diode-pumped fiber laser-based frequency comb operated at 1 GHz13, it is difficult to reach higher repetition frequencies.
important breakthrough since there were initially concerns of feasibility of generating stabilized frequency combs due to the noise of the multi-mode pump source. Finally, the development of green laser diodes recently enabled the demonstration of the first diode-pumped Ti:sapphire CEO stabilization17.
The development of frequency combs follows a trend towards less complex laser setups, cheaper fabrication costs and a high flexibility in the generated repetition as well as optical frequency. It is in this framework that this thesis investigates frequency combs based on GHz modelocked semiconductor lasers. These lasers, called semiconductor disk lasers (SDLs) or vertical external-cavity surface-emitting lasers (VECSELs) gather the potential of very compact sources with cost-efficient wafer-scale mass production. However, the CEO frequency stabilization of an SDL could not be demonstrated in the beginning of this thesis, mainly due to the limited lasers peak power and too long pulse duration.
Lasers based on a semiconductor gain material have a long history as they were demonstrated only two years after the invention of the laser18.
Nowadays they are the most common lasers in the market. In addition to the numerous applications in the multimedia and telecommunication sectors, they are a key building block of the modelocked laser technology, implemented as most of their pump sources as continuous wave (CW) laser diodes. The two most common diode types are the electrically-pumped edge-emitter diodes and the vertical cavity surface-emitting lasers (VCSELs), restricted to CW operation. The call for an external cavity to facilitate the addition of cavity elements such as saturable absorber for passive modelocking operation or wavelength filters for wavelength tuning and the demand for higher output powers led to the development of the first CW-optically-pumped VECSEL in 199719. The modelocking
operation was obtained with the implementation of a semiconductor saturable absorber mirror (SESAM) in the external cavity and was first
demonstrated in 2000 with a modelocked VECSEL emitting pulses of 22-ps duration and 22 mW of output power20.
Since then, a lot of work has been done to improve VECSELs properties in terms of output power and pulse duration. Today, the record output power from a fs-VECSEL is 5.1 W demonstrated in 201221. More
recently, pulse duration down to 96 fs were demonstrated at 100-mW average output power and 560-W peak power22, as well as 6.3 kW of peak
power, which was obtained from a different system in 410-fs pulses23.
The short upper state lifetime of the semiconductor gain enables the demonstration of high repetition frequencies without the problem of Q-switching instabilities. Typically, VECSELs operate in the multi-GHz repetition rate, with a record of 50 GHz24 in fundamentally modelocked
operation. Even higher repetition rates of 175 GHz were obtained using harmonic modelocking25. Another advantage of the semiconductor gain is
the possibility to integrate both the gain and saturable absorber into the same chip, leading to the so-called modelocked integrated external-cavity surface-emitting laser (MIXSEL)26. This type of lasers constitutes the
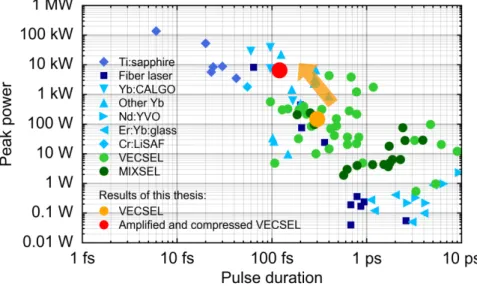
ultimate step towards compactness and enabled modelocked repetition frequencies up to 100 GHz27. Figure 1.2 presents an overview of the
published results of modelocked lasers with a repetition frequency in the GHz-regime. It shows that semiconductor lasers are well present in the picture and start competing with other technologies. Some results even have sufficient peak power for the demonstration of direct SC generation28. However, the octave-spanning SC generation has not yet
been demonstrated from a direct launch of the laser pulse train into a nonlinear fiber. Tentative with compressed pulse duration of 150 fs and 1015 W of peak power were also not sufficient for the generation of the octave-spanning SC29.
1320 nm to 2000 nm30. However this SC did not cover the requested octave
and was most likely incoherent. In 2014, Zaugg et al. demonstrated the coherent octave-spanning SC generation of a fiber-amplified VECSEL emitting in the 1-μm region31. A standard f-to-2f interferometer enabled
the first detection of the CEO frequency of a SDL. Unfortunately, the signal-to-noise ratio (SNR) of the beat note was not sufficient for a noise characterization or a stabilization.
Figure 1.2: Selected overview of the achieved peak power of different modelocked laser technologies with pulse repetition rates from and above 1 GHz20–22,24,26–28,31–96. The light green dots represent results based on optically
pumped VECSELs. The orange circle represents the ultrafast SDL used in this thesis for the demonstration of CEO stabilization and the red point is the generated peak power after amplification and compression.
In addition the different studies of the timing jitter and amplitude noise performed on VECSELs97–100 and MIXSELs101 demonstrated
comparable performances to DPSSLs15,102,103. These noise properties place
these laser sources in a very promising situation in the world of frequency combs.
This thesis follows the three main steps towards the demonstration of a SDL-based frequency comb that are
• The characterization of the noise of a SDL to determine the CEO frequency stabilization feasibility;
• The investigation of a proper amplifier and pulse compression stage for the generation of higher peak power and shorter pulse durations;
• The demonstration of the stabilization of the CEO frequency. Chapter 2 focuses of on the noise characterization of a 1.8-GHz SDL (orange point in Figure 1.2). The main noise sources in continuous-wave and modelocked lasers are presented. A noise characterization and stabilization of the repetition frequency are shown followed by the description of an indirect method for the measurement of the CEO frequency noise. Using this setup, the frequency noise of the CEO frequency is measured, showing the feasibility of a future stabilization by feedback to the pump current.
In chapter 3, a compact crystalline waveguide-based amplifier is investigated and demonstrates the efficient laser amplification from 60 mW to 2.9 W.
Chapter 4 presents the main result of this thesis that is the CEO frequency stabilization of an ultrafast SDL. To do so, efficient power amplification and spectral broadening are performed in an Yb-doped fiber amplifier developed in our institute. The compressed pulses (red point in Figure 1.2) enable the coherent octave-spanning supercontinuum generation in a photonic crystal fiber (PCF) followed by the CEO frequency detection in a standard f-to-2f interferometer. The CEO frequency stabilization and an investigation on the origin of the free-running noise are presented.
ranging from 391 nm104 to 5.3 μm105. However, the range is limited
between 665 nm106 and 2 μm107 in pulsed regime.
In chapter, 5 the development of an optical parametric oscillator pumped by an ultrafast SDL is presented. The parametric process enables the conversion of the SDL properties towards longer wavelengths. It is a first step in the development of SDL-based frequency combs emitting in the mid-infrared.
Finally, chapter 6 concludes the thesis and provides an outlook on the future improvements, developments and applications of the SDL technology.
Chapter 2
Noise analysis of an ultrafast SDL
The reduction of the noise of a laser is a key point for many applications in optical metrology or optical communications. In a pulsed laser, random fluctuations of the pulse power, of the timing between two consecutive pulses or of the phase of the carrier wave relative to the pulse envelope are noise sources that influence the frequency stability and linewidth of optical lines of the frequency comb. Therefore, the origin of the noise in the laser has first to be investigated and its level and spectral distribution need to be characterized. A careful design of the cavity to make it mechanically- and thermally-stable and the optimization of the pump source and its current driver in terms of noise levels are key parameters that will generally reduce the laser noise. The further reduction of the noise can then be implemented using an active stabilization loop applying a feedback signal to the laser.In this chapter, the noise characterization of a GHz modelocked SDL is presented. Section 2.1 summarizes the theoretical definitions and possible origins of different types of noise that are present in CW and
scheme that does not require the traditional f-to-2f interferometry presented in section 2.3, the noise of the CEO frequency of the ultrafast SDL is characterized using this method and presented in section 2.4.
2.1 Noise in lasers
Every laser system output suffers from some noise due to fluctuations of the global system. The origin of this noise can be separated in two main categories. The first one is called quantum noise and results from spontaneous emission in the gain medium. The second is the noise arising from technical origins. The main sources of technical noise are a noisy pump source, vibrations of mechanical components of the resonator or temperature fluctuations. As quantum noise is mainly dependent on the laser operation mode, it can be reduced by reducing the optical losses, increasing the intracavity power or implementing active stabilization setup. On the other hand, technical noise is mainly controlled by careful cavity design, shielding and damping from ambient noise sources and implementation of active stabilization setups.
The following section 2.1.1 describes the intensity and frequency noise that occur in CW lasers and their relation to the laser linewidth. In section 2.1.2, the three main types of noise encountered in modelocked lasers are presented, i.e.:
• the amplitude noise, • the timing phase noise, • and the CEO phase noise.
2.1.1 CW laser noise and linewidth
Intensity noise
Intensity noise represents the fluctuations of the laser output power around its average value. Note that this term may also refer to optical intensity, that is the optical power per unit area, but which will not be treated here. The time-dependent optical power of the laser can be expressed as
𝑃𝑃(𝑡𝑡) = 𝑃𝑃av+ 𝛿𝛿𝑃𝑃(𝑡𝑡), (2.1)
where 𝑃𝑃av is the average power and 𝛿𝛿𝑃𝑃(𝑡𝑡) a fluctuating quantity with zero
mean value. In most cases, it is more common to consider the relative intensity noise (RIN) of the laser, which is the noise of the optical power normalized to the average power 𝑃𝑃av:
𝐼𝐼(𝑡𝑡) =𝛿𝛿𝑃𝑃(𝑡𝑡)𝑃𝑃
av . (2.2)
The single sideband (SSB) power spectral density (PSD) of the RIN describes the distribution of the normalized power fluctuations as a function of the Fourier frequency f. Using the Wiener-Khinchin theorem, it is defined as
𝑆𝑆𝐼𝐼(𝑓𝑓) = � 𝐺𝐺𝐼𝐼(𝜏𝜏) ∙ 𝑒𝑒−𝑖𝑖2𝜋𝜋𝜋𝜋𝜋𝜋𝑑𝑑𝜏𝜏 +∞
−∞ , (2.3)
where 𝐺𝐺𝐼𝐼(𝜏𝜏) is the autocorrelation function of 𝐼𝐼(𝑡𝑡) defined as
𝐺𝐺𝐼𝐼(𝜏𝜏) = lim∆→∞∆ � 𝐼𝐼(𝑡𝑡 + 𝜏𝜏)𝐼𝐼(𝑡𝑡)𝑑𝑑𝑡𝑡1 ∆/2
−∆/2 . (2.4)
The RIN PSD can be integrated over a given frequency range to provide a single number root-mean-square (RMS) value of the RIN, that is
comes from the fact that the SSB-PSD of the relative power fluctuations 𝑆𝑆𝐼𝐼(𝑓𝑓) is considered here. Note that the specification of the integration
bandwidth is essential and is typically determined by the inverse of the measurement time 𝑇𝑇meas for the lower frequency limit (𝑓𝑓low =𝑇𝑇meas1 ) and
the bandwidth of the measurement setup for the higher frequency limit 𝑓𝑓high.
Frequency noise and linewidth
Any laser, even a single-frequency laser, is not perfectly monochromatic and its power spectrum (optical spectrum as a function of its wavelength 𝜆𝜆 or frequency 𝛿𝛿) has a finite full width at half maximum (FWHM) linewidth. The linewidth partially results from the quantum noise inherent to the lasing process that causes the intrinsic linewidth, which corresponds to the Schawlow-Townes limit108. Additional technical noise
gives rise to a broadening of the linewidth.
The linewidth of lasers is generally too narrow to be resolved by standard optical spectrum analyzers. Other measurement techniques have thus been developed. An example used in this thesis is to perform a heterodyne beat with another independent laser which has a significantly lower frequency noise than the laser under study and is used as reference oscillator. The characterization of the beat note signal can be assumed to be a good estimate of the frequency noise properties of the laser under test.
The linewidth constitutes a single number that characterizes the spectral properties of a laser. It is useful for a simple comparison with other lasers, but generally a deeper characterization of the spectral behavior of the laser is necessary. This is obtained with the measurement of the frequency noise PSD 𝑆𝑆𝛿𝛿𝛿𝛿(𝑓𝑓), where 𝛿𝛿𝛿𝛿 is the fluctuation around the
central emission frequency 𝛿𝛿 and 𝑆𝑆𝛿𝛿𝛿𝛿(𝑓𝑓) is defined from the
𝑆𝑆𝛿𝛿𝛿𝛿(𝑓𝑓) = � 𝐺𝐺𝛿𝛿𝛿𝛿(𝜏𝜏) ∙ 𝑒𝑒−𝑖𝑖2𝜋𝜋𝜋𝜋𝜋𝜋𝑑𝑑𝜏𝜏 +∞
−∞ . (2.6)
𝜷𝜷-separation line
The optical lineshape and resulting linewidth of a laser can be directly computed from the frequency noise PSD 𝑆𝑆𝛿𝛿𝛿𝛿(𝑓𝑓) (see Elliott et al.109).
However it is not always straightforward and may take a long computational time. A simple approximation method has been developed by Di Domenico et al.110 to straightforwardly estimate the linewidth of a
laser from its frequency noise PSD.
The basic idea is to introduce the so-called β-separation line in the frequency noise PSD
𝛽𝛽(𝑓𝑓) = 8𝑙𝑙𝑛𝑛2𝜋𝜋2 ∙ 𝑓𝑓. (2.7) This line separates the frequency noise spectrum into two regions: frequencies which have a noise above the line contribute to the linewidth while those with a noise below the line do not affect the linewidth but only contribute to the wings of the line shape function. The linewidth can be simply approximated by the surface 𝐴𝐴 below the frequency noise PSD for the frequency components for which the noise is above the β-separation line (see Figure 2.1). The FWHM linewidth is then computed as
Figure 2.1: Figure taken from Di Domenico et al.110. A typical laser frequency noise PSD made of 1/f noise at low Fourier frequencies and white frequency noise at high Fourier frequencies. The red dashed line is the β-separation line which separates the spectrum into the two regions: the violet area contributes to the linewidth, the white one contributes only to the wings of the line shape function.
2.1.2 Noise of modelocked lasers
The following section summarizes the theoretical description of the different types of noise occurring in a modelocked laser. It is mainly based on the work developed in Von der Linde111 and adapted with the
notations from Wittwer112.
Ideal pulse train
A modelocked laser emits a train of pulses, where two subsequent pulses are separated by the time period 𝑇𝑇 =𝜋𝜋1
rep. For most lasers, this time period
is much larger than the pulse duration, and therefore the pulse shape can be approximated by a Dirac delta function 𝛿𝛿(𝑡𝑡). The time-dependent optical power of an ideal noise-free modelocked laser is then described by a sum of equally-spaced delta functions, called a Dirac comb
𝑃𝑃(𝑡𝑡) = 𝑃𝑃av ∙ 𝑇𝑇 ∙ � 𝛿𝛿(𝑡𝑡 − 𝑛𝑛 ∙ 𝑇𝑇) +∞
𝑛𝑛=−∞
. (2.9)
The corresponding PSD in the frequency domain is also a Dirac comb of equidistant lines given by
𝑆𝑆𝑃𝑃,ideal(𝑓𝑓) = (𝑃𝑃av)2∙ � 𝛿𝛿�𝑓𝑓 − 𝑛𝑛 ∙ 𝑓𝑓rep� +∞
𝑛𝑛=−∞
. (2.10)
Amplitude noise
As for the CW lasers described in the previous section, modelocked lasers suffer from amplitude fluctuations which can be expressed as
𝑃𝑃(𝑡𝑡) = �1 + 𝐼𝐼(𝑡𝑡)� ∙ 𝑃𝑃av ∙ 𝑇𝑇 ∙ � 𝛿𝛿(𝑡𝑡 − 𝑛𝑛 ∙ 𝑇𝑇), +∞
𝑛𝑛=−∞
(2.11)
where 𝐼𝐼(𝑡𝑡) represents the normalized power fluctuations as introduced in equation (2.2). Going to the frequency domain with the help of the Wiener-Khinchin theorem, the PSD becomes
𝑆𝑆𝑃𝑃,amp(𝑓𝑓) = (𝑃𝑃av)2∙ � �𝛿𝛿�𝑓𝑓 − 𝑛𝑛 ∙ 𝑓𝑓rep� + 𝑆𝑆𝐼𝐼�𝑓𝑓 − 𝑛𝑛 ∙ 𝑓𝑓rep�� +∞ 𝑛𝑛=−∞ = 𝑆𝑆𝑃𝑃,ideal(𝑓𝑓)+(𝑃𝑃av)2∙ � 𝑆𝑆𝐼𝐼�𝑓𝑓 − 𝑛𝑛 ∙ 𝑓𝑓rep� +∞ 𝑛𝑛=−∞ , (2.12)
where 𝑆𝑆𝐼𝐼 is the power spectral density of the relative power fluctuations.
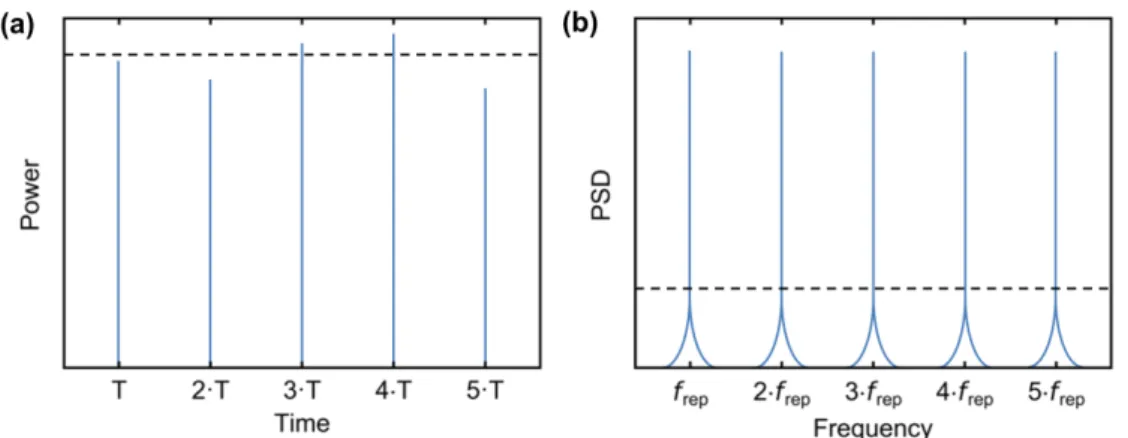
This equation demonstrates that amplitude fluctuations in the time domain correspond to the emergence of sidebands in the frequency domain as depicted in Figure 2.2. The amplitude of these sidebands is identical for all harmonics.
Figure 2.2: Power representation in the time domain (a) and frequency domain (b) of a modelocked laser pulse train that is affected by amplitude noise.
When characterizing the amplitude noise of a modelocked laser, one is typically interested in the noise contained in the sidebands of one harmonic m
𝑆𝑆𝑚𝑚,amp(𝑓𝑓) = 𝑆𝑆𝐼𝐼�𝑓𝑓 − 𝑚𝑚 ∙ 𝑓𝑓rep�. (2.13)
This corresponds to the PSD of 𝐼𝐼(𝑡𝑡) and can be integrated over a given frequency range to provide the integrated RMS amplitude noise
𝜎𝜎amp��𝜋𝜋
low,𝜋𝜋high� = �2 ∙ � 𝑆𝑆𝑚𝑚,amp(𝑓𝑓)𝑑𝑑𝑓𝑓
𝜋𝜋high
𝜋𝜋low
. (2.14)
Timing phase noise
In addition to amplitude noise, the repetition frequency 𝑓𝑓rep, i.e., the
inverse of the time interval 𝑇𝑇 between pulses, also fluctuates. This is described in the time domain by the following expression
𝑃𝑃(𝑡𝑡) = 𝑃𝑃𝑎𝑎𝑎𝑎 ∙ 𝑇𝑇 ∙ � 𝛿𝛿�𝑡𝑡 − 𝑛𝑛 ∙ 𝑇𝑇 − 𝛿𝛿𝑇𝑇𝑛𝑛(𝑡𝑡)� +∞
𝑛𝑛=−∞
, (2.15)
where 𝛿𝛿𝑇𝑇𝑛𝑛(𝑡𝑡) is the temporal variation of the nth pulse from its ideal
corresponding to small phase shift 𝜑𝜑𝑛𝑛(𝑡𝑡) = 𝑛𝑛 ∙ 2𝜋𝜋𝑓𝑓rep∙ 𝛿𝛿𝑇𝑇𝑛𝑛(𝑡𝑡) ≪ 1 rad , the
PSD of the Dirac comb takes the form
𝑆𝑆𝑃𝑃,time(𝑓𝑓) = (𝑃𝑃av)2∙ ∑+∞𝑛𝑛=−∞�𝛿𝛿�𝑓𝑓 − 𝑛𝑛 ∙ 𝑓𝑓rep� + �𝑛𝑛 ∙ 2𝜋𝜋𝑓𝑓rep�2∙ 𝑆𝑆𝛿𝛿𝑇𝑇�𝑓𝑓 − 𝑛𝑛 ∙ 𝑓𝑓rep��
= 𝑆𝑆𝑃𝑃,ideal(𝑓𝑓) + (𝑃𝑃av)2∙ � �𝑛𝑛 ∙ 2𝜋𝜋𝑓𝑓rep�2∙ 𝑆𝑆𝛿𝛿𝑇𝑇�𝑓𝑓 − 𝑛𝑛 ∙ 𝑓𝑓rep� +∞
𝑛𝑛=−∞
, (2.16) with 𝑆𝑆𝛿𝛿𝑇𝑇 corresponding to the PSD of the temporal variation (in 𝑠𝑠2/𝐹𝐹𝐻𝐻). As
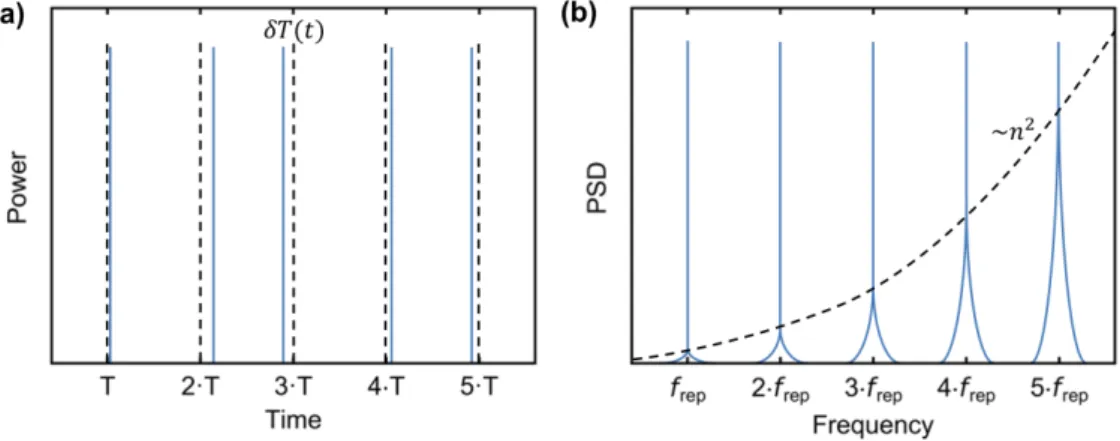
schematized in Figure 2.3, these timing fluctuations also add sidebands in the frequency spectrum, however their power scales with the square of the harmonic number 𝑛𝑛.
Figure 2.3: Timing phase noise of a pulse train in the time domain (a) and frequency domain (b). The time shift from pulse to pulse corresponds to additional wings in the frequency spectrum whose power scales with the square of the harmonic number 𝑛𝑛.
Here again, one typically characterize the noise around one harmonic m 𝑆𝑆𝑚𝑚,time(𝑓𝑓) = �𝑚𝑚 ∙ 2𝜋𝜋𝑓𝑓rep�
2
∙ 𝑆𝑆𝛿𝛿𝑇𝑇�𝑓𝑓 − 𝑚𝑚 ∙ 𝑓𝑓rep�. (2.17)
A single number can be used to describe the contribution of the timing phase noise in a given frequency range
𝜎𝜎jitter��𝜋𝜋 low,𝜋𝜋high� = �2 ∙ ∫𝜋𝜋high𝑆𝑆𝑚𝑚,time(𝑓𝑓)𝑑𝑑𝑓𝑓 𝜋𝜋low 2𝜋𝜋𝑚𝑚𝑓𝑓rep = �2 ∙ � 𝑆𝑆𝛿𝛿𝑇𝑇(𝑓𝑓)𝑑𝑑𝑓𝑓 𝜋𝜋high 𝜋𝜋low . (2.18)
It is called the RMS timing jitter or integrated timing jitter.
CEO phase noise
Every pulse of the optical pulse train can be described with an intensity envelope, as studied earlier, and an underlying oscillating electric field (the carrier wave). The dispersion and nonlinearities of the resonator cause a phase slippage of the peak of the electric field from the peak of the intensity envelope from pulse to pulse (see Figure 2.4). It is defined as the carrier-envelope phase slip. In the frequency domain, it corresponds to a frequency offset of the comb spectrum from the zero frequency. This frequency offset is defined as the CEO frequency 𝑓𝑓CEO, and every line of
the comb spectrum can be written as
𝛿𝛿𝑁𝑁= 𝑁𝑁 ∙ 𝑓𝑓rep+ 𝑓𝑓CEO, (2.19)
where N represents the mode number. The fluctuation of the CEO frequency induces a fluctuation of the entire comb spectrum. Therefore a noise characterization together with a stabilization of the CEO frequency are relevant.
Figure 2.4: (a) time and (b) frequency domain representation of a frequency comb. Figure taken from Schilt and Südmeyer10.
Unlike 𝑓𝑓rep, which can be easily measured with a high bandwidth
photodiode and a microwave spectrum analyzer, the CEO frequency is not directly accessible as it does not appear in the optical spectrum of the laser. Therefore new techniques have been developed for its detection. The mostly used is the f-to-2f interferometry6, described and implemented in
chapter 4. This technique necessitates in particular the generation of a coherent supercontinuum spectrum that covers a frequency octave (i.e. ranging from frequency f to frequency 2f). This property is not directly obtained from the laser (apart a few special configurations of Ti:sapphire modelocked lasers113,114) and can be pretty challenging to achieve
especially for lasers with a high repetition rate in the GHz-regime. To circumvent this constraint, the following sections 2.3 and 2.4 present an alternative technique to detect and characterize the noise of the CEO frequency without the use of an f-to-2f interferometer.
bandwidth needed to achieve a tight lock in a CEO stabilization loop. When the frequency noise is entirely reduced below the β-separation line, the linewidth of the CEO is suppressed, which results in a tight-lock that is characterized by the occurrence of a coherent peak in the RF spectrum of the CEO beat, targeted for most applications of optical frequency combs.
2.2 Repetition rate frequency noise
characterization and stabilization of an ultrafast
SDL
The laser prototype characterized in this chapter and further used in chapters 3 is a 1.8-GHz SESAM-modelocked VECSEL developed at ETH Zurich. A second prototype based on the same design with similar VECSEL gain chip and SESAM was assembled in our laboratory. The second prototype is used in the results presented in chapter 4. Both lasers were carefully characterized and demonstrate comparable operation and noise behavior. In this section, the detailed characterization of the first prototype is presented.
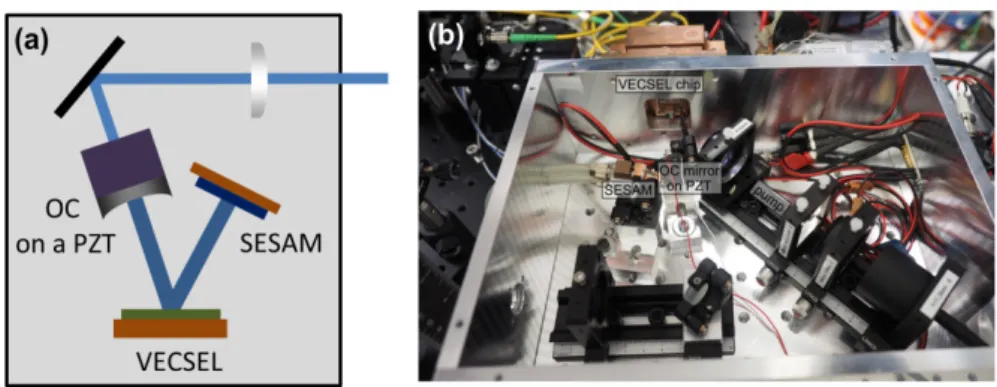
The laser has a simple V-shaped cavity with the VECSEL gain chip as folding mirror and the SESAM and output coupler (OC) as end mirrors, as presented in Figure 2.5(a).
Figure 2.5 (a): Scheme of the SESAM-modelocked VECSEL cavity. (b) Picture of the boxed prototype in its aluminum housing.
The laser properties are summarized in Table 2.1. Pulses with a duration of 300 fs are generated from the prototype at a central emission wavelength of 1030 nm and with an average output power of 90 mW. The laser is boxed in an aluminum housing [Figure 2.5(b)] to minimize the influence of technical noise such as acoustic noise and thermal effects.
VECSEL prototype
Pump power 17 W Pulse duration 300 fs Output power 90 mW Central emission wavelength 1030 nm Repetition frequency 1.77 GHz Spectral bandwidth 4 nm
Table 2.1 Parameters of the ultrafast VECSEL.
The stabilization of the repetition frequency frep is performed using a
PZT placed underneath the OC to change the cavity length and therefore adjust frep. The main steps of the stabilization are the detection and
amplification of the frep signal, followed by its phase stabilization to a
reference signal by controlling the cavity length with the PZT using a phase-locked loop (PLL) circuit.
PSD and typically sets the limiting noise level for the stabilization at low Fourier frequencies. The gain of the locking electronics is usually limited by the PZT and is optimized by a careful adjustment while monitoring the
frep FN-PSD. Finally, a careful study of the PZT bandwidth (and therefore
of the speed with which the control loop can react) is performed by a measurement of its transfer function. This measurement helps understanding the potential limitations and the reaction of the system before performing the stabilization.
2.2.1 Repetition rate transfer function
Two parameters are important in a PLL: • the linear tuning range
• the amplitude and phase responses (and therefore the bandwidth of the loop)
To investigate the linear range, we performed a static measurement of the tuning response of frep (measured with an RF spectrum analyzer) to a
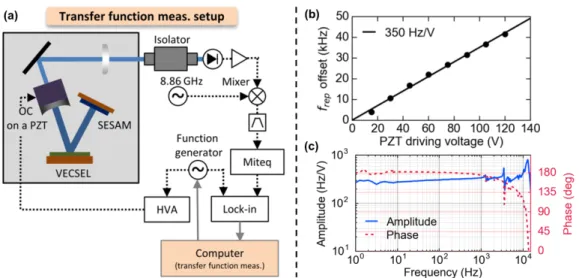
change of the driving voltage of the PZT. This measurement is presented in Figure 2.6(b). Here we implemented a high voltage amplifier (HVA, Menlo HVA150, gain ~15) to drive the PZT in a range of 0-150 V. We performed this measurement in our ultrafast VECSEL using the 5th-harmonic of frep (8.84 GHz), which will later be used for the
stabilization, and divided the result by 5 to get the behavior of frep. We see
that the PZT provides a response that spans over more than 40 kHz with a linear tuning coefficient of ~350 Hz/V. This is widely sufficient for frep
Figure 2.6: (a) Transfer function measurement scheme. (b) Static tuning of frep
as a function of the PZT voltage. (c) Amplitude (left axis, blue) and phase (right axis, red) transfer function of frep for PZT modulation.
The amplitude and phase responses are assessed in a dynamic measurement, called transfer function. This measurement gives the amplitude attenuation /amplification and the phase delay as a function of the PZT voltage modulation frequency. The PLL bandwidth is determined by the frequency at which the phase of the transfer function shifts by 90°, which typically corresponds to 3 dB (50%) attenuation in amplitude for a 1st order low-pass filter. We use this approximation to estimate the PLL
bandwidth, even if the transfer function does not fit a 1st order low-pass
filter. Figure 2.6(a) presents the measurement setup of the transfer function. The basic principle is to apply a sinusoidal signal from a function generator to the HVA in order to modulate the PZT and use a lock-in amplifier to detect the amplitude and phase response of frep.A frequency
discriminator (Miteq FMDM 21.4/4-2) is used before the lock-in amplifier to convert the frequency fluctuations into voltage fluctuations analyzed by the lock-in. Here again we performed the measurements on the 5th-harmonic of frep. As the frequency discriminator has an operating range
We also see two resonances of the PZT at ~1.3 kHz and 3.5 kHz which may add some peaks in the FN-PSD of the stabilized signal.
2.2.2 Repetition rate frequency stabilization
The stabilization of the repetition frequency is performed on its 5th
harmonic (5∙frep = 8.84 GHz) to enhance the phase noise sensitivity
compared to the fundamental frequency (see section 2.1.2). The signal was first detected using a high-bandwidth photodiode (New Focus 1014), then amplified and phase-compared in a mixer with a reference synthesizer (Rohde-Schwarz SMF-100A), see Figure 2.7(a). The resulting phase error signal was low-pass filtered and sent to the proportional integral (PI) servo-controller (Menlo PIC210) to generate the correction signal driving the HVA to modulate the OC mounted on the PZT.
Figure 2.7: (a) Repetition frequency stabilization scheme. (b) FN-PSD of the free-running (blue) and phase-locked (violet) repetition frequency and of the reference synthesizer (grey). Right axis: Integrated timing jitter as a function of the low cut-off frequency (dashed line).
We recorded the noise of the 1st-harmonic of the repetition frequency
using the signal from a second photodetector (New Focus 1434) and a phase noise analyzer (Rohde-Schwarz FSWP26). The free-running (blue) and stabilized (violet) FN-PSDs of the repetition frequency are presented
in Figure 2.7(b). In addition, the frequency noise of the synthesizer used as a reference signal in the PLL was measured at 8.84 GHz and is plotted in Figure 2.7(b) after down scaling by a factor of 52 for comparison with the
noise of the 1st harmonic. We see that the noise of the stabilized frep is
reduced to the level of the reference synthesizer for Fourier frequencies up to 200 Hz. We also see the servo bump at ~10 kHz, which gives the stabilization bandwidth and is consistent with the results of section 2.2.1. The free-running integrated timing jitter of 1.7 ps is reduced to 30 fs integrated from 100 Hz to 1 MHz, which is remarkably low for a GHz laser.
2.3 Theoretical principle for the
characterization of the CEO frequency noise
without
f-to-2f interferometry
This section summarizes the basic principle of the indirect characterization of the CEO frequency noise as described in the work of Brochard et al.115.
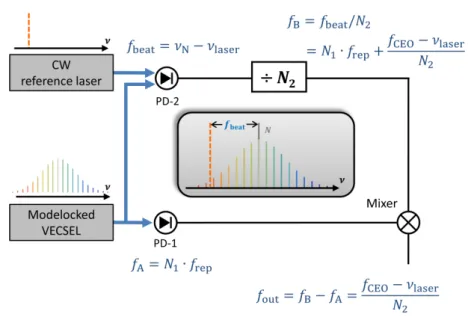
The method is based on an appropriate combination of different signals from the modelocked laser and a narrow linewidth CW laser. A scheme of the detection method is presented in Figure 2.8. On one side a high harmonic
𝑓𝑓A= 𝑁𝑁1∙ 𝑓𝑓rep (2.20)
of the repetition rate is measured using a fast photodetector (lower branch of Figure 2.8 on PD-1). On the other side, the heterodyne beat between the modelocked laser and the CW laser is measured on a second fast photodetector PD-2. This beat note corresponds to an RF signal
equals the index N of the modelocked laser comb line
𝑁𝑁 = 𝑁𝑁1∙ 𝑁𝑁2. (2.22)
The resulting signal is
𝑓𝑓B = 𝑓𝑓beat𝑁𝑁
2 = 𝑁𝑁1∙ 𝑓𝑓rep+
𝑓𝑓𝐶𝐶𝐶𝐶𝐶𝐶− 𝛿𝛿laser
𝑁𝑁2 , (2.23)
Finally the two signals fA and fB are mixed to produce a signal fout that is
exempt from the contribution of frep
𝑓𝑓out = 𝑓𝑓B− 𝑓𝑓A = 𝑓𝑓CEO− 𝛿𝛿𝑁𝑁 laser
2 , (2.24)
Now assuming that the frequency noise of the CW laser 𝛿𝛿𝛿𝛿laser is
sufficiently lower than the frequency noise 𝛿𝛿𝑓𝑓CEO of the CEO beat under
investigation, its contribution can be neglected. Then
𝛿𝛿𝑓𝑓out ≅ 𝛿𝛿𝑓𝑓𝑁𝑁CEO
2 , (2.25)
and the FN-PSD of the output signal depicts the PSD of CEO frequency divided by 𝑁𝑁22. Note that this technique enables accessing the CEO
frequency noise, but does not give a direct access to the absolute 𝑓𝑓CEO
measurement as the absolute CW-laser frequency (𝛿𝛿laser) is not known
Figure 2.8: Basic principle of the proposed scheme to characterize the CEO beat without directly detecting it. A high harmonic 𝑁𝑁1of the repetition rate
(lower branch, signal fA) is mixed with the heterodyne beat with a CW laser,
frequency-divided by 𝑁𝑁2 (higher branch, signal fB), to produce a signal fout
that is exempt from the contribution of frep if 𝑁𝑁 = 𝑁𝑁1∙ 𝑁𝑁2. PD: fast
photodiode.
In addition to the difference frequency component (𝑓𝑓B− 𝑓𝑓A)
measured at the output of the mixer, there is also the sum frequency component (𝑓𝑓B+ 𝑓𝑓A) which includes twice the noise of the repetition
frequency. Therefore the signal has to be selected carefully to guaranty that the correct beat note is used for the characterization of the CEO frequency.
This method has been validated with a commercial Er:fiber frequency comb115. The measured CEO frequency noise showed an
excellent agreement with the results obtained with a traditional f-to-2f interferometer.
2.4 First investigation of the noise and
modulation properties of the carrier-envelope
offset in a modelocked semiconductor laser
P. Brochard,1 N. Jornod,1 S. Schilt,1 V. J. Wittwer,1 S. Hakobyan,1
D. Waldburger,2 S. M. Link,2 C. G. E. Alfieri,2 M. Golling,2 L. Devenoges,3
J. Morel,3 U. Keller,2 and T. Südmeyer1
1Laboratoire Temps-Fréquence, Institut de Physique, Université de
Neuchâtel, CH-2000 Neuchâtel, Switzerland.
2Department of Physics, Institute of Quantum Electronics, ETH Zurich,
CH-8093 Zürich, Switzerland.
3Federal Institute of Metrology METAS, CH-3003 Bern-Wabern,
Switzerland.
We present the first characterization of the noise properties and modulation response of the carrier-envelope offset (CEO) frequency in a semiconductor modelocked laser. The CEO beat of an optically-pumped vertical external-cavity surface-emitting laser (VECSEL) at 1030 nm was characterized without standard f-to-2f interferometry. Instead, we used
an appropriate combination of signals obtained from the modelocked oscillator and an auxiliary continuous-wave laser to extract information about the CEO signal. The estimated linewidth of the free-running CEO beat is approximately 1.5 MHz at 1-s observation time, and the feedback bandwidth to enable a tight CEO phase lock to be achieved in a future stabilization loop is in the order of 300 kHz. We also characterized the amplitude and phase of the pump current to CEO-frequency transfer function, which showed a 3-dB bandwidth of ∼300 kHz for the CEO frequency modulation. This fulfills the estimated required bandwidth and indicates that the first self-referenced phase-stabilization of a modelocked semiconductor laser should be feasible in the near future.
Optical frequency combs from modelocked solid-state lasers have been a revolution in the field of high precision metrology by directly and coherently linking the optical and microwave parts of the electromagnetic spectrum [1–3]. Such stabilized frequency combs enable the measurement of optical frequencies with an extreme precision [4,5] and constitute a key element of novel optical atomic clocks that have surpassed the best microwave frequency standards in terms of fractional frequency stability [6,7].
Most comb applications today require self-referencing, i.e., the detection and stabilization of the carrier envelope offset (CEO) frequency
fCEO [1,8]. This has been achieved in various fiber laser systems [9] and
solid-state lasers (Ti:Sapphire [2] or diode-pumped solid-state lasers – DPSSLs [10,11]). Electronic feedback modulating the pump power of the femtosecond laser is the most common approach to phase-stabilize fCEO to
an external reference frequency [3]. Alternative methods have been demonstrated, which make use of an intracavity loss modulator enabling the modulation bandwidth to be extended beyond the gain lifetime limitation, such as a graphene electro-optic modulator [12] or an opto-optical modulation of a semiconductor saturable absorber mirror (SESAM) [13]. Other solutions are based on feedforward corrections applied to the CEO frequency [14] or passive CEO cancellation using a difference frequency generation (DFG) process [15].
Self-referencing modelocked lasers with a higher repetition rate in the GHz range is much more challenging, as the CEO noise typically scales with the repetition rate [16], therefore requiring larger feedback bandwidths. In addition, the standard self-referencing method most often involves f-to-2f interferometry to detect the CEO frequency [1]. This requires a coherent supercontinuum (SC) spectrum that covers at least one frequency octave, which is fairly challenging to achieve for some novel
expense of a higher complexity.
Among the emerging comb technologies, modelocked semiconductor lasers are promising for future low-cost high-volume production owing to the benefits of semiconductor manufacturing. Vertical external-cavity surface-emitting lasers (VECSELs) or modelocked integrated external-cavity surface-emitting lasers (MIXSELs) [17] can lead to compact and cost-effective frequency comb systems in the future. However, no such modelocked laser has ever been CEO-frequency-stabilized yet. The main reason is the insufficient peak power and too long pulse duration that have prevented so far the generation of a suitable SC spectrum for CEO detection.
A CEO beat signal from a semiconductor modelocked laser has been detected for the first time by Zaugg et al. after external pulse amplification and compression [18], but no further investigation has been reported since then. The 1038-nm VECSEL was first amplified to 5.5 W average power using a fiber amplifier, then the pulses were compressed to 85 fs to generate the necessary octave-spanning SC spectrum in a photonic crystal fiber (PCF). However, the detected CEO signal was not suitable for noise analysis or stabilization as the signal-to-noise ratio (SNR) of ~15 dB (in a 100-kHz resolution bandwidth) was insufficient. Extra noise may have been induced in the amplification.
In this Letter, we present the first detailed characterization of the CEO frequency in a modelocked VECSEL, showing promising results for future self-referencing stabilization. For this purpose, we implemented a characterization method of the CEO beat that does not require f-to-2f interferometry and therefore circumvents the need for a coherent octave-spanning comb spectrum that has not yet been achieved directly from the output of this laser. The information about the CEO noise and modulation response was obtained directly from the output of the oscillator, without any further spectral broadening, pulse compression or amplification. We
recently showed a proof-of-principle demonstration of this method implemented with an Er:fiber frequency comb for which the CEO beat was separately detected using an f-to-2f interferometer for cross validation [19]. The method proved to be suitable to infer both the frequency noise spectrum of the free-running CEO beat and the transfer function of fCEO for
a modulation of the laser pump current. Here we report on the implementation of this method for the characterization of the CEO frequency of a modelocked VECSEL.
The investigated ultrafast laser oscillator was a prototype developed at ETH Zurich. The laser cavity had a semiconductor gain chip as folding mirror, and a SESAM and an output coupler (1% transmission) as end mirrors. It generated sub-300-fs pulses at around 1030 nm [20]. The VECSEL was pumped with up to 17 W of optical power from a commercially-available fiber-coupled 808-nm multimode pump diode. The average output power was 90 mW with a spectral width of ~4 nm. The pump diode was driven in-parallel by a low-cost constant current source and a home-built voltage-current transducer providing a fast modulation channel for the pump power. A dedicated low-pass filter was implemented between the two current sources to avoid undesirable cross-talks. A 3-dB modulation bandwidth of the pump power of around 1 MHz was therewith achievable with this home-made transducer. Fast modulation capabilities of the pump power are important for future comb self-referencing with direct control of the CEO frequency via pump current modulation. The VECSEL repetition rate frep ≈ 1.77 GHz was
phase-stabilized to a radio-frequency (RF) signal referenced to an H-maser for stable long-term operation at the required level of accuracy. This stabilization was implemented by a phase-locked loop operating at 5·frep
(~8.85 GHz), with a feedback signal applied to a piezoelectric transducer (PZT) controlling the position of the output coupler within the VECSEL
without directly detecting it was recently presented in Ref. [19]. It requires an auxiliary continuous wave (cw) laser. Whereas a planar waveguide external-cavity laser with a very low frequency noise was used in our proof-of-principle experiment at 1.55 μm, this type of laser is not available at the 1030-nm emission wavelength of our VECSEL. Therefore, a distributed feedback (DFB) laser (Eagleyard) with a specified linewidth <2 MHz was used in the work reported here. Its frequency noise power spectral density (PSD) has first been measured to assess its suitability for this application. This was realized by heterodyning the laser with the SC spectrum generated in a highly nonlinear fiber from a fully-stabilized Er:fiber frequency comb (Menlo FC 1500-250). The SC spectrum was spectrally filtered using a fibered tunable bandpass filter with a bandwidth of ∼1 nm and amplified in a semiconductor optical amplifier (Innolume) before being combined with the auxiliary cw laser in a 90/10 fiber coupler. The resulting beat signal was bandpass filtered and its frequency noise was measured using a frequency discriminator [21] and a fast Fourier transform spectrum analyzer. The noise of the auxiliary DFB laser was the dominating contribution in this measurement, leading to the frequency noise spectrum displayed in Figure 2.10.
Figure 2.9: (a) Basic principle of the proposed scheme to characterize the CEO beat without directly detecting it [19]. A high harmonic N1 of the repetition
rate (upper branch, signal fA) is mixed with the heterodyne beat with a cw
laser, frequency-divided by N2 (lower branch, signal fB), to produce a signal
fout that is exempt from the contribution of frep. PD: fast photodiode; DBM:
double-balanced mixer. (b) Detailed experimental scheme realized for the implementation of the method with a modelocked VECSEL with
frep ≈ 1.77 GHz using an auxiliary DFB laser at 1030 nm. PNA: phase noise
analyzer. All radio-frequency components except the narrow band-pass filters at ~15 GHz are standard off-the-shelf components. The frequency discriminator and lock-in amplifier are used for the transfer function.
The experimental setup for the characterization of fCEO was
implemented in a similar way as in our previous proof-of-principle demonstration. However, different RF components (filters, frequency dividers, amplifiers) were used to account for the different repetition rate and mode number N involved here. Basically, two RF signals were detected, corresponding to a harmonic N1 = 9 of the repetition rate (at
15.92 GHz) and to the beat signal fbeat between one mode of the VECSEL
(with a nominal mode number N = N1·N2) and the auxiliary laser, which
was detected at a frequency of 14.96 GHz. In order to remove the contribution of the VECSEL repetition rate, these signals were processed and combined according to the general principle reported in Ref. [19] and to the detailed scheme displayed in Figure 2.9. Finally, only a frequency-divided contribution of the CEO frequency fluctuations δfCEO (division by

![Figure 2.9: (a) Basic principle of the proposed scheme to characterize the CEO beat without directly detecting it [19]](https://thumb-eu.123doks.com/thumbv2/123doknet/14828062.618448/57.892.158.744.160.319/figure-basic-principle-proposed-scheme-characterize-directly-detecting.webp)
