HAL Id: hal-00317070
https://hal.archives-ouvertes.fr/hal-00317070
Submitted on 1 Jan 2003
HAL is a multi-disciplinary open access
archive for the deposit and dissemination of
sci-entific research documents, whether they are
pub-lished or not. The documents may come from
teaching and research institutions in France or
abroad, or from public or private research centers.
L’archive ouverte pluridisciplinaire HAL, est
destinée au dépôt et à la diffusion de documents
scientifiques de niveau recherche, publiés ou non,
émanant des établissements d’enseignement et de
recherche français ou étrangers, des laboratoires
publics ou privés.
energetic particles from the South Pole to the North
Pole of the Sun during solar maximum
R. B. Mckibben, J. J. Connell, C. Lopate, M. Zhang, J. D. Anglin, A. Balogh,
S. Dalla, T. R. Sanderson, R. G. Marsden, M. Y. Hofer, et al.
To cite this version:
R. B. Mckibben, J. J. Connell, C. Lopate, M. Zhang, J. D. Anglin, et al.. Ulysses COSPIN observations
of cosmic rays and solar energetic particles from the South Pole to the North Pole of the Sun during
solar maximum. Annales Geophysicae, European Geosciences Union, 2003, 21 (6), pp.1217-1228.
�hal-00317070�
Annales
Geophysicae
Ulysses COSPIN observations of cosmic rays and solar energetic
particles from the South Pole to the North Pole of the Sun during
solar maximum
R. B. McKibben1, J. J. Connell1, C. Lopate1, M. Zhang2, J. D. Anglin3, A. Balogh4, S. Dalla4, T. R. Sanderson5, R. G. Marsden5, M. Y. Hofer5, H. Kunow6, A. Posner6, and B. Heber7
1Space Science Center, Institute for the Study of Earth, Oceans, and Space, University of New Hampshire, Durham, NH,
03824, USA
2Florida Institute of Technology, Melbourne, FL, USA
3National Research Council of Canada, Ottawa, Canada
4Blackett Laboratory, Imperial College of Science and Technology, London, UK
5Research and Scientific Support Department of ESA, ESTEC, 2201 AZ Noordwijk, The Netherlands
6Kiel University, Kiel, Germany
7University of Osnabr¨uck, Osnabr¨uck, Germany
Received: 23 August 2002 – Revised: 9 February 2003 – Accepted: 21 March 2003
Abstract. In 2000–2001 Ulysses passed from the south to the north polar regions of the Sun in the inner heliosphere, providing a snapshot of the latitudinal structure of cosmic ray modulation and solar energetic particle populations during a period near solar maximum. Observations from the COSPIN suite of energetic charged particle telescopes show that lati-tude variations in the cosmic ray intensity in the inner helio-sphere are nearly non-existent near solar maximum, whereas small but clear latitude gradients were observed during the similar phase of Ulysses’ orbit near the 1994–95 solar min-imum. At proton energies above ∼10 MeV and extending up to >70 MeV, the intensities are often dominated by Solar Energetic Particles (SEPs) accelerated near the Sun in asso-ciation with intense solar flares and large Coronal Mass Ejec-tions (CMEs). At lower energies the particle intensities are almost constantly enhanced above background, most likely as a result of a mix of SEPs and particles accelerated by in-terplanetary shocks. Simultaneous high-latitude Ulysses and near-Earth observations show that most events that produce large flux increases near Earth also produce flux increases at Ulysses, even at the highest latitudes attained. Particle anisotropies during particle onsets at Ulysses are typically directed outwards from the Sun, suggesting either accelera-tion extending to high latitudes or efficient cross-field prop-agation somewhere inside the orbit of Ulysses. Both cosmic ray and SEP observations are consistent with highly efficient transport of energetic charged particles between the equa-torial and polar regions and across the mean interplanetary magnetic fields in the inner heliosphere.
Key words. Interplanetary physics (cosmic rays) – Solar
Correspondence to: R. B. McKibben
physics, astrophysics and astronomy (energetic particles; flares and mass ejections)
1 Introduction
Since its launch in 1990, Ulysses has been exploring the latitudinal structure of the inner heliosphere. As shown in Fig. 1b, Ulysses reaches a maximum solar latitude of about
80◦in both the Northern and Southern Hemispheres, and has
an orbital period around the Sun of approximately 5.5 years. Since the solar activity cycle has a period of about 11 years (or 22 years for the complete solar magnetic cycle), on each successive orbit Ulysses samples conditions at any point about half a solar activity cycle apart. During its first so-lar minimum orbit about the Sun (1992–1997), observations were made during the evolution from solar maximum to so-lar minimum conditions and the highest latitude measure-ments (1994–95) were taken near solar minimum (see Fig. 1a and b). During its second 1998-2004 solar maximum orbit, conditions were evolving from solar minimum to solar max-imum and the highest latitude measurements (2000–2001) were made very near solar maximum.
As a result of the eccentricity of Ulysses’ orbit, it takes about two and a half years to reach maximum latitude at
80.2◦S from its low-latitude aphelion near Jupiter’s orbit,
during which significant changes in the solar activity level can take place. As a result, separation of temporal and spa-tial variations can be difficult. On the other hand, to return from high latitudes to perihelion, at about 1.3 AU near the ecliptic, requires only about 6 months. Therefore, the pe-riod from maximum latitude in the Southern Hemisphere, through perihelion, and on to maximum latitude in the
North--90 -60 -30 0 30 60 90 HG Latitude (°) 102 100 98 96 94 6 4 2 Radius (AU) Radius Latitude 70°N 70°S (b) 10-6 10-5 10-4 10-3 10-2 10-1 Flux (s cm 2 sr MeV/n) -1 102 101 100 99 98 97 96 95 94 Year - 1900 IMP-8 CRC Ulysses COSPIN/HET (d) Helium ~35-70 MeV/n 10-5 10-4 10-3 10-2 10-1 100 102 101 100 99 98 97 96 95 94 (c) Protons ~35-70 MeV -90 -60 -30 0 30 60 90 HG Latitude (°) 102 100 98 96 94 200 150 100 50 0 Monthly SSN Current Sheet Latitude Range
Monthly Sunspot No.
(a)
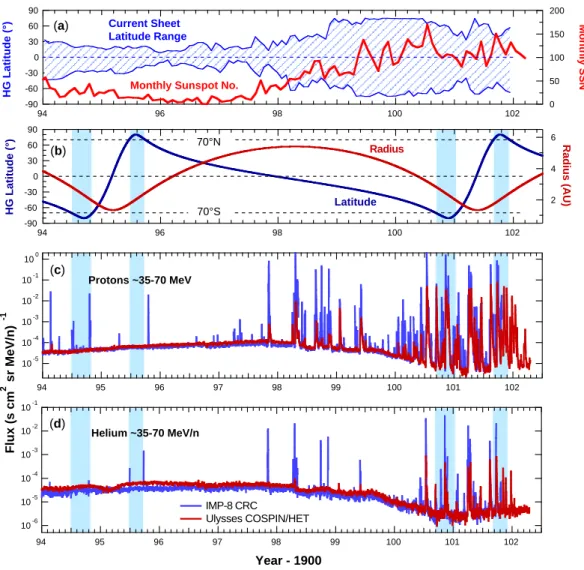
Fig. 1. (a) Proxies for the level of solar activity: Blue shading, left axis, maximum latitudinal extent of the current sheet dividing opposite
magnetic polarities in the corona (Wilcox Solar Observatory). Red curve, right axis, monthly sunspot number (SIDC, RWC Belgium, World Data Center for the Sunspot Index, Royal Observatory of Belgium and Solar Geophysical Data reports). (b) Ulysses trajectory. Heliocentric
Radius (red curve, right axis); Heliographic latitude (blue curve, left axis. Polar passes are defined by Ulysses latitude >70◦. (c) Fluxes of
energetic protons observed by Ulysses (red curve) and IMP-8 near Earth (blue curve). Energy ranges are ∼39–70 MeV for Ulysses, and ∼30– 70 MeV for IMP, represented, for brevity in discussion, as ∼35–70 MeV. In all figures in this paper near-Earth observations are represented by blue curves and Ulysses observations are represented by red curves. No IMP-8 observations are available after suspension of IMP-8 operations on day 299 of 2001. (d) Fluxes of energetic Helium nuclei at Ulysses and IMP-8. Actual energy ranges are ∼39–70 MeV/n for Ulysses, and ∼30–70 MeV/n for IMP, represented, for brevity in discussion, as ∼35–70 MeV/n. Near solar minimum (1995–96) the anomalous component dominates the helium fluxes. Near solar maximum (2000–01) the quiet-time Helium flux consists mainly of galactic cosmic rays.
ern Hemisphere, commonly referred to as the Fast Latitude Scan (FLS), is uniquely valuable for providing a “snapshot” of the latitudinal structure in a time much shorter than the time scale for evolution of the level of solar activity in the solar cycle.
The COSPIN suite of instruments on Ulysses, described by Simpson et al. (1992), aims to characterize the spectra, abundances, and temporal and spatial variations of the en-ergetic charged particle populations of the inner heliosphere over an energy range from ∼0.5 MeV up to relativistic ener-gies. The particle populations of interest include:
(a) Solar Energetic Particles (SEPs), which may extend to
energies >100 MeV and are associated with discrete events on the sun such as energetic Coronal Mass Ejec-tions and solar flares
(b) Particles accelerated by other shocks and disturbances in the solar wind, such as solar wind stream interface shocks;
(c) Anomalous component cosmic rays, originally inter-stellar neutral atoms ionized by solar UV and carried out as pick-up ions in the solar wind to be accelerated to cosmic ray energies at the solar wind termination shock;
(d) Galactic cosmic rays entering the heliosphere from the interstellar medium, and also,
(e) Electrons accelerated in Jupiter’s magnetosphere, which dominate the electrons fluxes in the inner heliosphere at energies less than ∼30 MeV (Eraker and Simpson, 1979; Eraker, 1982).
The intensities of all of these components are affected by variations in the characteristics of the solar wind and inter-planetary magnetic field on both short and long time scales, giving rise both to the long-term global solar cycle modula-tion of the galactic and anomalous cosmic rays, and to short-term variations in intensity related to localized modulation and acceleration of particles by shocks in the solar wind. Study of the latitude variations of the intensities and spec-tra of these various components provides information about the global structure of the heliospheric magnetic field as well as about the physical processes affecting propagation of the particles through the heliosphere.
During the passage over the Sun’s poles during Ulysses’ solar minimum orbit, conditions for cosmic rays were rela-tively quiet in the heliosphere, with relarela-tively few short-term enhancements produced by solar or interplanetary events. In-tensities of both galactic cosmic rays (Fig. 1c) and anoma-lous component helium (Fig. 1d) were near their maximum levels corresponding to minimum solar modulation. One of the most striking results from this period was that intensi-ties at Earth and at Ulysses, even when Ulysses was at the highest latitudes, differed little, if at all. The largest lati-tude effect seen, for low energy anomalous helium (panel d) amounted to less than a factor of two increase from equator to pole, barely visible on the scale of Fig. 1, and no effect at all was detectable for the low energy galactic cosmic rays (panel c). Together with other evidence, such as observations near the poles of periodic variations in the intensity of high energy cosmic rays (McKibben et al., 1995; Kunow et al., 1995; Simpson et al., 1995) and of low energy interplane-tary accelerated particles produced by near-equatorial solar wind stream corotating interaction regions (CIRs) (Sander-son et al., 1995; Roelof et al., 1996), the observations led to the conclusion that transport of energetic charged particles across the mean interplanetary magnetic field between the equatorial and polar regions was much more efficient than existing models had contemplated (e.g. Fisk, 1996; K´ota and Jokipii, 1998; McKibben, 1998; Potgeiter, 1998).
During its second fast latitude scan, Ulysses explored the latitudinal structure under very different conditions for ener-getic charged particles. The Sun was near the maximum in its activity cycle, and the intensity profiles shown in Fig. 1 were dominated by the transient increases produced by energetic solar flares and CME events. At the same time, the back-ground intensity of cosmic rays and anomalous components had decreased by factors ranging from a few percent at GeV energies to as much as a factor of 10 or more at low energies, as a result of the increased solar modulation characteristic of solar maximum (see also Heber et al., 2003).
Thus, the Ulysses orbit was ideally suited to investigate the variation in the latitudinal structure of the heliosphere be-tween solar minimum and solar maximum. In this paper we treat primarily two aspects of the variation, the determina-tion of latitude gradients for cosmic ray intensities, and the observation of solar energetic particles in the polar regions of the inner heliosphere. Studies of Jovian electron propaga-tion have been presented elsewhere (Heber et al., 2002) and studies of local acceleration of low energy particles at high latitudes have not yet progressed beyond a basic exploratory phase. Heber et al. (2003) discuss specifically and in more detail the observations from the COSPIN KET during the re-cent fast latitude scan.
In addition to observations from the COSPIN instrument suite, we use observations from the CRNC experiment on IMP-8 and the EPAM experiment on ACE to provide for a comparison of fluxes at Ulysses to those near Earth. The IMP-8 instrument has been described by Garcia-Mu˜noz et al. (1977), and the ACE instrumentation has been described by Gold et al. (1998).
2 Latitudinal structure of solar modulation of cosmic rays
Our current understanding of modulation is based on the pi-oneering work of Parker (1965), who first wrote down the equation that is still believed to provide a complete descrip-tion of the physical processes important for moduladescrip-tion. In early years, attention focused on diffusion of the cosmic rays into the heliosphere primarily along the irregular interplan-etary magnetic field lines. At the same time, the field lines, being frozen into the solar wind, convected the cosmic rays outward and, as a result of the divergence of the solar wind flow, also cooled them by adiabatic deceleration, so that the intensity of cosmic rays in the inner solar system was de-termined by the balance between inward diffusion, outward convection, and adiabatic cooling. In this picture, the main reason to expect a latitude effect in the solar modulation is that the equatorial field lines are wound into a tight spiral by the continuing rotation of the Sun as the solar wind picks up and carries field lines out from the upper corona into the he-liosphere. On the other hand, over the poles the spiral would be expected to be much less tightly wound, approaching a purely radial field over the rotational pole, and thus might provide a much shorter path for cosmic rays to reach the inner heliosphere from the heliospheric boundary. In this simple picture, assuming the propagation along the field is much less difficult than propagation across field lines, large increases of flux would be expected over the poles.
Since 1977 (Jokipii et al., 1977), Jokipii and his co-workers have explored a previously neglected effect in the Parker equation, wherein the gradients and curvatures of the heliospheric magnetic field lines can give rise to systematic drift velocities for energetic charged particles. For some particles, these drift velocities may be comparable to, or even larger than, the solar wind velocity. Near solar
mini-1.6 1.2 0.8 0.4 -80 -60 -40 -20 0 20 40 60 80 Helium ~35-70 MeV/n (e) 1.6 1.2 0.8 0.4 -80 -60 -40 -20 0 20 40 60 80 Helium ~35-70 MeV/n (a) Latitude Scan Slow Fast Typical Statistical Error (>10°N only)
1.6 1.2 0.8 0.4 -80 -60 -40 -20 0 20 40 60 80 Helium ~70-90 MeV/n (b) 1.6 1.2 0.8 0.4 -80 -60 -40 -20 0 20 40 60 80 Helium ~70-90 MeV/n (f) 1.6 1.2 0.8 0.4 -80 -60 -40 -20 0 20 40 60 80 Protons ~70-90 MeV (g) 1.6 1.2 0.8 0.4 -80 -60 -40 -20 0 20 40 60 80 Protons ~70-90 MeV (c) 1.6 1.2 0.8 0.4 -80 -60 -40 -20 0 20 40 60 80 Integral Intensity Protons >~100 MeV (d) 1.6 1.2 0.8 0.4 -80 -60 -40 -20 0 20 40 60 80 Integral Intensity Protons >~100 MeV (h)
Ulysses/IMP Ratio
Heliographic Latitude (°)
Near-Solar Maximum 2001-2002 Near-Solar Minimum 1994-1995Fig. 2. (a)–(d) Ratios of fluxes or intensities measured at Ulysses to those measured ate IMP-8 for a variety of particle species as a function
of heliographic latitude near solar minimum in 1994–95. Light line: slow latitude scan from aphelion near Jupiter’s orbit. Heavy line:
Fast Latitude Scan passing from 80.2◦S through perihelion near the equator and on to 80.2◦N within about one year. Typical statistical
uncertainties on the flux ratio are shown in red. For clarity, the uncertainties are shown only for latitudes northward of 10◦N. Uncertainties
at other latitudes would be similar. During this period, the uncertainties were less than or at most barely greater than the width of the line.
(e)–(h) The same for the Fast Latitude Scan near solar maximum in 2001–2002. The larger uncertainties reflect the lower statistics resulting
from the much lower fluxes observed near solar maximum.
mum these effects can be especially important because the magnetic structure of the heliosphere is particularly simple, with hemispheres of opposite polarity separated by a near-equatorial current sheet as the field is carried out by the solar wind. Such a structure produces global systematic flows of the cosmic rays through the heliosphere as a result of drifts, which may even dominate the diffusion-convection effects previously considered. Since the magnetic polarity of the so-lar dipole reverses from one cycle to the next, the cosmic ray flow pattern is also expected to reverse. The general pat-tern for the polarity during Ulysses’ solar minimum orbit was that cosmic rays should have preferentially entered the helio-sphere over the poles, drifted down in latitude towards the equator, and then along the current sheet. When this effect was added to the expected effects of diffusion-convection, the models’ current prior to Ulysses’ high-latitude measure-ments predicted very large increases in cosmic ray intensity at high latitude (e.g. Potgieter and Haasbroek, 1993; Haas-broek et al., 1995).
As shown in Fig. 2a–d the actual observations by Ulysses did not confirm these expectations. While there was a modest increase in intensity towards the poles, the increase was less than about a factor of 2, corresponding to a latitudinal gradi-ent of only ∼1%/degree or less, even for the most strongly affected particle types (e.g. the anomalous helium shown in Fig. 2a). It was also a surprise to find that the surface of symmetry of the modulation did not coincide with the helio-graphic equator, but instead was shifted southward by about 10◦(Simpson et al., 1996; Heber et al., 1996). At first con-sidered controversial, this was later shown to correspond to a true asymmetry in the solar magnetic field at the time of Ulysses’ first Fast Latitude Scan.
A generally accepted interpretation for the increase in modulation over expected levels at the poles rests on obser-vations of large long-period Alfv´en waves observed in the field over the poles (Balogh et al., 1995), possibly generated by convective motions in the upper solar atmosphere (Hor-bury et al., 1996). As these waves are convected outward by
the solar wind, their transverse magnetic field components, which fall off as 1/R, quickly become dominant over the ra-dial components, which fall off as 1/R2. As a result the polar field lines become as convoluted and difficult to traverse as the tightly wound equatorial lines (Jokipii and K´ota, 1989). However, this cannot be a complete explanation since it pro-vides no reason why the modulated intensities at the pole and the equator should be so closely the same. The small-ness of the gradients would be easily accounted for, how-ever, if there were direct communication between equatorial and polar regions through enhanced propagation of particles across the mean magnetic fields. Fortunately, there is other direct evidence for such propagation. As Ulysses rose in latitude through the zone dominated by solar wind stream interactions in the relatively tranquil solar minimum helio-sphere, 26-day recurrent modulations of the cosmic ray in-tensity were observed corresponding to encounters with the interaction regions. (This effect is visible most clearly in the integral intensity trace for the slow latitude scan in Fig. 2d; see Simpson et al., 1995 for a fuller discussion.) At the same time, periodic enhancements of low energy particles accelerated by the shocks bounding the CIRs were also ob-served. A major surprise from the first orbit observations is that these variations persisted to the highest latitudes reached by Ulysses, even though the interaction regions were con-fined to latitudes less than about 35◦(Phillips et al., 1995). These observations are difficult to understand unless propa-gation between equatorial and polar regions is much easier than previous models had anticipated.
Two competing models for producing the latitudinal prop-agation have been advanced (see Fisk and Jokipii, 1999). In one (K´ota and Jokipii, 1995; Burger and Hattingh, 1998; Pot-gieter et al., 1997), the cross-field diffusion coefficient is sim-ply taken to be larger than expected based on simple quasi-linear theory, perhaps as a result of the modest random walk in latitude imposed on the fields by convective motions at the Sun (Jokipii and Parker, 1969). The observations require that the ratio of perpendicular to parallel diffusion coefficients be as large as, perhaps, 0.3 (Potgieter, 1998). Such a large ratio has not yet been demonstrated from propagation theory, but it has not been excluded either. Since this model makes no specific reference to global magnetic structure in the helio-sphere, the latitudinal propagation may be equally effective at solar minimum and at solar maximum.
In the other model, proposed by Fisk (1996), there is direct magnetic connection between low- and high-latitude regions. The connection arises through a complex interaction of the differential rotation of the photosphere, through which the field lines must be threaded, with the observed rigid rotation of the corona driven by the rotation of an tilted inner solar dipole fixed in the body of the Sun. The prediction is that over a distance of about 15 AU, an individual field line may make a latitudinal excursion of as much as 60–90 degrees in the simple solar minimum heliosphere, where most of the solar wind emanates from the polar coronal holes. While the Fisk mechanism may still be operating at solar maximum to enhance the latitudinal motion of field lines, its effects have
not yet been clearly worked out for the disordered magnetic structure of the solar maximum heliosphere.
The effect of Fisk’s model on particle propagation has also not yet been worked out in detail, even for solar minimum conditions. If particles were constrained simply to follow field lines, the effective source for particles observed at high latitudes would be at large radial distances, in some cases beyond the region of maximum strength of the interaction regions. For solar particle events, in particular, significant delays would be expected as a result of the requirement that particles first propagate to ∼15 AU and then propagate back in to the position of Ulysses. If, however, some cross-field diffusion is allowed, particles may occasionally transfer from one field line to a neighboring line. If the random walk of field lines is also present, so that neighbor field lines are not necessarily parallel, the effect of the Fisk model field may be simply to magnify the effects of the random walk in the lat-itudinal direction by imposing a systematic latlat-itudinal com-ponent (absent in the classic Parker field) on the meander-ing interplanetary field lines. Thus, without independent and quantitative knowledge of the rate of cross-field diffusion or the rate of field meandering expected in the classical Parker field, discrimination between the competing models simply on the basis of particle observations may be very difficult.
For the solar maximum orbit, conditions in the heliosphere are expected to be completely different from those at solar minimum. The heliospheric magnetic structure may be de-scribed by a highly inclined current sheet (see current sheet latitudinal extent in Fig. 1a) that is continually disrupted and distorted by extensive and energetic coronal mass ejections at all latitudes, and by fluctuating sources for the solar wind as active regions and coronal holes form and decay, leading to highly time-variable stream structures in the solar wind. In this very different heliosphere the questions inspired by the first orbit observations were:
1. Will the gradients be larger or smaller during solar max-imum?
2. Will there still be evidence for efficient propagation of particles between equatorial and polar regions? 3. Will there be evidence again for global magnetic
asym-metries reflected in asymasym-metries in modulation? The observations during the solar maximum orbit are shown in Fig. 2g–h. For these observations, periods when so-lar energetic particles dominate the intensity either at Ulysses or near Earth have been removed, leading to sometimes large
gaps in the measurements of cosmic ray intensity. The
greater variability in the ratios observed is most likely due in part to the difficulty of removing all contamination from solar energetic particles, and in part to the more dynamic na-ture of the interplanetary medium, such that the cosmic ray intensity at one spacecraft may be affected by a transient dis-turbance which never reaches the other. Nevertheless, it is apparent that at solar maximum the latitudinal gradients in intensity are smaller than we are able to measure (see also Heber et al., 2003).
2 4 6 1 2 C/S 380 360 340 320 300 280 260
Day of 2000
Integral Proton Rates (E>~100 MeV) 0.7*IMP-8 HET (g) 10-3 10-2 10-1 100 101 Intensity Electrons IMP-8 (2-12 MeV) KET (3-10 MeV) Arbitrary IMP-Ulysses Normalization (b) 10-6 10-4 10-2 100 Flux Protons ~30-70 MeV
Ulysses HET IMP-8 (1 AU)
(1) (2) (3) (4) (5) (6) (7) (8) (9) (10) (11) (12) (f) 800 600 400 200 VSW (km/s)
Solar Wind Speed 2.77 -71.5 85.6 2.64 -74.7 82.0 2.50 -77.7 84.3 2.36 -79.9 95.7 2.22 -79.7 115.6 2.08 -76.5 130.5 1.94 -71.0 135.1 R (AU) Lat. (°) ∆φ fp(°) ACE SWEPAM Ulysses SWOOPS (a) 104 102 100 10-2 C/S HFT Protons 0.3-6.7 MeV IMP-8 Protons 0.5-1.8 MeV (c) 0.26 0.23 310 300 290 280 10-4 10-2 100 Flux Ulysses LET 8-19 MeV Imp-8 Protons 11-20 MeV (e) 102 100 10-2 Flux AT1 Protons 2.2 - 3.6 MeV ACE EPAM P8 Ions 1.9-4.75 MeV (d)
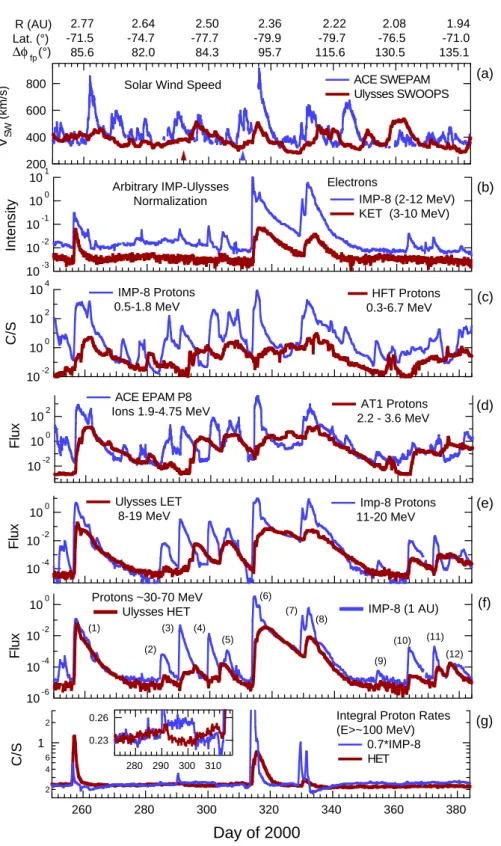
Fig. 3. (a) Solar wind speeds measured at IMP-8 and Ulysses during Ulysses passage over the Sun’s south polar regions in 2000–01 plotted
vs. days from start of year 2000. To convert to day of year 2001 for days beyond 366 on the bottom (time) axis, subtract 366. Red and blue triangles in the bottom axis indicate times of the Forbush-like decreases observed in the IMP and Ulysses integral intensities shown in the inset in panel (g). Ulysses’ radius, latitude, and longitudinal separation of the footpoint of Ulysses 400 km/s Parker field line on the Sun from that of the field line through Earth are indicated above the top axis. (b)–(g) Intensities or fluxes of cosmic rays and solar energetic particles measured by channels covering nearly the complete range of energies measured by the COSPIN suite of instruments (red curves), together with simultaneous measurements at similar energies from IMP-8 or ACE near Earth (blue curves). For intensity or counts/second measurements, normalization between Earth and Ulysses channels is arbitrary. No normalization has been applied to flux measurements. The inset in Panel (g) is a blowup of integral intensities from day 272–317 with enhanced vertical scale to show the sequential Forbush-like decreases discussed in the text, first at Ulysses, then 10 days later at IMP.
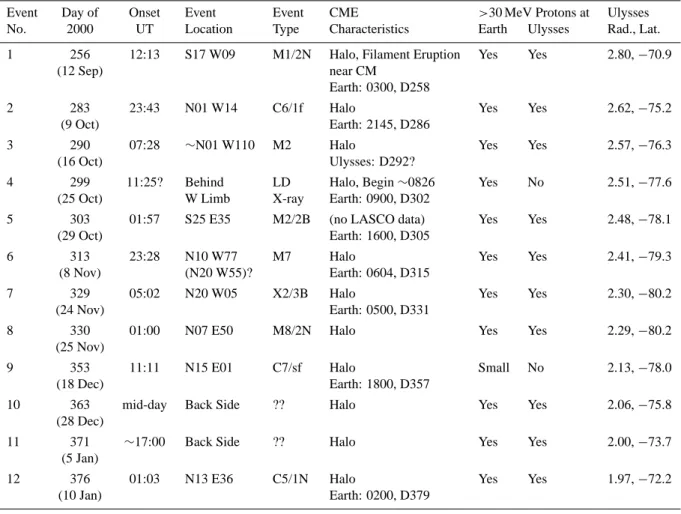
Table 1. Solar events giving rise to SEP events observed at Earth
Event Day of Onset Event Event CME >30 MeV Protons at Ulysses
No. 2000 UT Location Type Characteristics Earth Ulysses Rad., Lat.
1 256 12:13 S17 W09 M1/2N Halo, Filament Eruption Yes Yes 2.80, −70.9
(12 Sep) near CM
Earth: 0300, D258
2 283 23:43 N01 W14 C6/1f Halo Yes Yes 2.62, −75.2
(9 Oct) Earth: 2145, D286
3 290 07:28 ∼N01 W110 M2 Halo Yes Yes 2.57, −76.3
(16 Oct) Ulysses: D292?
4 299 11:25? Behind LD Halo, Begin ∼0826 Yes No 2.51, −77.6
(25 Oct) W Limb X-ray Earth: 0900, D302
5 303 01:57 S25 E35 M2/2B (no LASCO data) Yes Yes 2.48, −78.1
(29 Oct) Earth: 1600, D305
6 313 23:28 N10 W77 M7 Halo Yes Yes 2.41, −79.3
(8 Nov) (N20 W55)? Earth: 0604, D315
7 329 05:02 N20 W05 X2/3B Halo Yes Yes 2.30, −80.2
(24 Nov) Earth: 0500, D331
8 330 01:00 N07 E50 M8/2N Halo Yes Yes 2.29, −80.2
(25 Nov)
9 353 11:11 N15 E01 C7/sf Halo Small No 2.13, −78.0
(18 Dec) Earth: 1800, D357
10 363 mid-day Back Side ?? Halo Yes Yes 2.06, −75.8
(28 Dec)
11 371 ∼17:00 Back Side ?? Halo Yes Yes 2.00, −73.7
(5 Jan)
12 376 01:03 N13 E36 C5/1N Halo Yes Yes 1.97, −72.2
(10 Jan) Earth: 0200, D379
Unfortunately, because of the very disturbed nature of the solar maximum heliosphere, the regular 26-day periodic vari-ations in modulation observed at solar minimum, varivari-ations that could be traced from equator to pole, are not present. Similarly, with no clearly measurable gradients, it is not pos-sible to determine from these observations whether the asym-metry found at solar minimum persists in some way through solar maximum. Thus, the principal conclusion that can be drawn concerning modulation from Ulysses’ solar maximum fast latitude scan is that the solar modulation appears to be essentially spherically symmetric at solar maximum in the inner heliosphere.
However, this statement requires some qualification. While the overall average level of modulation appears to be the same at high and low latitudes, there are short-term time variations that reflect very local conditions. Examples are seen in the inset in panel (g) of Fig. 3, where significant For-bush decrease-like events are seen 10 days apart (at about days 292 and 302) at IMP and Ulysses, and around day 333 in the main part of panel (g), where a Forbush decrease at IMP has no counterpart at Ulysses. Nevertheless, before and after these events, the intensities at the two spacecraft re-turn to near equality. This suggests that the overall level of
modulation is set by global conditions of the magnetic fields throughout the heliosphere, whereas the short-term varia-tions reflect local condivaria-tions in the inner heliosphere.
3 Solar energetic particle observations at high latitudes During solar maximum, the dominant feature of the time intensity profiles of energetic proton fluxes is the frequent and large increases due to injection of solar energetic par-ticles by energetic events at the Sun. Figure 3 presents an overview of particle variations observed at Earth and simul-taneously at Ulysses during the South Polar Pass for protons from ∼0.3 MeV to energies >∼100 MeV, as well as for elec-trons with energies of several MeV. For context, the solar wind velocities measured at Earth and Ulysses are also pre-sented in the top panel.
While the amount of information in Fig. 3 is somewhat overwhelming, certain general patterns are apparent. Start-ing from the highest energies (panel g), of the four events that produce increases of more than a factor of two in the flux or
>100 MeV protons at Earth (numbered in panel (f) and Table 1 as events 1, 6, 7, and 8; see Table 1 for information about
600 500 400 300 VSW (km/s) 350 340 330 320 310 6 Hr Avgs Ulysses SWOOPS (a) 0.01 0.1 1 10 100 Anisotropy Amplitude 350 340 330 320 310 0.01 0.1 1 10 100 Omni Flux (cm 2 s sr MeV) -1 6 4 2 0 L3 Sector Protons 1.8-3.8 MeV Ulysses COSPIN LET
(c) 0.01 0.1 1 10 100 Anisotropy Amplitude 350 340 330 320 310 10-3 10-2 10-1 100 101 102 103 F2 Omni Rate (s -1 ) 30 25 20 15 10 5 0 F2 Sector Protons 0.3-6.7 MeV Ulysses COSPIN HFT (b) 1.5 1.4 1.3 1.2 1.1 1.0 0.9 0.8 0.7 0.6 0.5
(Sector Rate)/(Omni Rate)
0.01 0.1 1 10 100 Anisotropy Amplitude 350 340 330 320 310 6 4 2 0 H45s Sector 10-6 10-5 10-4 10-3 10-2 10-1 Omni Flux (cm 2 s sr MeV) -1 Protons ~39-70 MeV Ulysses COSPIN HET
(d) 1.20 1.15 1.10 1.05 1.00 0.95 0.90 0.85 0.80
(Sector Rate)/(Omni Rate)
10-6 10-5 10-4 10-3 10-2 10-1 100 101 Flux (cm 2 s sr MeV) -1 350 340 330 320 310 Day of 2000 Protons 30-69 MeV IMP-8 (e)
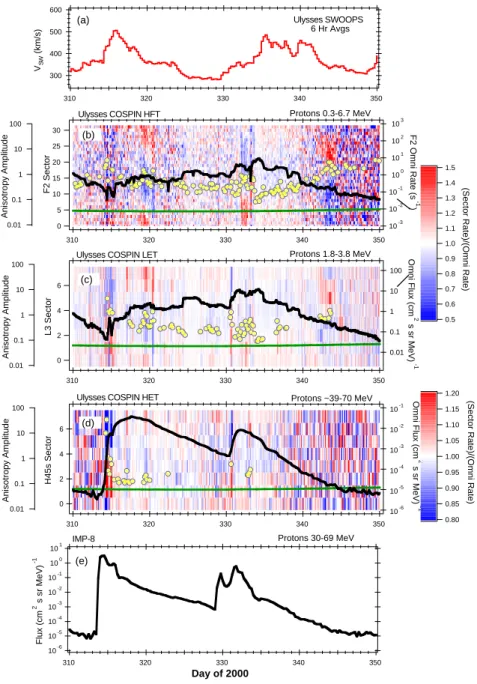
Fig. 4. (a) Solar wind speed observed at Ulysses (b)–(d) Three-hour average intensities or fluxes (black lines, right axes) and ratios of
intensities in each spin sector (near-left axes) to omnidirectional average intensities (red and blue shading, corresponding to keys to the right of the panels. Red represents higher intensity relative to the omnidirectional average) for the COSPIN HFT (0.3–6.7 MeV protons, panel b), LET (1.8–3.8 MeV protons, panel c) and HET (39–90 MeV protons, panel d) spin-sectored counting rates. The HFT divides each spacecraft spin into 32 sectors, while the LET and HET both have only 8 sectors. The green line indicates the computed direction of maximum (red) expected for particles propagating outward along an ideal 400 km/s Parker spiral field line. The yellow dots (leftmost axis) represent the anisotropy amplitudes, defined as ((max flux)/(min flux) −1), for periods when an isotropic flux distribution could be rejected at 95% confidence by a chi-square test. (e) Simultaneously measured flux of 30–69 MeV protons measured at IMP-8.
the initiating events on the Sun), three also produce signifi-cant increases at Ulysses in the south polar regions. In two cases, the flux increases at Ulysses were much smaller than at IMP at all energies, but in one case (day 256, the increase was larger at Ulysses at the highest energies (panel g) but not at lower energies. For the three that produce flux increases at Ulysses, in all three cases flux increases that appear to be as-sociated with these events are observed at Ulysses to energies
as low as 2.2 MeV (panel d), and possibly as low as 0.3 MeV (panel c). The profiles of these events at low (∼MeV) en-ergies are very gradual and ragged, however, in contrast to rather abrupt and well-defined increases observed at the same energies near Earth (panels c and d). The three events also produce well-defined increases in electron intensity at both Earth and Ulysses, with rapid onsets and slow decays at both spacecraft.
Figure 4 shows observations from several Ulysses chan-nels in more detail for the period 310–350, 2000. The IMP-8 30–69 MeV proton flux is also included as the bottom panel to provide the context of simultaneous observations near Earth. This period includes two of the three events (events 6 and 8) that produced large flux increases at Ulysses. Also included in Fig. 4 are observations of the particle anisotropies measured at three proton energies at Ulysses. During the two onsets of the two events, there are at least brief periods, lasting several hours, of outwardly directed anisotropies ob-served at Ulysses for energies above ∼2 MeV. As shown in the figure, for brief periods the anisotropy’s amplitudes (see definition in figure caption) can be quite large, as much as 10/1 (max/min) or greater for 39–70 MeV protons (panel d) and as much as ∼5/1 for ∼2 MeV protons (panel b). This suggests that, at least for protons with energies >2 MeV, the particles are injected either by direct acceleration or by diffu-sion from lower latitude acceleration onto high latitude field lines inside the position of Ulysses at 2.2–2.4 AU. Similar conclusions have been reached by Zhang et al. (2003) from a detailed analysis of the 14 July 2000 (“Bastille Day”) event, which occurred just prior to the beginning of Ulysses South Polar Pass.
At 0.3 MeV, there appears to be a very weak, poorly or-ganized outward flow during the onset period of the day 314 event, and there is a delayed outward anisotropy following the day 330 event. However, there is not a good correla-tion between anisotropies and intensity variacorrela-tions at this very low energy, and the flows may very well be more associated with the large solar wind speed increases observed during the same periods. At these very low energies anisotropies arising from the Compton-Getting effect must also be con-sidered. However, the stongest anisotropies do not appear to be well correlated with solar wind speed variations, as would be expected for Compton-Getting anisotropies.
As seen from both Figs. 3 and 4, it is a general characteris-tic of the solar energecharacteris-tic parcharacteris-ticle events that at high latitudes, the events are discrete and easily identified with events ob-served near Earth for energies above a few MeV. However, while the intensities remain high, the events become diffuse, melded together, and strongly affected by local conditions for lower energies. The relatively clean profiles observed for electrons with energies of 2 or 3 MeV energy (panel b) suggest that velocity may be more important than energy or rigidity in determining the appearance of the time-intensity profiles.
At energies above about 10 MeV, almost all large events seen near Earth also produce significant increases at Ulysses. Typically, the rise to maximum is slower at Ulysses, and the maximum intensity is lower. Presumably both differences are a result of some combination of Ulysses’ larger radial dis-tance from the Sun and of the difficulty of propagation from low-latitude to high-latitude field lines. However, whether or not an event is seen at both Ulysses and IMP does not seem to be a strong function of the positions of the space-craft with respect to the initiating event (most often marked by a solar flare) on the Sun. In Fig. 5, we show for the full
period from the south polar pass, through the fast latitude scan, and on through the north polar pass the intensities of
∼35–70 and 70–95 MeV protons measured at Ulysses and
IMP (Panels (a) and (b)). The bottom panels (c) and (d) show the latitude and longitude (with respect to the central meridian as observed from Earth) of the initiating events on the Sun, together with the positions of the footpoints on the Sun of the ideal Parker spiral field lines through Ulysses and IMP. Throughout the whole period of the polar passes and the fast latitude scan, essentially all large events observed at IMP also produce comparable intensity increases at Ulysses, and the locations of the footpoints of the field lines through the spacecraft do not seem to have much effect on this con-clusion. In fact, without independent knowledge of the tra-jectory of Ulysses, it would be very difficult to pick out the high-latitude portions of the trajectory from the near-ecliptic phase of the Fast Latitude Scan based simply on the particle time-intensity observations. These observations require ei-ther that the acceleration front for energetic particles in large events extends over a near global range of latitude and lon-gitude, or that mechanisms exist to transport particles accel-erated at a CME front throughout the inner heliosphere, both along and across the mean magnetic fields.
Consistent with the existence of mechanisms for efficient cross-field transport is the common observation at late times (3–4 days after onset) of establishment of nearly equal fluxes at IMP and Ulysses, which then decay at the same rate for the remainder of the event. Since the events may last as long as a full solar rotation, this observation requires the absence of spatial gradients in both longitude or latitude. If spatial gradients did exist, as one would expect if the particles were strongly constrained to follow field lines, the corotation of the interplanetary magnetic structure would produce differ-ing variations in the time intensity profiles at two widely sep-arated spacecraft, destroying the parallel decays typically ob-served at late times. The clear implication is that cross-field propagation has been efficient enough to erase spatial gra-dients and to produce a uniform flux within the inner helio-sphere, independent of longitude, latitude, or radius (at least out to several AU from the Sun). This effect has been called the “reservoir effect”, since it appears that the inner helio-sphere becomes a uniform reservoir of energetic charged par-ticles. After formation, the reservoir slowly dissipates as a result of the normal diffusion, convection, adiabatic cooling, and drift mechanisms that govern both the propagation of so-lar energetic particles and the soso-lar modulation of cosmic rays. The effect was first noted by McKibben (1972), and has been discussed more recently by Reames et al. (1996). It may also be related to the super-events discussed by Dr¨oge et al. (1991). However, despite its long history of observation, it is not yet understood in any detail.
4 Summary and conclusions
During Ulysses’ second Fast Latitude Scan, during which it passed over both the south and north polar regions of the Sun
10-6 10-5 10-4 10-3 10-2 10-1 100 101 102.0 101.8 101.6 101.4 101.2 101.0 100.8 100.6 Ulysses HET IMP-8 Protons: 70-95 MeV (a) -50 0 50 Footpoint Latitude (°) 102.0 101.8 101.6 101.4 101.2 101.0 100.8 100.6 Year - 1900 (d) 10-6 10-5 10-4 10-3 10-2 10-1 100 101 Flux (cm 2 s sr MeV) -1 102.0 101.8 101.6 101.4 101.2 101.0 100.8 100.6 Protons: ~35-70 MeV (b) -150 -100 -50 0 50 100 150 East CM West 102.0 101.8 101.6 101.4 101.2 101.0 100.8 100.6 800 km/s 400 km/s 400 km/s Solar Longitude (°) (c)
Jan Mar May Jul
Nov
Sep Oct Dec Feb Apr Jun Aug Sep Oct Nov Dec
Aug
Jul Jan
Fig. 5. (a)–(b) Fluxes of protons at energies of (a) ∼70–95 MeV (a) and (b) ∼35–70 MeV (see note on energy intervals in caption for Fig. 1c)
measured at IMP (blue) and Ulysses (red) during the solar maximum polar passes and fast latitude scan. Light blue shading indicates the
periods when Ulysses latitude was >70◦. IMP-8 operations were terminated after Day 253, 2001. (c) Locations in longitude with respect to
central meridian observed from Earth of solar flares associated with Solar Energetic Particle events observed at IMP-8. Solid dots indicate events observed both at Ulysses and IMP. Open dots correspond to events producing particle increases observed only at IMP. Estimated uncertainties in the position are shown as error bars. Gray shading indicates the invisible hemisphere of the Sun. Flare locations on the invisible hemisphere are estimates based on any information available, including inferred position of active regions, observations of CMEs, radio emissions, etc. Red (or salmon) and blue curves show the location of the footpoints on the Sun of ideal Parker spiral field lines through IMP (blue) and Ulysses (red, salmon) for the solar wind velocities indicated. For IMP and Ulysses through the middle of 2001, slow solar wind (∼400 km/s) dominated. After the middle of 2001, Ulysses began to observe fast polar coronal hole solar wind (∼800 km/s) during certain intervals. The salmon curve indicates the footpoint position for 800 km/s solar wind. The actual footpoint position thus should lie on or between the 400 and 800 km/s curves. (d) Same as (c) for the latitudinal positions of the solar flares associated with SEP events observed at IMP-8. Solar wind velocity does not affect footpoint positions in latitude for the classical Parker spiral field.
and traversed a latitude range from 80◦S to 80◦N, we have
obtained the first observations of the 3-dimensional distribu-tion of energetic charged particles in the inner heliosphere at solar maximum. The principal conclusions are:
1. At solar maximum, latitudinal variations in the solar modulation of galactic cosmic rays have essentially dis-appeared.
2. Local variations in modulation, such as Forbush de-creases, which arise from local conditions in the solar wind, continue to be observed, but as superposed
fluc-tuations on a general level of modulation that appears to be the same for all points in the inner heliosphere. This suggests that the modulation level may be set by conditions in the outer heliosphere. As a result of a ran-dom walk of fields (Jokipii and Parker, 1969), differen-tial rotation-driven latitudinal wandering of field lines, (Fisk, 1996) or simple cross-field diffusion any point in the inner heliosphere may be affected by conditions over a wide range of heliographic latitudes in the outer heliosphere, resulting in the establishment of a uniform intensity in response to global conditions in the region
within a few AU of the Sun.
3. Observations of solar energetic particle events show that, for almost all large events, significant particle in-creases are observed both near Earth and at Ulysses, whatever its position with respect to Earth or to the location of the flare (and presumably lift-off point of the CME) in radius, longitude, or latitude. For protons above ∼10 MeV and for electrons of energy ∼2 MeV and above, onsets are reasonably prompt, though at the highest latitudes the rise to maximum may be slow and the maximum intensity significantly less than near Earth. At energies near 1 MeV, onsets from individual events can sometimes be seen, but the overall profiles appear to be controlled mainly by local interplanetary conditions.
4. Initial anisotropies of solar energetic particles observed at Ulysses are commonly directed outward along the fields at all latitudes, implying that the point of injection for particles onto the field lines sampled by Ulysses is closer to the Sun than Ulysses. This requires either ac-celeration over a very broad, perhaps even global front, or very effective transport of energetic charged particles across the main interplanetary magnetic field in the in-ner heliosphere.
5. Within 3–4 days after almost every large event, the pro-ton fluxes observed at energies between 10–100 MeV near Earth and at Ulysses approach equality, and remain nearly equal for the rest of the decay of the event. Given the presumed continuing corotation of the particle pop-ulation with the Sun, this implies the disappearance of spatial gradients that can only be explained by surpris-ingly easy propagation of particles in both latitude and longitude.
Combining observations from both the solar minimum and solar maximum fast latitude scans, the overall message seems to be that energetic charged particle populations in the equa-torial and polar zones are tightly coupled, with variations in intensity in one zone inducing similar changes in the other, in many cases within hours. As is most apparent from the late-phase behavior of solar energetic particle events at solar maximum, within at most a few days nearly full equaliza-tion of particle intensities between the equator and the poles is readily established. This ease of propagation in three di-mensions along and across the average magnetic field lines continues to provide a challenge to theories of particle prop-agation in the interplanetary medium.
Acknowledgements. This work was supported in part by NASA/JPL Contract 955432 and by NASA Grants NAG 5-11036 and NAG 5-8032. M.Y. Hofer acknowledges support from
an ESA Research Fellowship. We also gratefully acknowledge
observations made available by the ACE EPAM and SWEPAM teams and by the Ulysses SWOOPS experiment team.
Topical Editor R. Forsyth thanks two referees for their help in evaluating this paper.
References
Balogh, A., Smith, E. J., Tsurutani, B. T., Southwood, D. J., Forsyth, R. J., and Horbury, T. S.: The Heliospheric Magnetic Field Out of the Ecliptic Plane, Science, 268, 1007, 1995. Burger, R. A. and Hattingh, M.: Towards a Realistic Diffusion
Ten-sor for Galactic Cosmic Rays, Astrophys. J., 505, 244, 1998. Dr¨oge, W., M¨uller-Mellin, R., and Cliver, E. W.: The Propagation
of Super-Events from 0.3-35 AU, Proc. XXII Int’l Cosmic Ray Conf. (Dublin), 3, 300, 1991.
Eraker, J. H. and Simpson, J. A.: Jovian electron propagation close to the sun at about 0.5 AU, Astrophys. J. Lett., 232, L131, 1979. Eraker, J. H.: Origins of the Low Energy Relativistic Interplanetary
Electrons, Astrophys. J., 257, 862, 1982.
Fisk, L. A. and Jokipii, J. R.: Mechanisms for Latitudinal Transport of Energetic Particles in the Heliosphere, Sp. Sci. Rev., 89, 115, 1999.
Fisk, L. A.: Motion of the Footpoints of Heliospheric Magnetic Field Lines at the Sun: Implications for Recurrent Energetic Par-ticle Events at High Heliographic Latitudes, J. Geophys. Res., 101, 15 547, 1996.
Garcia-Mu˜noz, M., Mason, G. M., and Simpson, J. A.: The Age of
the Galactic Cosmic Rays Derived from the Abundance of10Be,
Astrophys. J., 217, 859, 1977.
Gold, R. E., Krimigis, S. M., Hawkins, S. E., et al.: Electron, Pro-ton, and Alpha Monitor on the Advanced Composition Explorer, Sp. Sci. Rev., 85, 541, 1998.
Haasbroek, L. J., Potgieter, M. S., and Wibberenz, G.: Long-term Cosmic Ray Modulation along the Ulysses Trajectory: A Numer-ical Simulation, Proc. XXIV Int. Cosmic Ray Conf., (Rome), 4, 768, 1995.
Heber, B., Dr¨oge, W., Kunow, H., M¨uller-Mellin, R., Wibberenz, G., Ferrando, P., Raviart, A., and Paizis, C.: Spatial variation of
>106 MeV proton fluxes observed during the Ulysses rapid
lat-itude scan: Ulysses COSPIN/KET results, Geophys. Res. Lett., 23, 1513, 1996.
Heber, B., Ferrando, P., Raviart, A., et al.: 3–20 MeV Electrons in the inner Three-dimensional Heliosphere at Solar Maximum: Ulysses COSPIN/KET Observations, Astrophys. J., 579, 884, 2002.
Heber, B., Sarris, G., Paizis, C., et al.: The Ulysses Fast Latitude Scans: Ulysses COSPIN/KET Observations, Ann. Geophysicae, this issue, 2003.
Horbury, T. S., Balogh, A., Forsyth, R. J., and Smith, E. J.: The Rate of Turbulent Evolution over the Sun’s Poles, Astron. Astrophys., 316, 333, 1996.
Jokipii, J. R., Levy, E. H., and Hubbard, W. B.: Effects of Particle Drift on Cosmic Ray Transport, I. General Properties, Applica-tion to Solar ModulaApplica-tion, Astrophys. J., 213, 861, 1977. Jokipii, J. R. and K´ota, J.: The Polar Heliospheric Magnetic Field,
Geophys. Res. Lett., 16, 1, 1989.
Jokipii, J. R. and Parker, E. N.: Random Walk of Magnetic Lines of Force in Astrophysics, Phys. Rev. Lett., 21, 44, 1969.
K´ota, J. and Jokipii, J. R.: Corotating Variations of Cosmic Rays Near the South Heliospheric Pole, Science, 268, 1024, 1995. K´ota, J. and Jokipii, J. R.: Modeling of 3-D Corotating Cosmic-Ray
Structures in the Heliosphere, Sp. Sci. Rev., 83, 137, 1998. Kunow, H., Dr¨oge, W., Heber, B., et al.: High Energy Cosmic
Ray Nuclei Results on Ulysses: 2. Effects of a Recurrent High Speed Stream from the Southern Coronal Hole, Astron. Astro-phys. Suppl. Series, 92, 397, 1995.
McKibben, R. B., Simpson, J. A., Zhang, M., et al.: Ulysses Out-of-Ecliptic Observations of “27-Day” Variations in High Energy Cosmic Ray Intensity, Space Sci. Rev., 72, 403, 1995.
McKibben, R. B.: The Azimuthal Propagation of Low Energy Solar Flare Protons as Observed from Spacecraft Very Widely Sepa-rated in Solar Azimuth, J. Geophys. Res., 77, 3957, 1972. McKibben, R. B.: Three-Dimensional Solar Modulation of Cosmic
Rays and Anomalous Components in the Inner Heliosphere, Sp. Sci. Rev., 83, 21, 1998.
Parker, E. N.: The Passage of Energetic Charged Particles through Interplanetary Space, Planet. Space Sci., 13, 9, 1965.
Phillips, J. L., Goldstein, B. E., Gosling, J. T., Hammond, C. M., Hoeksema, J. T., and McComas, D. J.: Sources of Shocks and Compressions in the High-latitude Solar Wind, Geophys. Res. Lett., 22, 3305, 1995.
Potgieter, M. S. and Haasbroek, L. J.: The Simulation of Base-Line Cosmic-Ray Modulation for the Ulysses Trajectory, Proc. XXIII Int’l Cosmic Ray Conf., (Calgary), 3, 457, 1993.
Potgieter, M. S., Haasbroek, L. J., Ferrando, P., and Heber, B.: The Modeling of the Latitude Dependence of Cosmic Ray Protons and Electrons in the inner Heliosphere, Adv. Space Res., 19 (6), 917, 1997.
Potgieter, M. S.: The Modulation of Galactic Cosmic Rays in the Heliosphere: Theory and Models, Space Sci. Rev., 83, 147, 1998.
Reames, D. J., Barbier, L. M., and Ng, C. K.: The Spatial Distribu-tion of Particles Accelerated by Coronal Mass EjecDistribu-tion-Driven Shocks, Astrophys. J., 466, 472, 1996.
Roelof, E. C., Simnett, G. M., and Tappin, S. J.: The Regular struc-ture of Shock-Accelerated ∼40–100 keV Electrons in the High Latitude Heliosphere, Astron. Astrophys., 316, 481, 1996. Sanderson, T. R., Bothmer, V., Marsden, R. G., et al.: The Ulysses
South Polar Pass: Energetic Ion Observations, Geophys. Res. Lett., 22, 3357, 1995.
Simpson, J. A., Anglin, J. D., Balogh, A., et al.: The Ulysses Cos-mic Ray and Solar Particle Investigation, Astron. Astrophys., 92, 365, 1992.
Simpson, J. A., Anglin, J. D., Bothmer, J. J., et al.: Cosmic Ray and Solar Particle Investigations over the South Polar Regions of the Sun, Science, 268, 1019, 1995.
Simpson, J. A., Zhang, M., and Bame, S.: A Solar Polar North-South Asymmetry for Cosmic Ray Propagation in the Helio-sphere: The Ulysses Pole-to-Pole Rapid Transit, Astrophys. J. Lett., 465, L69, 1996.
Zhang, M., McKibben, R. B., Lopate, C., Jokipii, J. R., Giacalone, J., Kallenrode, M.-B., and Rassoul, H. K.: Ulysses Observa-tions of Solar Energetic Particles From the July 14, 2000 Event at High Heliographic Latitudes, J. Geophys. Res., 108(A4), doi: 10.1029/2002JA009531, 2003.