HAL Id: hal-01331770
https://hal.archives-ouvertes.fr/hal-01331770
Submitted on 3 Dec 2020
HAL is a multi-disciplinary open access
archive for the deposit and dissemination of
sci-entific research documents, whether they are
pub-lished or not. The documents may come from
teaching and research institutions in France or
abroad, or from public or private research centers.
L’archive ouverte pluridisciplinaire HAL, est
destinée au dépôt et à la diffusion de documents
scientifiques de niveau recherche, publiés ou non,
émanant des établissements d’enseignement et de
recherche français ou étrangers, des laboratoires
publics ou privés.
Validation of GOMOS Ozone Profiles Using NDSC
Lidar: Statistical Comparisons
Philippe Keckhut, Stéphane Marchand, Alain Hauchecorne, Sophie
Godin-Beekmann, Françoise Pinsard, I. Stuart Mcdermid, Thierry Leblanc,
Georg Hansen, Jean-Luc Baray, Hassan Bencherif, et al.
To cite this version:
Philippe Keckhut, Stéphane Marchand, Alain Hauchecorne, Sophie Godin-Beekmann, Françoise
Pin-sard, et al.. Validation of GOMOS Ozone Profiles Using NDSC Lidar: Statistical Comparisons.
ENVISAT Validation Workshop (ESA SP-531), Dec 2003, Frascati, Italy. pp.10.1. �hal-01331770�
VALIDATION OF GOMOS OZONE PROFILES
USING NDSC LIDAR: STATISTICAL COMPARISONS
Philippe Keckhut1, Stephane Marchand1, Alain Hauchecorne1, Sophie Godin-Beekmann1, Françoise Pinsard1,
Stuart McDermid2, Thierry Leblanc2, Georg Hansen4, Jean-Luc Baray3, Hassan Bencherif3,
Dan Swart5, Yasjka Meijer5, Shiv Pal6,Marielle Guirlet7,Claude Vialle1, Françoise Posny3, Florence Goutail1
(1) Service d’Aéronomie/IPSL, Verrières-le-Buisson France, E-mail: [email protected], (2) Table Mountain Facility, Jet propulsion laboratory, Wrightwood, USA,
(3) Laboratoire de Physique de l’Atmosphère, Université de La Réunion, St-Denis, France, (4) Norwegian Institute for Air Research, Kjeller, Norway,
(5) National Institute for Public Health and the Environment, Bilthoven, The Netherlands, (6) Science And Art Innovation Inc., Ontario, Canada,
(7) ACRI-ST, Sophia-Antipolis, France
ABSTRACT
The lidars deployed in the NDSC framework have been used for the validation of GOMOS onboard ENVISAT. During the commissioning phase around ten coincidences per site have been investigated. No significant bias, larger than ±5%, has been reported except around 50 km and 20 km where both techniques are known to present some limitations. The estimated errors of both GOMOS and lidar are in good agreement with the standard deviation of the differences between coincidences. At higher latitude, comparisons are not so good because of the measurement conditions of bright limb during this period.
1. DATA DESCRIPTION
The network for the Detection of Stratospheric Change (NDSC) is a set of high-quality, remote-sounding research stations, designed for observing the physical and chemical state of the stratosphere and mesosphere [1]. Vertical profiles of temperature and ozone are measured using lidars and radiosondes. Stations consist of at least five primary stations (fully equipped) and of some other complementary sites (providing a more limited number of instruments), are located from poles to tropics providing a well-adapted spatial coverage for an independent calibration of satellite sensors of the middle atmosphere. The instruments included in this project were selected on the basis of insuring the largest latitudinal coverage from strategic stations located from mid-latitudes, to high-latitudes and tropics (where bias may be larger) and from northern to southern hemisphere. They were also selected on the basis of being operational high quality measurements managed by scientists interested in satellite sensor validation. Quality control is continuously achieved through rigorous calibration procedures and inter-comparison campaigns. A review of those comparisons involving lidars has been performed and presented in table 1. Further information about lidar can be found on the NDSC server (see http://www.ndsc.ncep.noaa.gov).
Parameter Altitude Bias variance
Ozone Temperature < 20 km < 20 km 20-35 km > 40 km 30 km 30 km 35-65 km 75 km
5-10 % without Raman channels 5 % with Raman channels 2%
5-10 %
5-10 K without a Raman channel expected 1 K with a Raman channel 1 K 5-10 K 5% 5 % 2% 5-10 % 2 K 4 K 2 K 5-10 K
Table 1. Errors (systematic and random) expected within ozone and temperature lidar within the NDSC
The initial objective of this project was to provide numerous coincident measurements from the ground to insure the best validation. Most of the data obtained during the commissioning phase have been archived in the NILU database. The validation of ozone and temperature profiles using NDSC measurements have been investigated through statistical comparisons to take the advantages of the large number of coincidences expected mainly with lidar that operate at night
__________________________________________________________________________________________________________ Proc. of Envisat Validation Workshop, Frascati, Italy, 9 – 13 December 2002 (ESA SP-531, August 2003)
during clear sky. Around 2-5 measurements per week have been obtained. Eight NDSC sites from 69°N to 67°S have participated in this project. At this point, comparisons between ozone measurements provided exclusively by GOMOS (GOM_NL__2P generated with GOPR_LV2_5.3, see more details in annexe) experiment and lidars have been performed. Two lidars, belonging to two other specific AO have not yet been investigated with a similar protocol. Another objective was to take into account as far as possible the atmospheric variability including the use of assimilation tools. This work has not yet been conducted.
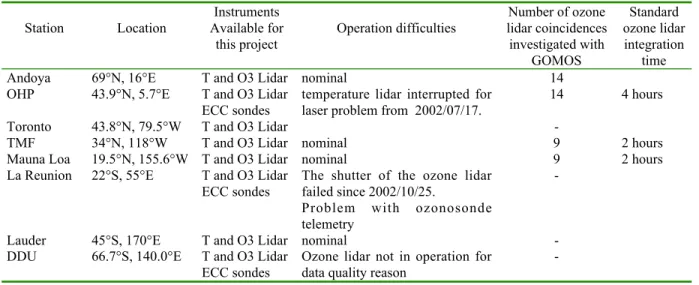
Station Location Available forInstruments
this project Operation difficulties
Number of ozone lidar coincidences investigated with GOMOS Standard ozone lidar integration time
Andoya 69°N, 16°E T and O3 Lidar nominal 14
OHP 43.9°N, 5.7°E T and O3 Lidar
ECC sondes temperature lidar interrupted forlaser problem from 2002/07/17. 14 4 hours
Toronto 43.8°N, 79.5°W T and O3 Lidar
-TMF 34°N, 118°W T and O3 Lidar nominal 9 2 hours
Mauna Loa 19.5°N, 155.6°W T and O3 Lidar nominal 9 2 hours
La Reunion 22°S, 55°E T and O3 Lidar
ECC sondes The shutter of the ozone lidarfailed since 2002/10/25. Problem with ozonosonde telemetry
-Lauder 45°S, 170°E T and O3 Lidar nominal
-DDU 66.7°S, 140.0°E T and O3 Lidar
ECC sondes Ozone lidar not in operation fordata quality reason
-Table 2. List of stations involved in ENVISAT validation through the VETO proposal
2. DATA COMPARISONS
While coincidences with GOMOS operations were planned in advance to optimise time and spatial coincidences, the comparison configuration with lidars was very good. GOMOS measurements were performed between 22:00 and 23:00 hour solar local time, while lidars operate at night mainly during the first half of the night depending of weather conditions. In this configuration most of the GOMOS profiles were obtained in dark limb that is the conditions giving the best accuracy. First individual comparisons were obtained on April 2002.
Figure 1. A comparison between, a GOMOS profile and a lidar profile at OHP. The mean tangent altitude and OHP were separated by 250 km and the time difference was 2 hours. In this case the star occulted has a magnitude of 2.4 and a spectrum associated with a equivalent black body temperature of 28000 Kelvin.
Figure 2. Statistical mean differences with ± one standard error (right) and the both mean profiles (left) for Andoya (top), OHP (second line), Table Mountain (third line) and Hawaii (bottom).
Similarly with the comparison shown in figure 1, the agreements were quite good both qualitatively and quantitatively. Most of the structures have been seen similarly with the both instruments except in the lower stratosphere where the
noise increase rapidly and for some stars having a lower intensity radiation. When large ozone structures were present in the vertical profiles, no significant altitude shift has been observed.
3. VERTICAL BIAS
While a still too small number of coincidences were available, first statistical comparisons were conduced with the lidar data specifically associated with the AO 360 VETO. Mean differences are usually associated with systematic differences or bias. These preliminary comparisons reveal between 20 and 45 km no bias larger than ±10% except for Andoya site where larger differences can be noted below 25 km and above 40 km with bias of 20%. However during the early fall period sun is still high, for the latitude of Andoya, and the background noise for both lidar and GOMOS is larger. To appreciate, how significant were those mean differences, standard errors (SE) have been calculated. This quantity is estimated as the mean standard deviation of the difference divided by the square root of the number (n) of available coincidences in assuming that they are independent (see Eq. 1). From those estimates none of the differences appear systematically at the same altitude levels. While for OHP, the largest bias appears between 25 and 35 km, for Andoya and TMF a bias is noted below 25 km. For Hawaii, a significant bias appears above 45 km where the lidar signals from the other sites are already under the noise. In addition to altitude and latitude, other parameters may impact on the accuracy of GOMOS ozone retrieval, such as the star radiance and the temperature, that have not yet be investigated.
variance n
SE= 1 ◊ (1)
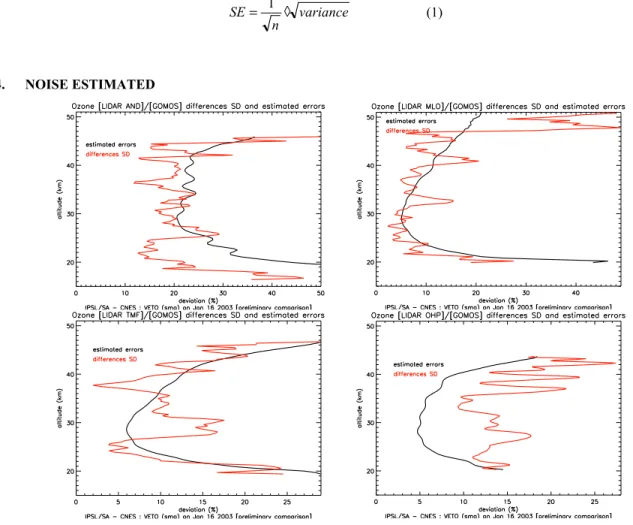
4. NOISE ESTIMATED
Figure 3. Mean standard deviations of the difference between GOMOS and Lidars compared to the expected standard deviation estimated by the square root of the sum of both variances of the estimated errors of GOMOS and the given lidar. These results are provided for Andoya (top left), Hawaii (top right), Table Mountain (bottom left) and OHP (bottom right).
The standard deviation of the differences between GOMOS and lidar data can be explained by the contribution of the instrumental noise of both instruments that can be estimated from the expected errors of the both instruments. Differences can also come from the geometry and characteristic of the both instruments. Lidar measurements are integrated over several hours while the horizontal resolution of GOMOS is larger due to the horizontal view path. The uncertainty of GOMOS measurements is larger at the low altitudes because UV wavelength is quickly absorbed and signals became smaller. In opposite, lidar uncertainties increase with altitude because of the photon noise related to the air-density decrease. The quadratic addition of GOMOS and lidar instrumental uncertainties are minimum (5%) around 25-30 km except for Andoya (20%). The quadratic addition of the both instrument is around 20% at 45 km depending of the lidar site and 15% at 20 km depending of the measurement conditions of GOMOS.
The standard deviation of the differences between the both instruments is in good agreement with the estimated error for all the sites and mainly for Hawaii. At mid-latitude, the both sites reveal larger differences between GOMOS and lidar at 25-35 km probably due to the instrument geometries and the presence of small scale structures such as laminae. For Andoya surprisingly exhibits a standard deviation between the both sources smaller than the quadratic sum of the estimated errors below 25 km.
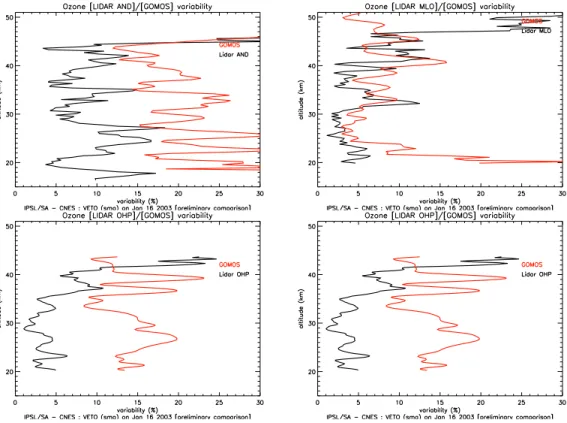
5. FILERING EFFECTS AND THE GEOPHYSICAL CONTRIBUTIONS
Figure 4. Temporal variability deduced from both lidar and GOMOS series. These results are provided for Andoya (top left), Hawaii (top right), Table Mountain (bottom left) and OHP (bottom right).
The variability of the data series is calculated for each datasets in using the coincident measurements. The comparisons of GOMOS variability with the one estimated with the lidar located at Hawaii, reveal both some fluctuations between 5 and 10 % according to altitudes and show a very good agreement except above 45 km and below 25 km where the instrumental noises increase considerably respectively for lidar and GOMOS as expected. Temporal errors are in good agreement with both the quadratic sum of the estimated errors and the standard deviation of the differences. At mid latitude, GOMOS provides a larger variability increasing up to 15-20 % while lidars remain smaller than 10% and often even smaller than 5%. This can be mainly due, to the short-term variability, better reproduced with GOMOS. However, we can note some temporal fluctuations with GOMOS larger than with lidars around 25-35 km where the variance increase from 5 to 15%. This result is again in agreement with the quadratic sum of the estimated errors and the standard deviation of the difference. This result reveals that GOMOS records a larger atmospheric variability than lidar. This is not yet clear if it is due to the instantaneous nature of the GOMOS measurements compared to the integrated
lidar soundings or if it is due to some additional GOMOS retrieval uncertainties. At higher latitude (Andoya) the GOMOS temporal variability is similar to the standard deviation of the difference between GOMOS and lidar.
6. CONCLUSIONS
During the first few months of the commissioning phase where GOMOS data were available a large number of data were obtained and good coincidences (around 10 per site). This number of coincidences allow to estimates first statistical comparisons. They have revealed no bias systematically at all lidar sites, and an agreement with lidar of ±10% have been obtained which is close to the expected accuracy of these instruments. Estimated errors are in agreement with the standard deviation of the daily differences. At higher latitude, a larger bias of 20 % can be noted. However the GOMOS measurement conditions are not the best due to the bright limb conditions. Those conditions do not induced a larger noise but also some bias. This study shows that GOMOS is observing a larger variability than lidar.
ACKNOWLEDGEMENTS
The coordination of the validation activities was supported by the French Space Agency CNES. A lot of efforts have been done, by all the technicians located on the different lidar sites, to insure numerous coincident measurements. Lidar teams involved in Hawaii, in California, in south of France and in Andoya are specially acknowledged for providing in nearly real time the lidar measurements. The data used in this publication were obtained as part of the Network for the Detection of Stratospheric Change (NDSC) and are publicly available (see http://www.ndsc.ncep.noaa.gov).
REFERENCES
ANNEXE
Here is presented all the files used in the comparisons.
The GOM_NL__2P files were produced by the software version GOPR_LV2_5.3 and retrieved from the ACRI-ST server. The HDF files were downloaded from the NILU database server.
For Table Mountain Facilities station
groundbased_lidar.dial_cnrs.sa003_table.mountain_d2_20021001t052915z_001.hdf GOM_NL__2PNACR20021001_050053_000000572010_00004_03064_0001.N1 groundbased_lidar.dial_cnrs.sa003_table.mountain_d2_20021001t052915z_001.hdf GOM_NL__2PNACR20021001_081642_000000612010_00006_03066_0001.N1 groundbased_lidar.dial_cnrs.sa003_table.mountain_d2_20021002t063737z_001.hdf GOM_NL__2PNACR20021002_060614_000000582010_00020_03080_0001.N1 groundbased_lidar.dial_cnrs.sa003_table.mountain_d2_20021002t063737z_001.hdf GOM_NL__2PNACR20021002_074651_000000592010_00020_03080_0001.N1 groundbased_lidar.dial_cnrs.sa003_table.mountain_d2_20021003t061414z_001.hdf GOM_NL__2PNACR20021003_053304_000000572010_00033_03093_0001.N1 groundbased_lidar.dial_cnrs.sa003_table.mountain_d2_20021004t054338z_001.hdf GOM_NL__2PNACR20021004_064357_000000592010_00049_03109_0001.N1 groundbased_lidar.dial_cnrs.sa003_table.mountain_d2_20021021t063946z_001.hdf GOM_NL__2PNACR20021021_061141_000000532010_00291_03351_0001.N1 groundbased_lidar.dial_cnrs.sa003_table.mountain_d2_20021028t045411z_001.hdf GOM_NL__2PNACR20021028_054745_000000452010_00392_03452_0001.N1 groundbased_lidar.dial_cnrs.sa003_table.mountain_d2_20021028t045411z_001.hdf GOM_NL__2PNACR20021028_054909_000000562010_00392_03452_0001.N1 For Mauna Loa station
groundbased_lidar.dial_cnrs.sa004_mauna.loa_d2_20020907t060504z_001.hdf GOM_NL__2PNACR20020907_072801_000000472009_00163_02722_0001.N1 groundbased_lidar.dial_cnrs.sa004_mauna.loa_d2_20020917t073320z_001.hdf GOM_NL__2PNACR20020917_085526_000000632009_00307_02866_0001.N1 groundbased_lidar.dial_cnrs.sa004_mauna.loa_d2_20020923t080609z_001.hdf GOM_NL__2PNACR20020923_090609_000000492009_00393_02952_0001.N1 groundbased_lidar.dial_cnrs.sa004_mauna.loa_d2_20020924t073618z_001.hdf GOM_NL__2PNACR20020924_083438_000000482009_00407_02966_0001.N1 groundbased_lidar.dial_cnrs.sa004_mauna.loa_d2_20020924t073618z_001.hdf GOM_NL__2PNACR20020924_083604_000000622009_00407_02966_0001.N1 groundbased_lidar.dial_cnrs.sa004_mauna.loa_d2_20021001t072409z_001.hdf GOM_NL__2PNACR20021001_081306_000000462010_00006_03066_0001.N1 groundbased_lidar.dial_cnrs.sa004_mauna.loa_d2_20021001t072409z_001.hdf GOM_NL__2PNACR20021001_081514_000000472010_00006_03066_0001.N1 groundbased_lidar.dial_cnrs.sa004_mauna.loa_d2_20021001t072409z_001.hdf GOM_NL__2PNACR20021001_081642_000000612010_00006_03066_0001.N1 groundbased_lidar.dial_cnrs.sa004_mauna.loa_d2_20021001t072409z_001.hdf GOM_NL__2PNACR20021001_094844_000000732010_00007_03067_0001.N1 For Observatoire de Haute Provence station
groundbased_lidar.dial_cnrs.sa001_ohp_d2_20020916t195817z_001.hdf GOM_NL__2PNACR20020916_194004_000000442009_00300_02859_0001.N1 groundbased_lidar.dial_cnrs.sa001_ohp_d2_20020916t195817z_001.hdf GOM_NL__2PNACR20020916_211753_000000492009_00301_02860_0001.N1 groundbased_lidar.dial_cnrs.sa001_ohp_d2_20020916t195817z_001.hdf GOM_NL__2PNACR20020916_212040_000000452009_00301_02860_0001.N1 groundbased_lidar.dial_cnrs.sa001_ohp_d2_20020917t194729z_001.hdf GOM_NL__2PNACR20020917_204618_000000492009_00315_02874_0001.N1 groundbased_lidar.dial_cnrs.sa001_ohp_d2_20020917t194729z_001.hdf GOM_NL__2PNACR20020917_204906_000000452009_00315_02874_0001.N1 groundbased_lidar.dial_cnrs.sa001_ohp_d2_20020918t191842z_001.hdf GOM_NL__2PNACR20020918_201731_000000462009_00329_02888_0001.N1 groundbased_lidar.dial_cnrs.sa001_ohp_d2_20020918t191842z_001.hdf GOM_NL__2PNACR20020918_215459_000000512009_00330_02889_0001.N1 groundbased_lidar.dial_cnrs.sa001_ohp_d2_20020920t192006z_001.hdf GOM_NL__2PNACR20020920_205123_000000562009_00358_02917_0001.N1 groundbased_lidar.dial_cnrs.sa001_ohp_d2_20020920t192006z_001.hdf
GOM_NL__2PNACR20020920_205457_000000472009_00358_02917_0001.N1 groundbased_lidar.dial_cnrs.sa001_ohp_d2_20020920t192006z_001.hdf GOM_NL__2PNACR20020920_223200_000000532009_00359_02918_0001.N1 groundbased_lidar.dial_cnrs.sa001_ohp_d2_20020923t190444z_001.hdf GOM_NL__2PNACR20020923_205759_000000502009_00401_02960_0001.N1 groundbased_lidar.dial_cnrs.sa001_ohp_d2_20020924t215251z_001.hdf GOM_NL__2PNACR20020924_202624_000000482009_00415_02974_0001.N1 groundbased_lidar.dial_cnrs.sa001_ohp_d2_20020924t215251z_001.hdf GOM_NL__2PNACR20020924_220627_000000532009_00416_02975_0001.N1 groundbased_lidar.dial_cnrs.sa001_ohp_d2_20020925t195958z_001.hdf GOM_NL__2PNACR20020925_195433_000000512009_00429_02988_0001.N1 For ALOMAR station
groundbased_lidar.dial_cnrs.sa001_ohp_d2_20020916t195817z_001.hdf GOM_NL__2PNACR20020916_194004_000000442009_00300_02859_0001.N1 groundbased_lidar.dial_cnrs.sa001_ohp_d2_20020916t195817z_001.hdf GOM_NL__2PNACR20020916_211753_000000492009_00301_02860_0001.N1 groundbased_lidar.dial_cnrs.sa001_ohp_d2_20020916t195817z_001.hdf GOM_NL__2PNACR20020916_212040_000000452009_00301_02860_0001.N1 groundbased_lidar.dial_cnrs.sa001_ohp_d2_20020917t194729z_001.hdf GOM_NL__2PNACR20020917_204618_000000492009_00315_02874_0001.N1 groundbased_lidar.dial_cnrs.sa001_ohp_d2_20020917t194729z_001.hdf GOM_NL__2PNACR20020917_204906_000000452009_00315_02874_0001.N1 groundbased_lidar.dial_cnrs.sa001_ohp_d2_20020918t191842z_001.hdf GOM_NL__2PNACR20020918_201731_000000462009_00329_02888_0001.N1 groundbased_lidar.dial_cnrs.sa001_ohp_d2_20020918t191842z_001.hdf GOM_NL__2PNACR20020918_215459_000000512009_00330_02889_0001.N1 groundbased_lidar.dial_cnrs.sa001_ohp_d2_20020920t192006z_001.hdf GOM_NL__2PNACR20020920_205123_000000562009_00358_02917_0001.N1 groundbased_lidar.dial_cnrs.sa001_ohp_d2_20020920t192006z_001.hdf GOM_NL__2PNACR20020920_205457_000000472009_00358_02917_0001.N1 groundbased_lidar.dial_cnrs.sa001_ohp_d2_20020920t192006z_001.hdf GOM_NL__2PNACR20020920_223200_000000532009_00359_02918_0001.N1 groundbased_lidar.dial_cnrs.sa001_ohp_d2_20020923t190444z_001.hdf GOM_NL__2PNACR20020923_205759_000000502009_00401_02960_0001.N1 groundbased_lidar.dial_cnrs.sa001_ohp_d2_20020924t215251z_001.hdf GOM_NL__2PNACR20020924_202624_000000482009_00415_02974_0001.N1 groundbased_lidar.dial_cnrs.sa001_ohp_d2_20020924t215251z_001.hdf GOM_NL__2PNACR20020924_220627_000000532009_00416_02975_0001.N1 groundbased_lidar.dial_cnrs.sa001_ohp_d2_20020925t195958z_001.hdf GOM_NL__2PNACR20020925_195433_000000512009_00429_02988_0001.N1