HAL Id: hal-00105724
https://hal.archives-ouvertes.fr/hal-00105724
Submitted on 12 Oct 2006HAL is a multi-disciplinary open access archive for the deposit and dissemination of sci-entific research documents, whether they are pub-lished or not. The documents may come from teaching and research institutions in France or abroad, or from public or private research centers.
L’archive ouverte pluridisciplinaire HAL, est destinée au dépôt et à la diffusion de documents scientifiques de niveau recherche, publiés ou non, émanant des établissements d’enseignement et de recherche français ou étrangers, des laboratoires publics ou privés.
Zn speciation in the organic horizon of a contaminated
soil by micro X-ray fluorescence, micro and powder
EXAFS spectroscopy and isotopic dilution.
Géraldine Sarret, Jérôme Balesdent, Lamia Bouziri, Jean-Marie Garnier,
Matthew A. Marcus, Nicolas Geoffroy, Frédéric Panfili, Alain Manceau
To cite this version:
Géraldine Sarret, Jérôme Balesdent, Lamia Bouziri, Jean-Marie Garnier, Matthew A. Marcus, et al.. Zn speciation in the organic horizon of a contaminated soil by micro X-ray fluorescence, micro and powder EXAFS spectroscopy and isotopic dilution.. Environmental Science and Technology, American Chemical Society, 2004, 38 (10), pp.2792-2801. �hal-00105724�
Sarret G., Balesdent J., Bouziri L., Garnier J. M., Marcus M. A., Geoffroy N., Panfili F., and Manceau A. (2004) Zn speciation in the organic horizon of a contaminated soil by micro X-ray fluorescence, micro and powder EXAFS spectroscopy and isotopic dilution. Environ. Sci. Technol. 38, 2792-2801.
Zn speciation in the organic horizon of a contaminated soil
by micro X-ray fluorescence, micro and powder EXAFS spectroscopy and
isotopic dilution
Géraldine Sarret1*, Jérome Balesdent2, Lamia Bouziri2, Jean-Marie Garnier3,
Matthew A. Marcus4, Nicolas Geoffroy1, Frédéric Panfili1, and Alain Manceau1
1 - Environmental Geochemistry Group, LGIT, University of Grenoble and CNRS, BP 53, 38041 Grenoble Cedex 9, France
2 - Laboratoire d'Ecologie Microbienne de la Rhizosphere, UMR CNRS/CEA n°163 CEA DEVM Centre de Cadarache, 13108 Saint-Paul lez Durance Cedex, France
3 - Univ. Aix Marseille 3, CNRS, CEREGE, 13545 Aix en Provence, France
4 - Lawrence Berkeley National Laboratory, Advanced Light Source, MS 6-2100, Berkeley, CA 94720, USA.
*
Corresponding author: Environmental Geochemistry Group, LGIT, University of Grenoble
and CNRS, BP 53, 38041 Grenoble Cedex 9, France. Phone: 33 (0)4 76 82 80 21, fax: 33 (0)4 76 82 81 01, E-mail: gsarret@ujf-grenoble.fr
Abstract
Soils which have been acutely contaminated by heavy-metals show distinct characteristics, such as colonization by metal-tolerant plant species and topsoil enrichment in weakly degraded plant debris because biodegradation processes are strongly inhibited by contamination. Such an organic topsoil, located downwind of an active zinc smelter and extremely rich in Zn (~ 2%, dry weight), was investigated by X-ray diffraction (XRD), synchrotron-based X-ray microfluorescence (µSXRF), and powder and micro extended X-ray absorption fine structure (EXAFS) spectroscopy for Zn speciation, and by isotopic dilution for Zn lability. EXAFS spectra recorded on size fractions and on selected spots of thin sections were analyzed by principal component analysis (PCA) and linear combination fits (LCFs). Although Zn primary minerals (franklinite, sphalerite and willemite) are still present (~ 15% of total Zn) in the bulk soil, Zn was found to be predominantly speciated as Zn-organic matter complexes (~ 45%), outer-sphere complexes (~ 20%), sorbed phosphate (~ 10%) and Zn-sorbed iron oxyhydroxides (~ 10%). The bioaccumulated Zn fraction is likely complexed to soil organic matter after the plants' death. The proportion of labile Zn ranges from 54 to 92%, depending on the soil fraction, in agreement with the high proportion of organically-bound Zn. Despite its marked lability, Zn seems to be retained in the topsoil thanks to the huge content of organic matter, which confers to this horizon a high sorption capacity. The speciation of Zn in this organic soil horizon is compared with that found in other types of soils.
Introduction
Atmospheric emissions from non-ferrous metal industries generate extended diffuse contamination as well as acute contamination of the local environment (1). Since smelting facilities were historically located in densely populated areas, there is a risk of metal ingestion by humans, essentially by inhalation of dust particles and also via the transfer of metals to the drinking water and to the food chain. The zinc smelter of Auby (Nord, France) has been operating since 1869, and produces ca. 230 000 t Zn annually. The surrounding soils are strongly contaminated with Zn, Pb and Cd, as shown by several studies conducted in this area (2-5). Near the smelter, a particular ecosystem composed of Zn hyperaccumulating
(Arabidopsis halleri and Viola calaminaria) and Zn tolerant plants (Populus spec., Armeria maritima, Arrhenaterum elatius and Silene vulgaris) has developed. Zinc contamination is
restricted to the top-layer of the soil (3), which consists mainly of partially decomposed plant fragments and organic matter resulting from the inhibition of biodegradation processes due to metal toxicity (5). Similar organic layers have been reported in many other contaminated sites (6,7 and refs therein,8). The hyperaccumulation of metals in plant tissues, leading to the enrichment in metals of the topsoil after several vegetative cycles, has been proposed as a type of allelopathy, which would create toxic conditions for non-tolerant species (9,10). The most common mechanism of Zn storage in hyperaccumulating plants is their sequestration in vacuoles as organic acid complexes (11-14). However, the fate of these metals after the plants’ death is unknown. The purpose of this study is three-fold: (1), to identify and quantify the chemical forms of Zn in a topsoil rich in plant debris and residual organic matter near the Auby smelter, which is a generic case for this kind of contamination, (2), to estimate the bioavailability of Zn in this particular ecosystem and, (3), to evaluate the fate of
bioaccumulated Zn after plants' death.
EXAFS (Extended X-Ray Absorption Fine Structure) spectroscopy is a tool of choice for probing the local environment of Zn in soils and sediments (8,15-19). This method is sensitive to metals included in mineral structures, to metal precipitates, and sometimes to inner-sphere mineral surface complexes. It is less sensitive to metals bound to matrices composed of light elements such as organic matter, and to metals present as outer-sphere surface complexes. In natural systems, all these species may be present altogether, and the EXAFS signal from organic and outer-sphere complexes is then masked by the more intense signal from other species. To obtain the EXAFS spectra of pure species, one can combine powder EXAFS on bulk sample with chemical treatments (8,17,19) or use micro-focused EXAFS (µEXAFS) spectroscopy (16,18,20-22). In practice, however, most natural systems are still heterogeneous at the micrometer-scale, and µEXAFS spectra may be a weighted sum of component spectra from several individual species. Since the proportions of metal species are different in the bulk and in the set of laterally-resolved EXAFS spectra, their number and nature can be obtained by principal component analysis (PCA) (8,17,21,23,24). Eventually, the proportion of each species in the whole soil matrix is determined by decomposing the bulk average EXAFS spectrum with a linear combination of reference spectra identified by PCA.
The proportion of labile metal species can be estimated by chemical techniques, such as CaCl2
extraction (25) and isotopic dilution (26-28). This pool is operationally defined by its exchangeability between the solid phase and the solution during a given time. Most labile species consists of outer-sphere and weakly bound inner-sphere complexes on mineral surfaces and organic matter. In this study, physical techniques, including X-ray diffraction (XRD), synchrotron-based X-ray microfluorescence (µSXRF), and powder EXAFS and µEXAFS spectroscopy, were combined with isotopic dilution to obtain an in-depth
description of the nature and proportion of the labile and non-labile Zn species present in the studied organic soil.
Materials and Methods
Site and Soil Description
The soil studied comes from the Bois des Asturies in Auby (Nord, France), a poplar plantation located near and downwind an operating zinc smelter. The soil profile, its humus morphology, and floral and faunal composition were described by Gillet & Ponge (5). The soil presents a thick holorganic (i.e., essentially organic) OM horizon made of weakly degraded plant litter and roots, similar to a peat but with almost neutral pH (6.2). This layer is characterized by an extremely high Zn content (more than 2% dry weight). The changes in vegetation cover has been traced over recent decades based on the identification of plant siliquae. The ground was covered by mosses before the colonization by Arabidopsis halleri, and a more recent
additional colonization by Viola calaminaria. Animal faeces are almost absent throughout the organic horizon. The preservation of organic matter is believed to result from the resistance of metal-rich plant debris to microbial attack, and from the low faunal activity combined with an avoidance behavior of saprophagous fauna. For instance, Collembola found in the soil feed either on aerial deposits (spores, pollens) or on the underlying substrate (silt and clay particles and their attached microflora) (5).
In one of the most polluted zones, referred to as P2 in Gillet & Ponge (5), blocks of 550 cm2 horiz. × 12 cm vertic. (H×V) were extracted from the field in triplicate. The thick
holorganic horizon was separated in two layers called O1 (0-7 cm) and O2 (7-12 cm). The underlying A horizon contains much less organic carbon (TOC < 20 mg g-1 compared to ~ 380 mg g-1 in the topsoil, as determined by elemental analyzer) and zinc (< 2000 g kg-1,
compared to about 2% in the topsoil, as determined by inductively coupled plasma - atomic emission spectrometry (ICP-AES)). The present study is focused on the O2 layer. Soil
samples were dried at 50°C, weighted, and sieved at 2 mm. Particle-size and density fractions were separated after mechanical dispersion according to Balesdent et al. (29). Briefly, 75 g of dry soil (< 2mm) was placed in a 1-L polypropylene flask with 40 g of 5-mm diameter glass beads and 750 mL of deionized water, then shaken for 16 hours in a rotating shaker at 60 rpm. The 50-200 µm, 200-500 µm, and 500-2000 µm particle-size fractions were separated by wet sieving. To limit the leaching of Zn during sieving, the water was recycled during the
fractionation process. From the > 50 µm fractions, low-density organic debris (fraction "L") were separated from higher density mineral material (fraction "H") by repeated differential sedimentation in water. The H component was absent from the 500-2000 µm fraction and not separated from the 0-50 µm fraction. The final 0-50 µm suspension (2 L) was centrifuged at 7000g. The dissolved organic carbon in the supernatant was 1.3 mg per g of soil compared to ~ 380 mg g-1 for TOC.
Labile Zn was determined by isotopic dilution in the 0-50 µm, 50-200 µm and 200-500 µm fractions. The soil samples were homogenized, and four replicates of 200 mg were added to 60 ml Ca(NO3)2 10-3 M and immediately spiked with 60 µl of acidic 65Zn solution
containing 5.8 10-10 g/l of 65Zn and 1.3 10-7 g/l of stable Zn. The pH of the suspension was adjusted (± 0.2) close to the initial pH of the suspension (6.2). All samples were shaken for 48 hours at 25°C, and then filtered with 0.2 µm Nucleopore filters. A 76 hours-long kinetic study showed that steady-state of the concentrations in solution was reached after 24 hours.
Concentration of stable Zn in the filtrate was measured by ICP-AES, and labeled Zn concentration was measured by gamma spectrometry using a Ge coaxial detector (Eurysis
Mesures). The isotopically exchangeable Zn content (E value, g Zn kg-1) is the quantity of Zn in the soil with the same liquid/solid ratio as the 65Zn.
EZn = [Zn]sol (*Kd + L/S) [1]
where [Zn]sol is the concentration of Zn in solution (g L-1), *Kd is the solid/liquid
concentration of radioactive Zn (L kg-1), and L/S is the liquid-to-solid ratio (L kg-1) (26-28). The relative proportion of isotopically exchangeable Zn to aqua regia soluble Zn (%E) is defined as:
%E = (EZn/[Zn]T)100 [2]
where [Zn]T is the aqua regia soluble Zn content (g kg-1).
X-ray Diffraction
XRD patterns were recorded on powders with a Siemens D501 powder diffractometer equipped with a scintillation detector using Co Kα radiation (40 kV and 37.5 mA). Intensities were measured at intervals of 0.04° 2θ with a 10 s dwell time per point.
Powder EXAFS
Powder Zn K-edge EXAFS spectra were measured at room temperature on beamline D42 at the Laboratoire du Rayonnement Electromagnétique (LURE, Orsay, France) in
transmission mode using ionization chambers for Zn-rich samples, and on beamline FAME at the European Synchrotron Radiation Facility (ESRF, Grenoble, France) in fluorescence mode using a 30-element solid-state Ge detector (Canberra) for the least concentrated samples ([Zn] < 10000 mg kg-1). The spectra presented are the sum of 2 to 4 scans of about 40 min each, depending on Zn concentration.
µSXRF and µEXAFS measurements were performed on beamline 10.3.2 at the Advanced Light Source (ALS, Berkeley, USA), operating at 1.9 GeV and 200-400 mA. Particles from the H50-200 µm and 500-2000 µm fractions were embedded in epoxy resin and prepared as 30-µm-thick thin sections. The thin sections were mounted on a x-y
translation stage, the incident beam intensity (I0) was measured using an ionization chamber
and the fluorescence yield using a seven-element Ge solid-state detector. For µSXRF measurements, the incident beam energy was 9.7 KeV, the beam size and pixel size were 10 µm (H) × 5 µm (V), and the dwell time was 100 ms pixel-1
. The fluorescence yield was normalized by I0 and the dwell time. µEXAFS spectra were recorded on selected regions of
the samples, on the basis on elemental associations obtained from µSXRF maps. For
µEXAFS measurements, the spot size was 15µm (H) × 5 µm (V). The spectra presented are the sum of 2 to 12 scans of about 40 min each, depending on Zn concentration in the region probed.
EXAFS data analysis
Powder EXAFS and µEXAFS spectra were normalized following standard methods. Data analysis was performed by combining principal component analysis (PCA) with linear combination fits (LCFs). The PCA and the LCF procedures used here were described previously (17,21,30). For this approach, an extensive library of Zn model compounds was used (see the Results & Discussion Section). Zn citrate was purchased from Alfa. The preparation of Zn malate and Zn-sorbed ferrihydrite (5 Fe2O3 · 0.9 H2O) (ZnFh) containing
1500 mg kg-1 Zn were described previously (16,30). Zn-sorbed apatite was prepared under Ar atmosphere by slowly adding a Zn nitrate solution at pH 5 to a synthetic apatite suspension (Ca5(PO4)3(OH)2, purchased in Brenntag, Germany), the pH being maintained at 5.0. After
solid phase was 1% weight. Zn phytate spectrum was provided by J. Cotter-Howells (University of Aberdeen, Scotland).
Results and discussion
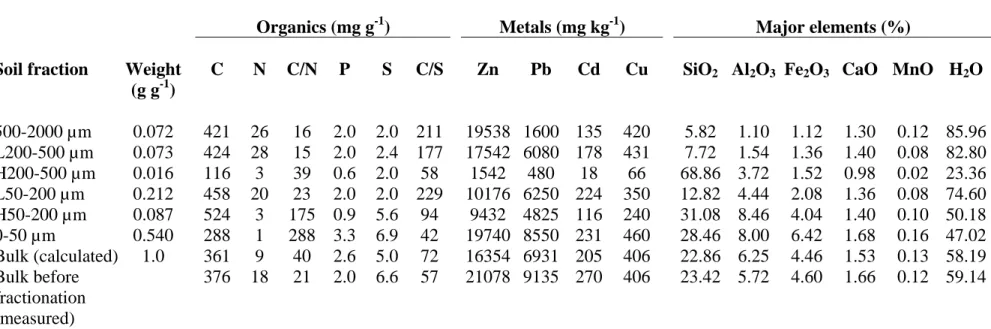
The soil material is characterized by a high content of organic carbon (~ 38%, Table 1). This organic matter is mostly present in the coarse fraction (half of it was found in the > 50 µm fraction), indicating a low degree of degradation. The H fractions account for about 10% of the soil and contain quartz sand, primary minerals and a black carbonaceous material,
probably coal used by the smelter. Analysis of this coal showed a high C/N ratio (150), and a low C/S ratio (15 to 20). The C/N ratio higher than 20 and the C/S ratio lower than 100 for the 0-50 µm, H50-200, and H200-500 µm fractions denote the presence of coal. The fact that the 0-50 µm fraction has a higher C/N value (288) than the coal (150) probably arises from an underestimation of N content in this sample (1 mg g-1). The P content of the soil (2000 mg kg
-1
) is relatively high compared to typical values reported for soils under temperate climate (between 100 and 3000 mg kg-1 (31)). The high P content suggests that this soil has been used for agriculture in the past.
Zn concentrations are high in all fractions (between 9432 and 19740 mg kg-1) except in the H200-500 µm fraction (1542 mg kg-1). The soil also contains significant amounts of Pb, Cd and Cu. Metal concentrations calculated from the weight and analysis of the fractions are lower than those measured on the soil before fractionation, which indicates that metals were partly leached out during the fractionation process. Some Zn-bearing minerals were detected by XRD (Fig. 1, Table 2). Franklinite (ZnFe2O4) and sphalerite (ZnS) were identified in all
fractions but H200-500 µm, which is mostly composed of quartz and contains only ~ 1540 mg kg-1 Zn. Willemite (Zn2SiO4) was detected in the H50-200 µm and 0-50 µm fractions.
Sphalerite probably originates from the Zn ore used in the smelter, whereas franklinite, willemite, as well as mullite (Al6Si2O13) are high temperature minerals probably formed
during the smelting process.
The µSXRF elemental maps for particles of the 500-2000 µm fraction (Fig. 2) suggest two major Zn pools. The first pool is composed of diffuse and rather homogeneous Zn areas, in which Zn is probably associated with organic matter. In the Figure 2B, Zn distribution shows a fibrous appearance which may correspond to cell walls of the partially decomposed plant tissue. The second pool consists of Zn-concentrated spots, which occasionally contain also Fe, Mn, Cu or Cr (last two not shown). In the H50-200 µm fraction, Zn is also present in a variety of elemental associations (Fig. 3). Based on the nature of Zn minerals identified by XRD, the bright green particles (i.e., where Zn is predominant) can be tentatively attributed to sphalerite or willemite, and the mixed green and red particles (i.e., containing Zn and Fe) to franklinite.
On the basis of these elemental distributions and associations, spots were selected and their µEXAFS spectra recorded. Bulk EXAFS spectra of the various fractions were recorded as well. The whole set of spectra and Fourier transforms are shown in Figure 4. The top spectra, with a high amplitude and clear multiple-shell contributions, are typical of mineral structure, whereas the bottom spectra suggest an organic environment for Zn. PCA was applied to the whole data set in order to evaluate the number of individual Zn species and to identify them. The output parameters, including the eigenvalues, the indicator values (IND), and the total normalized sum-squares residuals (Total NSS) for the first eight components are given in Table 3, and the component spectra are shown in Figure 5. IND is supposed to be minimum when the number of principal components is reached (32). In this study, IND was
minimum with five components (Table 3). However, Figure 5 shows that the fifth component contains very little signal, but essentially noise. Moreover, the whole set of experimental spectra was reconstructed correctly with four components, and the quality of the
reconstruction, evaluated by Total NSS values and by visual inspection, did not improve significantly with five components (Table 3). Therefore, the system can be described with four independent components only. Then, the nature of Zn species was determined by target transformation (32) using an extensive library of mineral and organic Zn compounds,
including Zn primary minerals, Zn phosphates, Zn carbonates, Zn sorbed on various minerals at different surface loadings and pH conditions as inner- and outer-sphere surface complexes, Zn complexed to organic acids, amino-acids, humic and fulvic acids, fungi cell walls, and aqueous Zn (30,33,34 and references therein). The quality of the transformation was evaluated by the normalized sum-squares (NSS) residual (Fig. 6). Franklinite, sphalerite, willemite, and Zn-sorbed ferrihydrite (ZnFh) were positively identified by this analysis (Fig.6A). The reconstruction of the franklinite spectrum is not excellent because this species is never abundant in any sample, as shown below. An organic and a mineral form of Zn phosphate (Zn phytate, myo-inositol kis-hexaphosphate, and Zn-sorbed apatite, respectively) yielded satisfactory fits too. Other Zn phosphates, including hopeite, parahopeite and Zn phosphate dihydrate, gave poor reconstructions (Fig. 6B). A number of Zn species previously identified or inferred in soils and sediments, including Zn phyllosilicate (8,16,17,19,22,34), Zn hydrotalcite (19), Zn-sorbed birnessite (16,34), and outer-sphere Zn (8,19) (tested using aqueous Zn), also resulted in poor reconstructions, which indicates that these species are not present in significant amount in our soil. Of the Zn organic compounds tested, the EXAFS spectra for a Zn-humic acid complex and for two Zn organic acid complexes, Zn malate and Zn citrate, were satisfactorily reproduced, but not those from Zn complexed to other organic
acids (acetate, benzoate, formate, lactate, malonate, oxalate and salicylate), nor to amino acids (aspartate, cysteine, glycine and histidine), as illustrated in Fig. 6B with oxalate and cysteine.
The identification by EXAFS of the three primary minerals (franklinite, sphalerite and willemite) is consistent with XRD results. Zn-sorbed iron oxyhydroxides, mimicked by ZnFh in this study, have been found in similar environmental contexts, and probably result from the oxidation of sphalerite and pyrite (15,17). Since the spectra of the two phosphates look similar (Fig. 6A), it is impossible to differentiate them conclusively. The generic term "Zn
phosphate" is used thereafter for this pool. The inferred occurrence of Zn malate and Zn citrate was tested by measuring the two organic acids by ionic chromatography. The analysis was negative, so it is concluded that the two references species account for the general class of Zn complexed to various carboxyl and hydroxyl (alcohol and phenol) functional groups contained in overwhelming amount in the soil organic matter (620 to 660 cmole of total acidity per kg of humic acids in temperate neutral soils (35)). This pool, which was also fingerprinted by the Zn-humic acid reference, is referred to as "Zn-organic acids" below.
The Zn species identified by target transformation include franklinite, sphalerite, willemite, Zn-sorbed ferrihydrite, Zn phosphate and Zn-organic acids. Their number is higher than the number of principal components (4) determined by PCA. A possible reason for this disagreement could be the occurrence of "background species", whose fractional amounts in all soil samples and spots analyzed are about constant (21). Results reported below show that this could be the case for Zn-sorbed ferrihydrite, whose proportion varies from 0 to 13 %, only. Another possible explanation for this disagreement is the fact that some EXAFS spectra, for instance, Zn phosphate, Zn-sorbed ferrihydrite and Zn-organic acids, have similar features and, consequently, they are not truly independent vectors. A difference between the number
of principal components and metal species was reported previously (8,17,21). The next step of the analysis was the determination by LCF of the proportion of each Zn species or group of species in the various bulk samples and spots analyzed. Each experimental spectrum was least-squares simulated by a combination of one up to six spectra from the six Zn species previously identified. A new component species was considered to be significantly present if the NSS value decreased by at least 10%. Franklinite and sphalerite were identified in all the soil fractions (Table 3). Willemite was found in some spots of the thin sections, but not in the soil fractions. The sensitivity of EXAFS is high for franklinite and sphalerite because their spectra have a high amplitude and multiple frequencies due to the presence of well ordered coordination shells. For franklinite, the sharp oscillation at about 6 Å-1 (Fig. 5) is a good indicator for this species, as the occurrence of a small proportion of this mineral (down to 5%) modifies the profile of the second oscillation, which becomes sharp-pointed (arrows in Fig. 4). The sensitivity to species in which the Zn local environment is disordered and/or
composed of light elements, such as ZnFh, Zn phosphate and Zn bound to organics, is clearly poorer (estimated at 10 to 20% of total Zn depending on the particular species).
The EXAFS spectrum for the bulk soil before fractionation was simulated with a combination of ~ 65% organic Zn, ~ 15% primary species (franklinite and sphalerite), ~ 10% Zn-sorbed phosphate and ~ 10% Zn-sorbed iron oxyhydroxides. Although outer-sphere Zn complexes were dismissed using aqueous Zn2+ as a model for this pool, their presence cannot be ruled out. The leaching of Zn during wet sieving supports this hypothesis. In a study of an acidic organic topsoil impacted by a Zn smelter (pH 3.2), Scheinost et al. (8) reported 14% of outer-sphere Zn in the untreated soil, whereas this species was absent in the residue after extraction with 1M ammonium nitrate. In another study on a Zn-contaminated soil (pH 5.5), Juillot et al. (19) found that 12% of Zn was CaCl2-exchangeable, and concluded from EXAFS
comparison of Zn contained in the bulk soil before fractionation and the weighted sum of Zn in the size fractions shows that ~ 20% of Zn was leached during size fractionation (Table 1). Thus, the proportion of loosely bound outer-sphere Zn may account for at least 20% of total Zn. Since Zn organic complexes and hydrated Zn have relatively similar EXAFS spectra, the pool of outer-sphere Zn was likely overlooked and included to the Zn organic pool. This hypothesis was tested by replacing the 65% organic Zn component by 45% organic Zn + 20% Zn2+ in the simulation of the bulk soil spectrum. The fit quality was poorer, but still
satisfactory (NSS = 6.9% vs. 4.1% using 65% Zn-organic acids). Consequently, the Zn species distribution in the bulk soil is more likely ~ 45% Zn-organic acid complexes, ~ 20% outer-sphere Zn, ~ 15% franklinite and sphalerite, ~ 10% sorbed phosphate and ~ 10% Zn-sorbed iron oxyhydroxides. The amount of Zn phosphate (10% of total Zn, i.e., 3.5 10-2 mol Zn per kg of soil) is in the same range as the measured organic P concentration (0.2% P, i.e., 3.2 10-2 mol P2O5 per kg of soil).
The comparison of the elemental associations found by µSXRF and of the chemical forms of Zn obtained by EXAFS shows that sphalerite and willemite are present in spots containing large amounts of Zn but small amounts of other metals, and that franklinite is present in regions wherever there is Zn and Fe, and in some cases Cu and Cr. In the regions containing both Mn and Zn, Zn sorbed on Mn(III,IV) oxides, such as birnessite, was expected but not encountered. The diffuse Zn matrix, which represents the major pool of Zn, consists of organic Zn with a minor proportion of Zn phosphate and Zn-sorbed ferrihydrite.
The humus horizon is composed of litter of hyperaccumulating plants (A. halleri and V. calaminaria), moss and poplar (5). A. halleri, the most abundant species, is known to store
trichomes (36,37). An EXAFS study showed that Zn is predominantly octahedrally
coordinated and complexed to malate in the plant shoots, whereas it is distributed between Zn malate, Zn citrate and Zn phosphate forms in the roots (30). The absence of Zn malate and Zn citrate in the soil suggests that these complexes are dissociated during the biodegradation of the plants. A study on the hyperaccumulator Thlaspi caerulescens showed that metals present in leaves are highly labile once the leaves are incorporated into the soil (38). This lability is consistent with the sequestration of Zn in vacuoles, since the cytoplasmic and vacuolar contents are released when the plant tissues are degraded. The Zn phosphate pool may
originate from the decay of roots, and also from chemical precipitation of dissolved Zn and P.
The proportion of labile Zn (%E) was determined by isotopic dilution in three size fractions of the soil (Table 5). %E values range between 53.7 ± 0.3% and 92.0 ± 1.2%, and the distribution coefficients of 65Zn (*Kd) range between 313 ± 20 and 450 ± 20 L kg-1 (Log
*Kd between 2.49 and 2.65). For comparison, Degryse et al. (25) measured %E in 47 polluted
soils from Europe, and reported values between 5 and 68%, with a median %E value of 26%. Sauvé et al. (39) reported an average Log Kd (Kd = ratio between total and dissolved metal) of
2.87 ± 0.4 at pH 6.2 in contaminated and uncontaminated soils. The *Kd values determined in
this study can be approximated to Kd since the concentration of 65Zn in the solution is
negligible compared to its concentration in the solid phase. The high %E values and low *Kd
values of this soil compared to average soils indicate that Zn is highly labile. Zn present in primary minerals is clearly not labile. Zn bound to iron oxyhydroxides, phosphates and organic matter likely occupies a range of low to high affinity sites, and can be considered as partly labile. The stock of ZnFh and Zn phosphate (2 to 13% of total Zn depending on the sample, as estimated from EXAFS data) cannot explain alone the high %E values (54 to 92% of exchangeable Zn), whereas the percentage of organic Zn is in good agreement with %E
values, with an error bar of about 10% only (58 to 85% depending on the sample, Table 5). Thus, both methods agree on the dominance of Zn bound to soil organic matter in a
predominantly labile form. Despite this high lability, Zn does not seem to be very mobile in the field at the scale of the soil profile. Indeed, the total concentration of Zn remains
extremely high in the topsoil, despite the reduction of Zn emission by the smelter in recent years, and is an order of magnitude lower in the underlying mineral horizon. The persistence of Zn in the topsoil can be explained by the overwhelming amount of organic matter
conferring to the soil a high sorption capacity. This sorption capacity is thought to increase with time since the biomass production is not balanced by the biodegradation of plant debris. Hyperaccumulating plants may also favor the upwards movement of zinc, but this transfer is probably marginal because these plants have a small biomass.
The speciation of Zn found in this holorganic soil horizon is compared in Table 6 to previous data reported in the literature on various types of soils. Outer-sphere and organic Zn species have been suggested to amount ~ 50-60% in an organic acidic soil (pH 5.5) (19), and otherwise are present in subordinate amount in soils dominated by mineral constituents. In these soils, a varieties of Zn-sorbed and Zn-substituted secondary species were identified, including phyllosilicates, iron oxyhydroxides, manganese oxides, lithiophorite, hydrotalcite and phosphate (8,16,18,19,22). On the basis of these results, Zn-organic complexes seem to prevail in highly organic soils at moderately acidic pH.
In summary, EXAFS spectroscopy and isotopic dilution both indicate that Zn is quite labile and mainly associated with soil organic matter in this organic-rich soil. The fact that simple organic acids were not detected in our soil, despite their presence in living plants, suggests that the bioaccumulated Zn fraction is complexed to soil organic matter after the
plants' death. Thus, the persistence of Zn in the topsoil can be explained by the interdependent relationship between the soil organic matter, whose biodegradation is slowed down by the high metal concentration, and Zn, which is maintained in the topsoil thanks to the
overwhelming amount of soil organic matter.
Acknowledgements
We acknowledge J. L. Hazemann and O. Proux for assistance during EXAFS measurements, and the ALS, the ESRF and the LURE for the provision of beamtime. The authors thank the three anonymous reviewers for scientific advice. This research was supported by the CNRS “Programme Environnement, Vie et Société” (grant no. 00N55).
LITERATURE
(1) Kabata-Pendias, A.; Pendias, H. Trace Elements in Soils and Plants, 3rd Edition Boca Raton, Florida, 2001.
(2) Godin, P.; Feinberg, M.; Ducauze, M. Environ. Pollut. 1985, 10, 97-114.
(3) Sterckeman, T.; Douay, F.; Proix, N.; Fourrier, H. Environ. Pollut. 2000, 107, 377-389.
(4) Sterckeman, T.; Douay, F.; Proix, N.; Fourrier, H.; Perdrix, E. Water, Air and Soil Poll. 2002, 135, 173-194.
(5) Gillet, S.; Ponge, J. F. Eur. J. Soil Sci. 2002, 53, 529-539.
(6) Coughtrey, P.; Jones, C.; Martin, M.; Shales, S. Oecologia 1979, 39, 51-60.
(7) Balabane, M.; Faivre, D.; Van-Oort, F.; Dahmani-Muller, H. Environ. Pollut. 1999, 105, 45-54.
(8) Scheinost, A.; Kretzschmar, R.; Pfister, S. Environ. Sci. Technol. 2002, 36, 5021-5028.
(9) Boyd, R. S. In Plants that Hyperaccumulate Heavy Metals; Brooks, R. R., Ed.; CAB International: New York, 1998; pp 181-201.
(10) Boyd, R. S.; Jaffré, T. South African J. Sci. 2001, 97.
(11) Vazquez, M. D.; Barcelo, J.; Poschenrieder, C.; Madico, J.; Hatton, P.; Baker, A. J. M.; Cope, G. H. J. Plant Physiol. 1992, 140, 350-355.
(12) Neumann, D.; zur-Nieden, U. Phytochemistry 2001, 56, 685-692.
(13) Frey, B.; Keller, C.; Zierold, K.; Schulin, R. Plant Cell Environ. 2000, 23, 675-687. (14) Hall, J. J. Exp. Bot. 2002, 53, 1-11.
(15) O'Day, P.; Carrol, S. A.; Waychunas, G. A. Environ. Sci. Technol. 1998, 32, 943-955. (16) Manceau, A.; Lanson, B.; Schlegel, M. L.; Hargé, J. C.; Musso, M.; Eybert-Bérard, L.;
Hazemann, J. L.; Chateigner, D.; Lamble, G. M. Am. J. Sci. 2000, 300, 289-343. (17) Isaure, M. P.; Laboudigue, A.; Manceau, A.; Sarret, G.; Tiffreau, C.; Trocellier, P.;
Lamble, G.; Hazemann, J. L.; Chateigner, D. Geochim. Cosmochim. Acta 2002, 66, 1549-1567.
(18) Roberts, D.; Scheinost, A.; Sparks, D. Environ. Sci. Technol. 2002, 36, 1742-1750. (19) Juillot, F.; Morin, G.; Ildefonse, P.; Trainor, T.; Benedetti, M.; Galoisy, L.; Calas, G.;
Brown, G. Am. Miner. 2003, 88, 509-526.
(20) Isaure, M. P.; Laboudigue, A.; Manceau, A.; Sarret, G.; Tiffreau, C.; Trocellier, P. Nucl. Instr. Meth. Phys. Res. B 2001, 181, 598-602.
(21) Manceau, A.; Marcus, M. A.; Tamura, N. In Applications of Synchrotron Radiation in Low-Temperature Geochemistry and Environmental Science; Fenter, P., Rivers, M.,
Sturchio, N., Sutton, S., Eds.; Reviews in Mineralogy and Geochemistry,
(22) Manceau, A.; Marcus, M.; Tamura, N.; Proux, O.; Geoffroy, N.; Lanson, B. Geochim. Cosmochim. Acta 2004, in press.
(23) Wasserman, S. R. J. Phys. IV 1997, 7, 203-205.
(24) Ressler, T.; Wong, J.; Roos, J.; Smith, I. L. Environ. Sci. Technol. 2000, 34, 950-958. (25) Degryse, F.; Broos, K.; Smolders, E.; Merckx, R. Eur. J. Soil Sci. 2003, 54, 149-157. (26) Nakhone, L.; Young, S. Environ. Pollut. 1993, 82, 73-77.
(27) Smolders, E.; Brans, K.; Foldi, A.; Merckx, R. Soil Sci. Soc. Am. J. 1999, 63, 78-85. (28) Sinaj, S.; Machler, F.; Frossard, E. Soil Sci. Soc. Am. J. 1999, 63, 1618-1625. (29) Balesdent, J.; Pétraud, J. P.; Feller, C. Sci. Sol 1991, 29, 95–106.
(30) Sarret, G.; Saumitou-Laprade, P.; Bert, V.; Proux, O.; Hazemann, J. L.; Traverse, A.; Marcus, M. A. M.; Manceau, A. Plant Physiol. 2002, 130, 1815-1826.
(31) Frossard, E.; Condron, L. M.; Oberson, A.; Sinaj, S.; Fardeau, J. C. J. Environ. Qual.
2000, 29, 15-23.
(32) Malinowski, E. R. Factor Analysis in Chemistry; Wiley: New York, USA, 1991. (33) Sarret, G.; Manceau, A.; Hazemann, J. L.; Gomez, A.; Mench, M. J. Phys. IV 1997, 7,
799-802.
(34) Manceau, A.; Tamura, N.; Celestre, R.; MacDowell, A.; Geoffroy, N.; Sposito, G.; Padmore, H. Environ. Sci. Technol. 2003, 37, 75-80.
(35) Stevenson, F. J. Humus Chemistry, Second Edition; Wiley: New York, 1994. (36) Kupper, H.; Lombi, E.; Zhao, F. J.; McGrath, S. P. Planta 2000, 212, 75-84.
(37) Zhao, F.; Lombi, E.; Breedon, T.; McGrath, S. Plant Cell Environ. 2000, 23, 507-514. (38) Perronnet, K.; Schwartz, C.; Gerard, E.; Morel, J. L. Plant and Soil 2000, 227,
257-263.
TABLE 1. Elemental Concentrations of the Soil Fractions
Organics (mg g-1) Metals (mg kg-1) Major elements (%)
Soil fraction Weight (g g-1)
C N C/N P S C/S Zn Pb Cd Cu SiO2 Al2O3 Fe2O3 CaO MnO H2O 500-2000 µm 0.072 421 26 16 2.0 2.0 211 19538 1600 135 420 5.82 1.10 1.12 1.30 0.12 85.96 L200-500 µm 0.073 424 28 15 2.0 2.4 177 17542 6080 178 431 7.72 1.54 1.36 1.40 0.08 82.80 H200-500 µm 0.016 116 3 39 0.6 2.0 58 1542 480 18 66 68.86 3.72 1.52 0.98 0.02 23.36 L50-200 µm 0.212 458 20 23 2.0 2.0 229 10176 6250 224 350 12.82 4.44 2.08 1.36 0.08 74.60 H50-200 µm 0.087 524 3 175 0.9 5.6 94 9432 4825 116 240 31.08 8.46 4.04 1.40 0.10 50.18 0-50 µm 0.540 288 1 288 3.3 6.9 42 19740 8550 231 460 28.46 8.00 6.42 1.68 0.16 47.02 Bulk (calculated) 1.0 361 9 40 2.6 5.0 72 16354 6931 205 406 22.86 6.25 4.46 1.53 0.13 58.19 Bulk before fractionation (measured) 376 18 21 2.0 6.6 57 21078 9135 270 406 23.42 5.72 4.60 1.66 0.12 59.14
Concentrations in C, N, P and S were determined with an elemental analyzer. Concentrations in metals and major elements were determined by digesting the soil samples in aqua regia and analyzing the solutions by inductively coupled plasma - atomic emission spectrometry (ICP-AES).
TABLE 2. Minerals Identified by XRD
Soil fraction Quartz SiO2 Franklinite ZnFe2O4 Sphalerite ZnS Willemite Zn2SiO4 Anorthite CaAl2Si2O8 Mullite Al6Si2O13 500-2000 µm + + + L200-500 µm + + + H200-500 µm + + + L50-200 µm + + + H50-200 µm + + + + + + 0-50 µm + + + + + + Bulk soil + + + +
TABLE 3: Output Parameters of the Principal Component Analysis
Component Eigenvalue INDa Total NSSb
(%) 1 133.0 3.55 10-2 18.6 2 47.0 2.72 10-2 8.34 3 29.9 2.23 10-2 4.32 4 15.9 2.20 10-2 3.16 5 15.1 2.09 10-2 2.11 6 10.7 2.13 10-2 1.58 7 9.35 2.18 10-2 1.18 8 7.32 2.34 10-2 9.34 a Indicator value (32), b
[
]
[
]
100 / 3 exp. 2 2 . 3 . exp 3χ − χ χ ⋅ =∑ ∑
∑ ∑
spectra i spectra i reconst k k k NSS TotalTABLE 4. Proportions (in% mole fraction) of Zn Species Determined by LCF
Sample Franklinite Sphalerite Willemite Zn Fh Zn phosphate Zn- org. acids Sum NSSa (%) Soil fractions (powder EXAFS)
Bulk soil 9 b 4 b 0 10 11 64 98 4.1 500-2000 5 b 4 b 0 0 0 90 99 3.7 L200-500 µm 5 b 3 b 0 0 0 89 97 2.2 H200-500 µm 8 20 0 0 11 69 108 11.6 L50-200 µm 5 b 3 b 0 0 0 89 97 3.1 H50-200 µm 10 b 6 b 0 b 10 10 56 92 8.6 0-50 µm 13 b 6 b 0 b 13 0 58 90 8.3 Microanalyses (µEXAFS) 500-2000 µm Spot A 21 0 0 0 59 17 97 9.8 Spot B 0 0 11 0 47 49 107 3.2 Spot C 3 0 0 0 39 61 103 5.9 Spot D 0 114 0 0 0 0 114 9.4 Spot E 9 8 18 0 21 53 109 8.0 Spot F 0 0 0 12 25 67 104 2.0 Spot G 0 0 0 11 41 54 106 2.1 Spot H 0 0 0 12 20 65 97 16.8 Spot I 0 0 0 10 41 51 102 3.8 Spot J 0 0 69 0 17 10 96 4.6 H50-200 µm Spot A 0 0 47 0 0 0 47 c 5.8 Spot B 0 0 0 11 15 79 105 7.2 Spot C 6 0 12 10 54 0 82 6.3 Spot D 16 3 0 0 11 66 96 15.0 Spot E 0 0 16 0 37 56 109 7.8 a
Residual between fit and experimental data
[
] [
/ exp.]
2 1003 2 . 3 . exp 3χ − χ χ ⋅ =
∑
∑
i i reconst k k k NSS . b Indicatesthat the mineral was identified by XRD in this sample. c This low percentage is probably due to over-absorption. The precision is estimated to ± 3% of total Zn for franklinite and sphalerite, and to ± 10 to 20% (depending on the amplitude and shape of the reference spectra used) for other Zn species.
TABLE 5. Comparison of EXAFS and Isotopic Dilution Results
Zn pools determined by EXAFS (%)a Isotopic dilution parameters Soil fraction Zn primary minerals Zn Fh Zn phosphate Zn- organic acids Kd (L kg-1) E (g kg-1) %E (%) 0-50 µm 19 13 0 58 313 (20) 10.6 (0.0) 53.7 (0.3) 50-200 µm 10 3 3 79 385 (12) 13.8 (0.6) 77.4 (3.4) 200-500 µm 12 0 2 85 450 (20) 17.4 (0.2) 92.0 (1.2) a
Zn primary minerals is the sum of franklinite, sphalerite and willemite. Percentages in the fractions 200-500 µm and 50-200 µm were calculated from the percentage in the H and L fractions (Table 4) and from the weight of each fraction (Table 1).
TABLE 6: Soil characteristics and nature and proportion of Zn species identified by EXAFS spectroscopy Type of soil pH TOC
g/kg Zn mg/kg Fe g/kg Mn g/kg
Zn species, by decreasing order of abundance ref High organic content
Organic soil, made of partially decomposed plant residuesa 3.2 320 6200 33 1.5 ~ 60% franklinite ~ 30% sphalerite ~ 10% aqueous or outer-sphere Zn (8) Organic soil, made of partially decomposed plant residuesa 3.2 - 6200 - - ~ 60-70% franklinite ~ 30-40% sphalerite
Zn adsorbed to Fe and Mn oxyhydroxides as inner-sphere complexes (18) Wooded pseudogley brown leached soil (luvisol redoxisol)
5.5 640 1380 12.8 0.4 ~ 50-60% outer-sphere and/or inner-sphere complexes on organic
matter or goethite Zn-Al hydrotalcite Zn in dioctahedral phyllosilicate (< 25%) (19) Organic soil, made of partially decomposed plant residues
6.2 376 21078 32.2 0.9 ~ 45% Zn bound to organic matter
~ 20% outer-sphere Zn
~ 15% primary species (franklinite and sphalerite) ~ 10% Zn phosphate
~ 10% Zn sorbed on Fe oxyhydroxides
this study
Skeletal silty loamb
3.9 50 3700 25 0.5 ~ 55% outer-sphere Zn
~ 45% Zn in hydroxy-Al interlayers of phyllosilicate
(8)
Stony loamb 3.9 - 890 - - Zn bound to Al groups
Zn sorbed on Fe oxyhydroxides
outer-sphere Zn or organic matter-bound Zn species
(18) Acid sandy soil (Maatheide)c - - 59220 - - Zn-substituted phyllosilicate hemimorphite willemite Zn-sorbed birnessite (16) Sandy horizon (Mortagne) d 6.5-7.5 - 353-1405 12.0-23.9 0.2-0.5 Zn-substituted phyllosilicate Zn-sorbed birnessite Zn sorbed on Fe oxyhydroxides (16) Tilled soil (Evin-Malmaison) e 5.6-6.7 - 2318 - - Zn-substituted phyllosilicate Zn sorbed on Fe oxyhydroxides (16) Tilled pseudogley brown leached soil (luvisol redoxisol) 7.5 150 571 10.5 0.4 Zn-Al hydrotalcite
Zn in the dioctahedral sheet of phyllosilicate (< 35%)
~ 25% outer-sphere and/or inner-sphere complexes on organic matter or goethite (19) Fragipan (Btx) horizon 4.5-5.0
- 128 92.3 13.1 ~ 80-90% Zn in the octahedral sheet and in hydroxy-Al
interlayers of phyllosilicate
~ 10-20% sphalerite, zincochromite, lithiophorite, Zn-sorbed ferrihydrite, and Zn-phosphate
(22)
a, b
Figure captions
FIGURE 1. XRD pattern for the bulk soil (A) and the < 50 µm fraction (B). Minerals
identified are quartz (Q), franklinite (Fr), willemite (W), sphalerite (S), and anorthite (A).
FIGURE 2. µSXRF elemental maps for organic fragments of the 500-2000 µm fraction.
Ratio of maximal counts: 11 for Zn Kα/Fe Kβ and 34 for Zn Kα/ Mn Kα (A), 7 for Zn Kα/Fe
Kβ and 6 for Zn Kα/ Mn Kα (B).
FIGURE 3. µSXRF elemental map for the fraction H50-200 µm. Ratio of maximal counts:
10 for Zn Kα/Fe Kβ and 11 for Zn Kα/ Mn Kα. Spot E was found in another region of the thin
section (not shown).
FIGURE 4. Zn K-edge EXAFS spectra and radial distribution functions (RDFs) for the soil
samples. CF (coarse fraction): 500-2000 µm fraction, HF (heavy fraction) : H50-200 µm fraction. The sharp-pointed oscillations indicated by the arrows are due to franklinite.
FIGURE 5. First (C1) to eighth (C8) component determined by principal component analysis
of the whole set of EXAFS spectra shown in Fig. 4.
FIGURE 6. Zn K-edge EXAFS spectra (plain lines) and successful (A) and unsuccessful (B)
target reconstructions (dotted lines) for reference compounds. The quality of the reconstruction is evaluated by the normalized sum-squares residuals
, indicated in parentheses. The bottom spectrum in Fig. 6A shows the linear combination fit (dashed line) for the bulk soil (the