Urban soil quality assessment - A comprehensive
case study dataset of urban garden soils
1
SUPPLEMENTARY TABLES AND FIGURES
1.1
Figures
0km
1km
2km
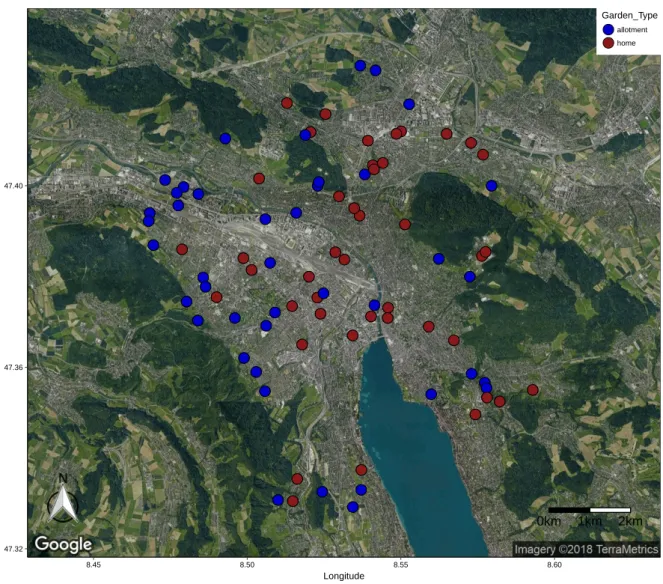
47.32 47.36 47.40 8.45 8.50 8.55 8.60 Longitude Latitude Garden_Type allotment homeFigure S1: Spatial map of selected urban garden sites (N=85) within the city of Zurich, Switzerland. In
total, 42 allotment gardens (blue) and 43 home gardens (red) were analyzed.
1.2
Tables
Table S1. Urban garden sites measured in the city of Zurich, Switzerland. In total 85 urban gardens were selected, 42 allotment and 43 home gardens according to a systematic nested design of garden management intensity and degree of urbanization, for more information seeFrey et al.(2018). Within each urban garden two distinct measurement plots (2 m x 2 m) were selected, corresponding to a typical garden habitat type (Tresch et al.,2018).
garden types
garden habitat types
allotment
home
total sites
lawn
29
42
71
flowers & berries
19
33
52
vegetables
36
11
47
total sites
84
86
170
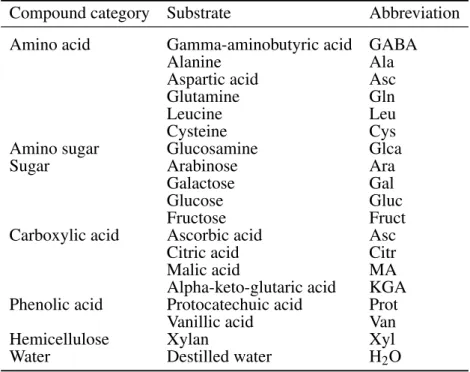
Table S2. 19 substrates used for the assessment of the Community level physiological profile (CLPP) based on the MicroResp™ technique (Campbell et al.,
2003). We dissolved 18 substrates in H2Odeminand added 25 µl aliquots to deliver 30 mg of C-substrate per g of soil water for each well. Each substrate was
measured in five technical replicates. The absorbance of the detection plate is measured at 570 nm after 5 hours of incubation at 20°C in the dark. The detection plate contains a pH sensitive dye (Cresol Red) which is dissolved in a solution with 150 mM potassium chloride (KCl) and 2.5 mM sodium bicarbonate (NaHCO3) in a matrix of 1% agarose gel. For the calibration equations 44 samples from five different soils together with four different quantities (10g, 20g, 30g
and 40g) were amended with 0, 0.5, 2, 3, 5 and 10 mg of glucose or α-keto-glutaric acid per g soil. The substrates were dissolved in water so that 62.5 µl per g soil was added to each sample. Samples without substrates received the same amount of water. The calibration was obtained in 100ml Schott bottles containing 4 wells of breakable microstrips filled with the detection gel. These microstrips were measured immediately before and after the incubation on a plate reader (MRX II TC, Dynex, USA) at 570 nm. The bottles were sealed and CO2evolution was measured on a gas chromatograph (7890A, Agilent Technologies, USA).
The difference in absorbance between the first and the second measurement is then plotted against the log of CO2evolution measured by the gas chromatograph.
The linear fit between measured log(CO2) concentrations [µgCO2− Cg−1h−1] was y = −4.67 + 2.90 with an R2of 0.87.
Compound category
Substrate
Abbreviation
Amino acid
Gamma-aminobutyric acid
GABA
Alanine
Ala
Aspartic acid
Asc
Glutamine
Gln
Leucine
Leu
Cysteine
Cys
Amino sugar
Glucosamine
Glca
Sugar
Arabinose
Ara
Galactose
Gal
Glucose
Gluc
Fructose
Fruct
Carboxylic acid
Ascorbic acid
Asc
Citric acid
Citr
Malic acid
MA
Alpha-keto-glutaric acid
KGA
Phenolic acid
Protocatechuic acid
Prot
Vanillic acid
Van
Hemicellulose
Xylan
Xyl
Table S3. qCPR assays for fungal and bacterial gene copy numbers.
We extracted DNA from 135 mg of lyophilised soil using the FastDNA™-96 Soil Microbe DNA Kit (MP Bio). qPCR assays were conducted on a BioRad CFX™ Real-Time system with a C1000 Touch™ Thermal Cycler (BioRad Laboratories). qPCR assays were performed to estimate the gene copy number of bacterial 16S rDNA and fungal 18S rDNA. All reactions were performed in 15 µl volume containing 7.5 µl KAPA SYBR FAST universal qPCR Master Mix (2x) (KAPA Biosystems), 1.5 µl DNA sample. qPCR reactions for the estimation of the bacterial copy number contained 1.8 µl of each primer (BactQuant,Liu et al.(2012)) and 2.4 µ l H2O. qPCR reactions for the estimation of fungal copy number contained 0.75 µl of each primer (FR1/FF390,Vainio and Hantula
(2000)) and 4.5 µl H2O. The assays were run in duplicates with an appropriate standard dilution series containing the target region in triplicate. For the 16S
assay the PCR conditions were 3 minutes at 95°C followed by 40 cycles of 15 seconds at 95°C, 15 seconds at 62°C and 30 seconds at 72°C. For the 18S assay the PCR conditions were 3 minutes at 95°C followed by 36 cycles of 15 seconds at 95°C, 15 seconds at 50°C and 30 seconds at 72°C with a final elongation step of 10 minutes at 72°C. After each assay melting curve analysis was performed to make sure fluorescence signals originated from specific PCR products instead of primer dimers.
Table S4. Descriptive statistics of soil quality indicators in urban gardens of Zurich, Switzerland. Aggregated values per garden type can be found in Table S5 and by habitat types in Table S6, while the functions and R packages used for the data management can be found in the R-project folder in the Data Sheet 2. SE represents standard errors. Tea bag decomposition values were assessed according toKeuskamp et al.(2013).
N Mean±SE Median Min Max Variance Physical indicators BD [gcm−3] 170 1.08±0.01 1.08 0.57 1.45 0.03 Clay [%] 170 23.79±0.43 22.98 9.40 39.25 31 Penetration resistance [M P a] 168 1.42±0.04 1.36 0.36 3.28 0.3 PV [%] 170 40.86±0.56 41.27 1.47 54.96 54 SA [%] 170 82.22±0.83 85.57 46.64 95.69 118 Sand [%] 170 42.06±0.72 41.75 13.75 71.95 87 Silt [%] 170 34.15±0.4 34.15 18.65 49.15 28 WHC [%] 170 81.56±0.93 80.36 54.17 145.99 146 Chemical indicators B [mgkg−1] 170 1.37±0.05 1.29 0.14 3.88 0.5 Cu [mgkg−1] 170 32.30±2.28 23.67 3.04 209.10 885 EC [µScm−1] 170 184.41±3.12 181.95 82.20 354.00 1653 Fe [mgkg−1] 170 369.29±8.48 360.00 154.50 699.80 12214 K [mgkg−1] 170 165.82±9.63 122.14 43.91 831.34 15770 Mg [mgkg−1] 170 516.42±13.18 502.90 143.60 1125.00 29523 Mn [mgkg−1] 170 296.24±8.38 265.95 93.27 632.50 11936 P [mgkg−1] 170 189.60±9.31 171.38 5.19 465.19 14735 pH 170 7.27±0.02 7.30 6.25 7.75 0.06 Biological indicators
basal respiration [µgCO2− Cg−1h−1] 170 0.24±0.01 0.21 0.08 0.72 0.01
Cmic [mgkg−1] 170 808.27±20.92 787.59 279.91 1593.98 74383 Cmin [gCO2− Ckg−1] 170 0.15±0.01 0.13 0.06 0.46 0.01 DOC [mgkg−1] 170 158.21±4.55 144.98 62.33 435.56 3526 DON [mgkg−1] 170 40.00±1.28 36.50 17.23 113.34 279 Nmic [mgkg−1] 170 141.08±4.09 132.50 42.31 357.83 2841 Nmin [mgkg−1] 170 1.70±0.09 1.58 0.01 5.85 1 TOC [%] 170 4.65±0.12 4.43 1.63 9.89 2 TON [%] 170 0.33±0.01 0.31 0.10 0.82 0.01 bacterial 16S [gene copies] 164 6.8e+08±4.5e+07 5.0e+08 5.1e+07 3.3e+09 1.6e+17 fungal 18S [gene copies] 164 5.3e+06±3.5e+05 3.7e+06 6.0e+05 2.7e+07 2.1e+13
Metals As [mgkg−1] 168 9.40±0.26 9.60 0.50 27.70 11 Ba [mgkg−1] 168 385.35±11.52 344.50 201.80 1062.00 22569 Co [mgkg−1] 168 31.56±0.35 32.15 18.30 45.40 21 Cu.m [mgkg−1] 168 75.96±4.76 57.30 15.60 407.30 3852 Ni [mgkg−1] 168 39.55±0.69 38.65 20.30 80.10 82 Pb [mgkg−1] 168 172.33±13.37 106.60 18.50 1076.00 30391 Sb [mgkg−1] 168 1.81±0.32 0.70 0.40 39.10 17 V [mgkg−1] 168 79.78±1.13 77.75 44.10 117.90 217 Zn [mgkg−1] 168 268.77±13.83 215.80 58.90 999.90 32505 CLPP MicroResp Ala [µgCO2− Cg−1h−1] 170 3.78±0.08 3.77 0.77 6.32 1 Ara [µgCO2− Cg−1h−1] 170 4.21±0.09 4.30 1.21 6.33 1 Asc [µgCO2− Cg−1h−1] 170 9.25±0.11 9.64 1.98 11.30 2 Asp [µgCO2− Cg−1h−1] 170 3.95±0.08 3.98 1.37 7.02 1 Citr [µgCO2− Cg−1h−1] 170 10.45±0.13 11.06 3.18 12.08 3 Cys [µgCO2− Cg−1h−1] 170 2.56±0.08 2.40 0.62 5.67 1 Fruct [µgCO2− Cg−1h−1] 170 5.42±0.10 5.49 1.27 7.69 2 GABA [µgCO2− Cg−1h−1] 170 2.69±0.08 2.52 0.77 5.64 1 Gal [µgCO2− Cg−1h−1] 170 4.00±0.09 4.03 1.04 8.31 1 Glca [µgCO2− Cg−1h−1] 170 4.06±0.09 4.14 0.90 6.70 1 Gln [µgCO2− Cg−1h−1] 170 3.90±0.08 3.87 1.01 6.25 1 Gluc [µgCO2− Cg−1h−1] 170 5.67±0.09 5.72 1.72 8.06 1 H2O [µgCO2− Cg−1h−1] 170 2.06±0.08 1.78 0.61 7.32 1 KGA [µgCO2− Cg−1h−1] 170 10.71±0.11 11.22 3.23 12.19 2 Leu [µgCO2− Cg−1h−1] 170 2.63±0.08 2.53 0.68 5.89 1 MA [µgCO2− Cg−1h−1] 170 10.44±0.14 11.17 1.94 12.11 3 Prot [µgCO2− Cg−1h−1] 170 2.65±0.08 2.52 0.83 5.40 1 Van [µgCO2− Cg−1h−1] 170 2.63±0.08 2.52 0.96 8.26 1 Xyl [µgCO2− Cg−1h−1] 170 5.48±0.09 5.52 1.24 7.85 1
Tea bag decomposition
green tea [% decomposed] 161 0.59±0.01 0.58 0.49 0.75 0.01 rooibos tea [% decomposed] 161 0.29±0.01 0.30 0.20 0.39 0.01
Table S5. Descriptive statistics of soil quality indicators in urban gardens of Zurich, CH. Data is aggregated by garden type.
N
Mean±SE
Median
Min
Max
Variance
Physical indicators
Allotment
BD
[gcm
−3
]
84
1.1±0.02
1.12
0.57
1.42
0.1
Clay
[%]
84
24.31±0.63
24.60
9.40
38.50
33
penetration resistance
[M P a]
84
1.23±0.06
1.15
0.39
2.55
0.1
PV
[%]
84
41.05±0.95
42.56
1.47
54.12
76
SA
[%]
84
79.38±1.28
81.90
46.64
94.61
137
Sand
[%]
84
41.3±1.11
40.23
13.75
71.95
104
Silt
[%]
84
34.39±0.62
34.50
18.65
49.15
32
WHC
[%]
84
82.84±1.45
80.45
66.03
145.99
177
Home
BD
[gcm
−3
]
86
1.06±0.02
1.05
0.80
1.45
0.1
Clay
[%]
86
23.29±0.58
22.50
10.90
39.25
29
penetration resistance
[M P a]
84
1.62±0.06
1.69
0.36
3.28
0.1
PV
[%]
86
40.68±0.61
40.39
28.83
54.96
32
SA
[%]
86
84.99±1
88.52
56.83
95.69
86
Sand
[%]
86
42.81±0.91
43.15
19.30
65.85
71
Silt
[%]
86
33.91±0.52
33.90
20.75
47.90
24
WHC
[%]
86
80.31±1.15
79.93
54.17
105.26
114
Chemical indicators
Allotment
B
[mgkg
−1
]
84
1.59±0.07
1.51
0.19
3.88
0.1
Cu
[mgkg
−1
]
84
39.14±4.14
27.41
7.40
209.10
1438
EC
[µScm
−1
]
84
175.47±4.77
167.50
82.20
354.00
1914
Fe
[mgkg
−1
]
84
390.44±13.94
384.55
154.50
699.80
16335
K
[mgkg
−1
]
84
191.9±14.41
157.67
47.34
831.34
17447
Mg
[mgkg
−1
]
84
519.52±20.4
504.15
150.60
1125.00
34942
Mn
[mgkg
−1
]
84
297.32±14.56
262.65
93.27
632.50
17819
P
[mgkg
−1
]
84
229.92±12.92
214.66
21.35
460.44
14017
pH
84
7.2±0.03
7.25
6.45
7.56
0.1
Home
B
[mgkg
−1
]
86
1.16±0.07
0.96
0.14
3.71
0.1
Cu
[mgkg
−1
]
86
25.62±1.75
22.49
3.04
93.00
263
EC
[µScm
−1
]
86
193.15±3.83
190.25
120.50
331.00
1262
Fe
[mgkg
−1
]
86
348.64±9.31
348.85
190.10
583.00
7461
K
[mgkg
−1
]
86
140.36±12.29
104.19
43.91
748.42
12990
Mg
[mgkg
−1
]
86
513.39±16.9
500.70
143.60
1015.00
24560
Mn
[mgkg
−1
]
86
295.18±8.58
275.40
151.60
479.80
6330
P
[mgkg
−1
]
86
150.21±12.02
120.57
5.19
465.19
12435
pH
86
7.33±0.02
7.36
6.25
7.75
0.1
N
Mean±SE
Median
Min
Max
Variance
Biological indicators
Allotment
basal respiration
[µgCO
2− Cg
−1h
−1]
84
0.24±0.01
0.22
0.10
0.72
0.1
C
mic[mgkg
−1]
84
734.96±27.3
705.63
301.62
1548.41
62612
C
min[gCO
2− Ckg
−1]
84
0.16±0.01
0.15
0.07
0.46
0.1
DOC
[mgkg
−1]
84
164.81±7
149.67
79.63
435.56
4119
DON
[mgkg
−1]
84
39.6±1.84
35.23
19.62
109.55
285
N
mic[mgkg
−1]
84
125.55±5.38
119.67
44.70
357.83
2434
N
min[mgkg
−1]
84
1.77±0.14
1.55
0.00
5.56
2
TOC
[%]
84
4.85±0.19
4.42
1.82
9.89
3
TON
[%]
84
0.35±0.01
0.32
0.16
0.82
0.1
bacterial 16S
[gene copies]
81
6.3e+08±5.6e+07
5.0e+08
5.1e+07
2.5e+09
2.6e+17
fungal 18S
[gene copies]
80
5.5e+06± 4.4e+05
4.3e+06
7.0e+05
2.0e+07
1.7e+13
Home
basal respiration
[µgCO
2− Cg
−1h
−1]
86
0.23±0.01
0.20
0.08
0.69
0.1
C
mic[mgkg
−1]
86
879.88±29.78
835.92
279.91
1593.98
76252
C
min[gCO
2− Ckg
−1]
86
0.14±0.01
0.12
0.06
0.42
0.1
DOC
[mgkg
−1]
86
151.77±5.81
136.58
62.33
336.93
2903
DON
[mgkg
−1]
86
40.39±1.79
38.57
17.23
113.34
276
N
mic[mgkg
−1]
86
156.25±5.71
153.82
42.31
305.35
2800
N
min[mgkg
−1]
86
1.64±0.11
1.65
0.00
5.85
1
TOC
[%]
86
4.45±0.15
4.45
1.63
8.94
2
TON
[%]
86
0.31±0.01
0.31
0.10
0.61
0.1
bacterial 16S
[gene copies]
82
7.3e+08±7.1e+07
5.1e+08
8.3e+07
3.3e+09
4.3e+17
fungal 18S
[gene copies]
83
5.1e+06±5.4e+05
2.9e+06
6.0e+05
2.8e+07
2.5e+13
Metals
Allotment
As
[mgkg
−1]
82
9.41±0.4
9.45
2.60
27.70
14
Ba
[mgkg
−1]
82
383.3±17.34
330.75
230.70
1062.00
25270
Co
[mgkg
−1]
82
31.44±0.53
32.45
18.30
43.80
24
Cu.m
[mgkg
−1]
82
88.72±8.5
59.95
27.40
407.30
6063
Ni
[mgkg
−1]
82
40.23±1.08
39.35
22.10
80.10
98
Pb
[mgkg
−1]
82
143.79±16.43
88.15
34.00
1076.00
22672
Sb
[mgkg
−1]
82
1.68±0.5
0.60
0.40
39.10
21
V
[mgkg
−1]
82
81.68±1.63
79.05
50.60
117.90
224
Zn
[mgkg
−1]
82
270.97±19.39
215.80
102.00
966.50
31577
Home
As
[mgkg
−1]
86
9.39±0.33
9.85
0.50
19.40
9
Ba
[mgkg
−1]
86
387.3±15.35
352.20
201.80
841.20
20253
Co
[mgkg
−1]
86
31.68±0.46
31.90
21.40
45.40
19
Cu.m
[mgkg
−1]
86
63.79±4.15
51.70
15.60
208.80
1483
Ni
[mgkg
−1]
86
38.9±0.88
38.00
20.30
65.30
66
Pb
[mgkg
−1]
86
199.55±20.62
117.50
18.50
919.20
36568
Sb
[mgkg
−1]
86
1.93±0.4
1.00
0.40
33.00
14
V
[mgkg
−1]
86
77.97±1.55
77.15
44.10
112.20
207
Zn
[mgkg
−1]
86
266.67±19.81
215.85
58.90
999.90
33762
N
Mean±SE
Median
Min
Max
Variance
CLPP MicroResp
Allotment
Ala
[µgCO
2− Cg
−1h
−1]
84
3.53±0.12
3.54
0.77
6.32
1
Ara
[µgCO
2− Cg
−1h
−1]
84
3.88±0.12
3.97
1.21
6.08
1
Asc
[µgCO
2− Cg
−1h
−1]
84
9.07±0.17
9.22
1.98
11.30
2
Asp
[µgCO
2− Cg
−1h
−1]
84
3.70±0.12
3.79
1.37
7.02
1
Citr
[µgCO
2− Cg
−1h
−1]
84
10.29±0.2
11.01
3.18
12.08
3
Cys
[µgCO
2− Cg
−1h
−1]
84
2.42±0.11
2.30
0.62
5.67
1
Fruct
[µgCO
2− Cg
−1h
−1]
84
5.07±0.15
5.15
1.27
7.62
2
GABA
[µgCO
2− Cg
−1h
−1]
84
2.45±0.09
2.41
0.77
5.14
1
Gal
[µgCO
2− Cg
−1h
−1]
84
3.68±0.13
3.67
1.04
8.31
1
Glca
[µgCO
2− Cg
−1h
−1]
84
3.57±0.14
3.79
0.90
6.70
2
Gln
[µgCO
2− Cg
−1h
−1]
84
3.68±0.11
3.67
1.01
5.84
1
Gluc
[µgCO
2− Cg
−1h
−1]
84
5.32±0.14
5.44
1.72
8.01
2
H2O
[µgCO
2− Cg
−1h
−1]
84
1.87±0.11
1.56
0.61
7.32
1
KGA
[µgCO
2− Cg
−1h
−1]
84
10.69±0.17
11.14
3.23
11.96
2
Leu
[µgCO
2− Cg
−1h
−1]
84
2.44±0.10
2.46
0.68
5.89
1
MA
[µgCO
2− Cg
−1h
−1]
84
10.35±0.21
11.08
1.94
12.11
4
Prot
[µgCO
2− Cg
−1h
−1]
84
2.47±0.10
2.37
0.83
5.10
1
Van
[µgCO
2− Cg
−1h
−1]
84
2.46±0.12
2.23
0.96
8.26
1
Xyl
[µgCO
2− Cg
−1h
−1]
84
5.18±0.14
5.43
1.24
7.38
2
Home
Ala
[µgCO
2− Cg
−1h
−1]
86
4.03±0.11
4.06
1.77
6.05
1
Ara
[µgCO
2− Cg
−1h
−1]
86
4.54±0.11
4.63
1.96
6.33
1
Asc
[µgCO
2− Cg
−1h
−1]
86
9.43±0.15
9.72
4.55
11.12
2
Asp
[µgCO
2− Cg
−1h
−1]
86
4.20±0.10
4.32
2.17
6.53
1
Citr
[µgCO
2− Cg
−1h
−1]
86
10.61±0.15
11.10
6.61
12.03
2
Cys
[µgCO
2− Cg
−1h
−1]
86
2.69±0.12
2.48
0.85
5.59
1
Fruct
[µgCO
2− Cg
−1h
−1]
86
5.76±0.11
5.79
3.12
7.69
1
GABA
[µgCO
2− Cg
−1h
−1]
86
2.93±0.12
2.77
1.15
5.64
1
Gal
[µgCO
2− Cg
−1h
−1]
86
4.31±0.11
4.31
2.25
6.67
1
Glca
[µgCO
2− Cg
−1h
−1]
86
4.54±0.10
4.66
1.77
6.20
1
Gln
[µgCO
2− Cg
−1h
−1]
86
4.12±0.11
4.07
1.72
6.25
1
Gluc
[µgCO
2− Cg
−1h
−1]
86
6.00±0.11
6.11
3.24
8.06
1
H2O
[µgCO
2− Cg
−1h
−1]
86
2.25±0.12
1.99
0.67
4.85
1
KGA
[µgCO
2− Cg
−1h
−1]
86
10.72±0.14
11.25
6.81
12.19
2
Leu
[µgCO
2− Cg
−1h
−1]
86
2.82±0.11
2.76
1.05
5.28
1
MA
[µgCO
2− Cg
−1h
−1]
86
10.53±0.18
11.25
4.21
12.06
3
Prot
[µgCO
2− Cg
−1h
−1]
86
2.83±0.11
2.76
1.04
5.40
1
Van
[µgCO
2− Cg
−1h
−1]
86
2.79±0.11
2.60
1.10
5.25
1
Xyl
[µgCO
2− Cg
−1h
−1]
86
5.76±0.10
5.75
3.65
7.85
1
Tea bag decomposition
Home
green tea
[% decomposed]
84
0.58±0.01
0.58
0.49
0.69
0.01
rooibos tea
[% decomposed]
84
0.29±0.01
0.29
0.20
0.35
0.01
Home
green tea
[% decomposed]
77
0.60±0.01
0.59
0.53
0.75
0.01
rooibos tea
[% decomposed]
77
0.30±0.01
0.30
0.22
0.39
0.01
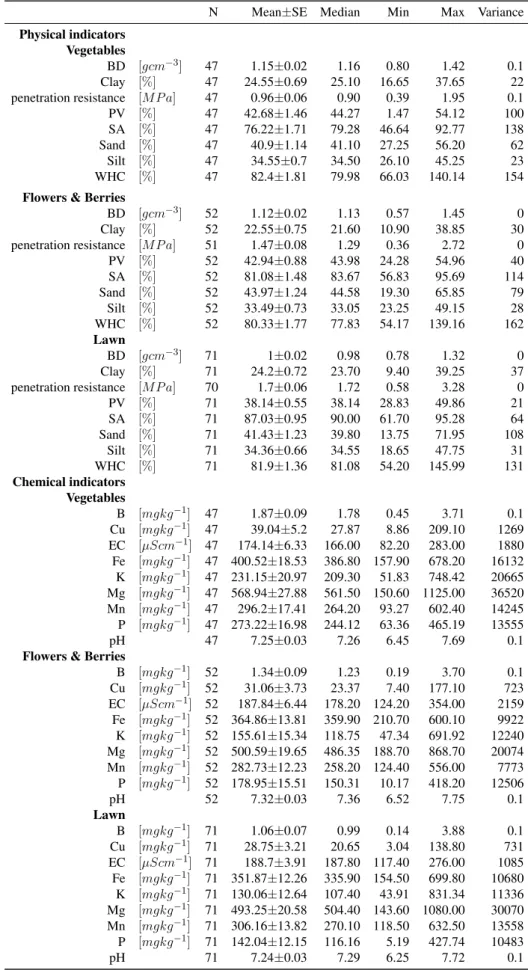
Table S6. Descriptive statistics of soil quality indicators in urban gardens of Zurich, CH. Data is aggregated by garden habitat type.
N
Mean±SE
Median
Min
Max
Variance
Physical indicators
Vegetables
BD
[gcm
−3]
47
1.15±0.02
1.16
0.80
1.42
0.1
Clay
[%]
47
24.55±0.69
25.10
16.65
37.65
22
penetration resistance
[M P a]
47
0.96±0.06
0.90
0.39
1.95
0.1
PV
[%]
47
42.68±1.46
44.27
1.47
54.12
100
SA
[%]
47
76.22±1.71
79.28
46.64
92.77
138
Sand
[%]
47
40.9±1.14
41.10
27.25
56.20
62
Silt
[%]
47
34.55±0.7
34.50
26.10
45.25
23
WHC
[%]
47
82.4±1.81
79.98
66.03
140.14
154
Flowers & Berries
BD
[gcm
−3]
52
1.12±0.02
1.13
0.57
1.45
0
Clay
[%]
52
22.55±0.75
21.60
10.90
38.85
30
penetration resistance
[M P a]
51
1.47±0.08
1.29
0.36
2.72
0
PV
[%]
52
42.94±0.88
43.98
24.28
54.96
40
SA
[%]
52
81.08±1.48
83.67
56.83
95.69
114
Sand
[%]
52
43.97±1.24
44.58
19.30
65.85
79
Silt
[%]
52
33.49±0.73
33.05
23.25
49.15
28
WHC
[%]
52
80.33±1.77
77.83
54.17
139.16
162
Lawn
BD
[gcm
−3]
71
1±0.02
0.98
0.78
1.32
0
Clay
[%]
71
24.2±0.72
23.70
9.40
39.25
37
penetration resistance
[M P a]
70
1.7±0.06
1.72
0.58
3.28
0
PV
[%]
71
38.14±0.55
38.14
28.83
49.86
21
SA
[%]
71
87.03±0.95
90.00
61.70
95.28
64
Sand
[%]
71
41.43±1.23
39.80
13.75
71.95
108
Silt
[%]
71
34.36±0.66
34.55
18.65
47.75
31
WHC
[%]
71
81.9±1.36
81.08
54.20
145.99
131
Chemical indicators
Vegetables
B
[mgkg
−1]
47
1.87±0.09
1.78
0.45
3.71
0.1
Cu
[mgkg
−1]
47
39.04±5.2
27.87
8.86
209.10
1269
EC
[µScm
−1]
47
174.14±6.33
166.00
82.20
283.00
1880
Fe
[mgkg
−1]
47
400.52±18.53
386.80
157.90
678.20
16132
K
[mgkg
−1]
47
231.15±20.97
209.30
51.83
748.42
20665
Mg
[mgkg
−1]
47
568.94±27.88
561.50
150.60
1125.00
36520
Mn
[mgkg
−1]
47
296.2±17.41
264.20
93.27
602.40
14245
P
[mgkg
−1]
47
273.22±16.98
244.12
63.36
465.19
13555
pH
47
7.25±0.03
7.26
6.45
7.69
0.1
Flowers & Berries
B
[mgkg
−1]
52
1.34±0.09
1.23
0.19
3.70
0.1
Cu
[mgkg
−1]
52
31.06±3.73
23.37
7.40
177.10
723
EC
[µScm
−1]
52
187.84±6.44
178.20
124.20
354.00
2159
Fe
[mgkg
−1]
52
364.86±13.81
359.90
210.70
600.10
9922
K
[mgkg
−1]
52
155.61±15.34
118.75
47.34
691.92
12240
Mg
[mgkg
−1]
52
500.59±19.65
486.35
188.70
868.70
20074
Mn
[mgkg
−1]
52
282.73±12.23
258.20
124.40
556.00
7773
P
[mgkg
−1]
52
178.95±15.51
150.31
10.17
418.20
12506
pH
52
7.32±0.03
7.36
6.52
7.75
0.1
Lawn
B
[mgkg
−1]
71
1.06±0.07
0.99
0.14
3.88
0.1
Cu
[mgkg
−1]
71
28.75±3.21
20.65
3.04
138.80
731
EC
[µScm
−1]
71
188.7±3.91
187.80
117.40
276.00
1085
Fe
[mgkg
−1]
71
351.87±12.26
335.90
154.50
699.80
10680
K
[mgkg
−1]
71
130.06±12.64
107.40
43.91
831.34
11336
Mg
[mgkg
−1]
71
493.25±20.58
504.40
143.60
1080.00
30070
Mn
[mgkg
−1]
71
306.16±13.82
270.10
118.50
632.50
13558
P
[mgkg
−1]
71
142.04±12.15
116.16
5.19
427.74
10483
pH
71
7.24±0.03
7.29
6.25
7.72
0.1
N Mean±SE Median Min Max Variance Biological indicators
Vegetables
basal respiration [µgCO2− Cg−1h−1] 47 0.26±0.02 0.22 0.10 0.69 0.1
Cmic [mgkg−1] 47 687.02±35.92 639.76 301.62 1362.47 60630 Cmin [gCO2− Ckg−1] 47 0.18±0.01 0.14 0.07 0.42 0.1 DOC [mgkg−1] 47 173.21±8.34 155.00 79.63 336.93 3270 DON [mgkg−1] 47 39.54±2.46 36.08 19.92 109.55 284 Nmic [mgkg−1] 47 114.39±6.31 101.25 44.70 208.64 1872 Nmin [mgkg−1] 47 1.61±0.15 1.55 0.00 4.10 1 TOC [%] 47 5.09±0.25 4.61 1.82 9.68 3 TON [%] 47 0.36±0.02 0.34 0.16 0.71 0.1 bacterial 16S [gene copies] 45 5.3e+08±7.8e+07 3.7e+08 5.1e+07 2.7e+09 2.8e+17 fungal 18S [gene copies] 45 6.4e+06±7.3e+05 4.6e+06 8.3e+05 2.1e+07 2.5e+13 Flowers & Berries
basal respiration [µgCO2− Cg−1h−1] 52 0.24±0.02 0.21 0.09 0.72 0.1
Cmic [mgkg−1] 52 790.84±36.5 781.81 279.91 1462.61 69262 Cmin [gCO2− Ckg−1] 52 0.15±0.01 0.13 0.06 0.46 0.1 DOC [mgkg−1] 52 160.2±8.94 145.94 62.33 415.26 4155 DON [mgkg−1] 52 41.1±2.74 35.27 18.95 113.34 390 Nmic [mgkg−1] 52 139.22±7.09 130.49 42.31 297.24 2615 Nmin [mgkg−1] 52 1.78±0.17 1.71 0.00 5.34 2 TOC [%] 52 4.63±0.22 4.62 1.63 9.53 2 TON [%] 52 0.32±0.02 0.31 0.13 0.78 0.1 bacterial 16S [gene copies] 50 7.2e+08±8.4e+07 5.9e+08 8.8e+07 3.3e+09 3.7e+17 fungal 18S [gene copies] 50 5.5e+06±7.0e+05 3.9e+06 8.0e+05 2.8e+07 2.5e+13
Lawn
basal respiration [µgCO2− Cg−1h−1] 71 0.22±0.01 0.20 0.08 0.39 0.1
Cmic [mgkg−1] 71 901.3±31.49 822.41 459.93 1593.98 70400 Cmin [gCO2− Ckg−1] 71 0.14±0.01 0.13 0.07 0.25 0.1 DOC [mgkg−1] 71 146.83±6.55 136.44 85.03 435.56 3051 DON [mgkg−1] 71 39.5±1.68 36.60 17.23 95.54 201 Nmic [mgkg−1] 71 160.11±6.36 154.56 80.47 357.83 2874 Nmin [mgkg−1] 71 1.7±0.14 1.58 0.00 5.85 1 TOC [%] 71 4.37±0.18 4.22 2.24 9.89 2 TON [%] 71 0.32±0.01 0.31 0.10 0.82 0.1 bacterial 16S [gene copies] 68 7.4e+08±7.2e+07 5.2e+08 8.3e+07 2.5e+09 3.7e+17 fungal 18S [gene copies] 68 4.4e+06±4.3e+05 3.0e+0 6.0e+05 1.8e+07 1.3e+13
Metals Vegetables As [mgkg−1] 47 9.2±0.56 8.90 3.20 27.70 14 Ba [mgkg−1] 47 393.37±20.39 366.90 275.20 1014.00 19546 Co [mgkg−1] 47 31.35±0.58 31.50 21.20 38.50 16 Cu.m [mgkg−1] 47 89.36±10.73 62.60 28.70 407.30 5408 Ni [mgkg−1] 47 40.5±1.21 39.30 22.50 58.30 69 Pb [mgkg−1] 47 157.45±17.81 120.10 39.30 528.70 14903 Sb [mgkg−1] 47 1.31±0.22 0.60 0.40 9.80 2 V [mgkg−1] 47 80.32±1.75 80.60 53.50 105.60 145 Zn [mgkg−1] 47 283.33±24.6 236.60 114.10 966.50 28434
Flowers & Berries
As [mgkg−1] 51 9.01±0.51 8.60 0.50 21.00 13 Ba [mgkg−1] 51 390.85±21.38 346.30 230.70 841.20 23764 Co [mgkg−1] 51 31.62±0.71 32.60 21.60 45.40 27 Cu.m [mgkg−1] 51 73.25±7.57 61.00 26.00 339.70 2981 Ni [mgkg−1] 51 37.15±1.17 34.80 24.60 58.00 71 Pb [mgkg−1] 51 207.27±26.27 119.80 40.50 709.80 35895 Sb [mgkg−1] 51 2.17±0.66 0.70 0.40 33.00 22 V [mgkg−1] 51 75.29±2.06 73.40 50.60 114.90 221 Zn [mgkg−1] 51 298.07±27.35 225.30 103.90 999.90 38896 Lawn As [mgkg−1] 70 9.82±0.33 10.30 2.60 16.80 8 Ba [mgkg−1] 70 375.95±18.47 331.80 201.80 1062.00 24217 Co [mgkg−1] 70 31.66±0.55 32.35 18.30 43.80 21 Cu.m [mgkg−1] 70 68.93±6.9 50.20 15.60 336.20 3379 Ni [mgkg−1] 70 40.66±1.15 40.15 20.30 80.10 94 Pb [mgkg−1] 70 156.87±22.62 80.65 18.50 1076.00 36312 Sb [mgkg−1] 70 1.88±0.57 0.70 0.40 39.10 23
N Mean±SE Median Min Max Variance CLPP MicroResp Vegetables Ala [µgCO2− Cg−1h−1] 47 3.4±0.17 3.42 0.77 5.96 1 Ara [µgCO2− Cg−1h−1] 47 3.56±0.17 3.70 1.21 6.26 1 Asc [µgCO2− Cg−1h−1] 47 9.03±0.24 9.24 1.98 11.12 3 Asp [µgCO2− Cg−1h−1] 47 3.57±0.18 3.63 1.37 7.02 1 Citr [µgCO2− Cg−1h−1] 47 10.52±0.26 11.10 3.18 11.94 3 Cys [µgCO2− Cg−1h−1] 47 2.25±0.17 1.92 0.62 5.25 1 Fruct [µgCO2− Cg−1h−1] 47 4.66±0.2 4.62 1.27 7.58 2 GABA [µgCO2− Cg−1h−1] 47 2.42±0.15 2.31 0.77 5.64 1 Gal [µgCO2− Cg−1h−1] 47 3.41±0.19 3.48 1.04 8.31 2 Glca [µgCO2− Cg−1h−1] 47 3.36±0.16 3.39 1.41 5.62 1 Gln [µgCO2− Cg−1h−1] 47 3.48±0.16 3.57 1.01 6.15 1 Gluc [µgCO2− Cg−1h−1] 47 4.98±0.2 5.13 1.72 7.94 2 H2O [µgCO2− Cg−1h−1] 47 1.9±0.17 1.56 0.67 7.32 1 KGA [µgCO2− Cg−1h−1] 47 10.68±0.22 11.14 3.26 12.19 2 Leu [µgCO2− Cg−1h−1] 47 2.37±0.15 2.10 0.68 5.89 1 MA [µgCO2− Cg−1h−1] 47 10.48±0.27 11.21 1.94 12.06 4 Prot [µgCO2− Cg−1h−1] 47 2.38±0.14 2.16 0.83 4.70 1 Van [µgCO2− Cg−1h−1] 47 2.39±0.18 2.18 0.96 8.26 1 Xyl [µgCO2− Cg−1h−1] 47 4.83±0.2 4.78 1.24 7.85 2
Flowers & Berries
Ala [µgCO2− Cg−1h−1] 52 3.88±0.14 3.77 1.58 6.05 1 Ara [µgCO2− Cg−1h−1] 52 4.25±0.15 4.45 1.36 6.12 1 Asc [µgCO2− Cg−1h−1] 52 9.69±0.17 10.04 4.55 11.30 2 Asp [µgCO2− Cg−1h−1] 52 4.07±0.13 4.15 2.17 6.53 1 Citr [µgCO2− Cg−1h−1] 52 10.74±0.19 11.24 6.19 12.08 2 Cys [µgCO2− Cg−1h−1] 52 2.57±0.14 2.30 0.95 4.62 1 Fruct [µgCO2− Cg−1h−1] 52 5.6±0.17 5.66 3.12 7.69 1 GABA [µgCO2− Cg−1h−1] 52 2.76±0.14 2.58 0.96 5.07 1 Gal [µgCO2− Cg−1h−1] 52 4.08±0.15 4.11 1.62 5.91 1 Glca [µgCO2− Cg−1h−1] 52 4.34±0.14 4.59 1.25 6.20 1 Gln [µgCO2− Cg−1h−1] 52 4.07±0.15 4.01 1.72 6.25 1 Gluc [µgCO2− Cg−1h−1] 52 5.82±0.16 5.82 3.24 7.88 1 H2O [µgCO2− Cg−1h−1] 52 2.05±0.13 1.80 0.61 4.80 1 KGA [µgCO2− Cg−1h−1] 52 10.93±0.16 11.31 6.81 12.02 1 Leu [µgCO2− Cg−1h−1] 52 2.66±0.14 2.52 0.75 5.10 1 MA [µgCO2− Cg−1h−1] 52 10.79±0.21 11.40 4.21 12.11 2 Prot [µgCO2− Cg−1h−1] 52 2.68±0.14 2.36 0.97 5.40 1 Van [µgCO2− Cg−1h−1] 52 2.65±0.12 2.60 1.07 4.62 1 Xyl [µgCO2− Cg−1h−1] 52 5.61±0.13 5.53 3.68 7.38 1 Lawn Ala [µgCO2− Cg−1h−1] 71 3.96±0.11 4.16 1.95 6.32 1 Ara [µgCO2− Cg−1h−1] 71 4.62±0.11 4.65 2.41 6.33 1 Asc [µgCO2− Cg−1h−1] 71 9.08±0.17 9.37 4.82 11.12 2 Asp [µgCO2− Cg−1h−1] 71 4.13±0.11 4.28 1.95 6.20 1 Citr [µgCO2− Cg−1h−1] 71 10.2±0.2 10.69 3.54 12.03 3 Cys [µgCO2− Cg−1h−1] 71 2.76±0.13 2.66 0.85 5.67 1 Fruct [µgCO2− Cg−1h−1] 71 5.8±0.11 5.74 2.29 7.56 1 GABA [µgCO2− Cg−1h−1] 71 2.82±0.11 2.69 1.29 5.27 1 Gal [µgCO2− Cg−1h−1] 71 4.33±0.11 4.21 2.46 6.67 1 Glca [µgCO2− Cg−1h−1] 71 4.31±0.14 4.25 0.90 6.70 1 Gln [µgCO2− Cg−1h−1] 71 4.05±0.11 4.05 2.47 5.84 1 Gluc [µgCO2− Cg−1h−1] 71 6.01±0.12 6.10 3.84 8.06 1 H2O [µgCO2− Cg−1h−1] 71 2.18±0.13 1.92 0.62 4.85 1 KGA [µgCO2− Cg−1h−1] 71 10.56±0.18 11.01 3.23 12.10 2 Leu [µgCO2− Cg−1h−1] 71 2.79±0.11 2.80 1.16 5.28 1 MA [µgCO2− Cg−1h−1] 71 10.16±0.23 10.81 2.90 11.99 4 Prot [µgCO2− Cg−1h−1] 71 2.82±0.11 2.80 1.04 5.10 1 Van [µgCO2− Cg−1h−1] 71 2.77±0.12 2.55 1.10 6.06 1 Xyl [µgCO2− Cg−1h−1] 71 5.81±0.1 5.82 3.44 7.80 1
Tea bag decomposition Vegetables
green tea [% decomposed] 45 0.57±0.01 0.57 0.49 0.71 0.01 rooibos tea [% decomposed] 45 0.29±0.01 0.30 0.20 0.38 0.01 Flowers & Berries
green tea [% decomposed] 49 0.58±0.01 0.58 0.52 0.70 0.01 rooibos tea [% decomposed] 49 0.30±0.01 0.30 0.22 0.38 0.01
Lawn
green tea [% decomposed] 67 0.60±0.01 0.59 0.53 0.75 0.01 rooibos tea [% decomposed] 67 0.29±0.01 0.29 0.23 0.39 0.01