ORIGINAL ARTICLE
Integrated
18
F-FDG PET/perfusion CT for the monitoring
of neoadjuvant chemoradiotherapy in rectal carcinoma:
correlation with histopathology
Michael A. Fischer&Bart Vrugt&Hatem Alkadhi&
Dieter Hahnloser&Thomas F. Hany&
Patrick Veit-Haibach
Received: 1 November 2013 / Accepted: 4 March 2014 / Published online: 24 April 2014 # Springer-Verlag Berlin Heidelberg 2014
Abstract
Purpose The aim of this study was to prospectively monitor changes in the flow-metabolic phenotype (ΔFMP) of rectal carcinoma (RC) after neoadjuvant chemoradiotherapy (CRT) and to evaluate whetherΔFMP of RC correlate with histo-pathological prognostic factors including response to CRT. Methods Sixteen patients with RC (12 men, mean age 60.7± 12.8 years) underwent integrated 18F-fluorodeoxyglucose (FDG) positron emission tomography (PET)/perfusion CT (PET/PCT), followed by neoadjuvant CRT and surgery. In 13 patients, PET/PCT was repeated after CRT. Perfusion [blood flow (BF), blood volume (BV), mean transit time (MTT)] and metabolic [maximum and mean standardized uptake values (SUVmax, SUVmean)] parameters as well as the FMP (BF × SUVmax) were determined before and after CRT by two independent readers and correlated to histopathologi-cal prognostic factors of RC (microvessel density, necrosis index, regression index, vascular invasion) derived from resected specimens. The diagnostic performance ofΔFMP for prediction of treatment response was determined.
Results FMP significantly decreased after CRT (p<0.001), exploiting higher changes after CRT as compared to changes of perfusion and metabolic parameters alone. Before CRT, no significant correlations were found between integrated PET/ PCT and any of the histopathological parameters (all p>0.05). After CRT, BV and SUVmax correlated positively with the necrosis index (r=0.67/0.70), SUVmaxwith the invasion of blood vessels (r=0.62) andΔFMP with the regression index (r=0.88; all p<0.05).ΔFMP showed high accuracy for pre-diction of histopathological response to CRT (AUC 0.955, 95 % confidence interval 0.833–1.000, p<0.01) using a cut-off value of−75 %.
Conclusion In RC,ΔFMP derived from integrated 18F-FDG PET/PCT is useful for monitoring the effects of neoadjuvant CRT and allows prediction of histopathological response to CRT. Keywords Positron emission tomography and computed tomography . Perfusion imaging . Colorectal neoplasms . Neoadjuvant therapy . Biological markers
Introduction
Colorectal cancer (CRC) is the third most common malignan-cy in men and women and is generally associated with high mortality in the Western population [1,2]. The introduction of preoperative chemoradiotherapy (CRT) in the surgical man-agement of patients with locally advanced stages (II/III) of rectal carcinoma (RC) has significantly increased the 5-year disease-free survival [3,4]. However, treatment response to CRT varies considerably between patients. Although 5-fluorouracil (5-FU)-based CRT induces downstaging in ap-proximately 49–70 % [5], a complete histopathological re-sponse is achieved in only 8–14 % of the patients with development of metachronous metastases in approximately
M. A. Fischer (*)
:
H. Alkadhi:
P. Veit-HaibachInstitute of Diagnostic and Interventional Radiology, University Hospital Zurich, Raemistrasse 100, 8091 Zurich, Switzerland e-mail: [email protected]
B. Vrugt
Department of Pathology, Institute of Surgical Pathology, University Hospital Zurich, Zurich, Switzerland
D. Hahnloser
Department of Surgery, Division of Visceral and Transplantation Surgery, University Hospital Zurich, Zurich, Switzerland T. F. Hany
:
P. Veit-HaibachClinic for Nuclear Medicine, University Hospital Zurich, Zurich, Switzerland
30 % of cases [6,7]. Depending on the degree of response, treatment can be individually optimized by dose escalation or by switching to more effective chemotherapeutic agents [8, 9]. Moreover, a substantial number of patients demonstrate an inadequate response despite optimal treatment (non-responders), resulting in unnecessary treatment toxicity as well as delay in surgical intervention. Therefore, it is of major clinical interest to accurately identify treatment response and to predict outcome following preoperative CRT for patients with RC.
In routine clinical practice, computed tomography (CT) plays an important role in the management of RC due to its widespread availability, affordability and reproducibility. However, due to its limited ability to discriminate residual tumour from normal tissue in the bowel wall, CT alone is partly insufficient for an accurate assessment of the response to neoadjuvant CRT [10,11]. Integration of functional data to CT in terms of positron emission tomography (PET) with [18F]fluoro-2-deoxy-D-glucose (FDG) allows one to quantify increased glucose metabolism in cancer cells, improving as-sessment of treatment response and enabling prediction of patient survival [12]. Recently, perfusion computed tomogra-phy (PCT) has emerged as a novel functional imaging tech-nique and a promising new surrogate biomarker of angiogen-esis [13–15], which is considered to play a pivotal role in colorectal tumour growth and dissemination [16].
PCT-derived vascular parameters [blood flow (BF), blood volume (BV), mean transit time (MTT)] are increasingly applied for diagnosis, staging and outcome prediction of RC [15, 17]. In addition, recently published data underline the potential of PCT for assessment of treatment response to CRT [18–20]. However, it remains unclear whether PET/CT-derived parameters of glucose metabolism [maximum and mean standardized uptake values (SUVmax, SUVmean)] exploit surrogates similar to PCT parameters [21] or whether the two methods are different surrogate biomarkers [22,23]. If the latter holds true, a combined assessment of the flow-metabolic phenotype (FMP) of RC using integrated18F-FDG PET/PCT [24] might be of additional value in assessment of therapy response as well as risk stratification of patients with CRC receiving neoadjuvant therapy. Therefore, the aim of this study was to prospectively monitor changes to the FMP of RC after neoadjuvant CRT and to evaluate whether the FMP of RC can predict response to CRT and patient survival.
Materials and methods Patients
This prospective study was approved by the local Ethics Committee and written informed consent was obtained from all patients. Between July 2007 and August 2010 a total of 16 patients (12 men and 4 women, mean age 60.7±12.8 years,
range 31–78 years) undergoing 18
F-FDG PET/CT imaging prior to neoadjuvant CRT and surgery of locally advanced RC were included in this study. Inclusion criteria were biopsy-proven rectal adenocarcinoma, locally advanced disease (T2– 4) with or without nodal involvement (N0, N1 or N2) or metastases (M0/M1) after primary staging including clinical examination, endorectal ultrasound and18F-FDG PET/CT as well as neoadjuvant treatment consisting of long-course CRT followed by surgical resection of the tumour. Patients with stage T1 rectal cancer, palliative disease and general contra-indications to 18F-FDG PET (uncontrolled diabetes) or contrast-enhanced CT (pregnancy, previous hypersensitivity reaction to intravenous contrast agent, renal impairment, de-fined as serum creatinine greater than 120μmol/l or estimated glomerular filtration rate less than 60 ml/min) were excluded. All patients underwent integrated18F-FDG PET including PCT imaging before CRT. After neoadjuvant CRT, 13/16 (81 %) patients (10 men and 3 women, mean age 60.1± 11.1 years, range 31–78 years) underwent an additional follow-up18F-FDG PET/PCT scan.
Treatment
All patients received the same neoadjuvant CRT regimen. Radiotherapy consisted of 45 Gy delivered over a period of 5 weeks and was combined with two courses of chemotherapy consisting of 350 mg of fluorouracil per square metre of body surface area per day and 20 mg leucovorin per square metre per day, both given over a period of 5 days. Surgical resection was performed 6–8 weeks after completion of CRT in all patients. Histopathological assessment
Histopathological evaluation was performed by one patholo-gist (B.V.; with 7 years of experience in pathology) who was blinded to the results from PCT and PET analysis. Tissue blocks were constructed according to the total mesorectal excision (TME) protocol [25] and semi-thin 3-um sections cut for routine examination. Pathological staging was per-formed according to the recent TNM classification (7th edi-tion, 2010) [26]. In addition, the following histopathological prognostic markers were investigated: microscopic vascular invasion (MVI), necrosis index (NI), microvessel density (MVD) and tumour regression grade (TRG). Vascular and lymphangio-invasion were assessed microscopically on a two-point scale (present or absent) using additional histo-chemical (elastin van Gieson) and immunohistohisto-chemical stainings (D2-40, 1:50, Dako A/S, Glostrup, Denmark), re-spectively. NI was assessed semiquantitatively [0=absent, 1= focal (≤10 % of the tumour area), 2=moderate (10–30 %), 3= extensive (≥30 %)] as described by Pollheimer et al. [27]. MVD (expressed as number of vessels per mm2) of the entire tumour cross section was determined by immunohistochemistry
with a CD34 antibody (QBEnd10, 1:400, Dako A/S, Glostrup, Denmark) as previously described [14]. Briefly CD34-stained slides were scanned, digitized and displayed on a high-resolution colour monitor; ten microscopic fields (0.1817 mm2 each) within tumour tissue, each separated by five field widths, were randomly chosen on each tumour-containing tissue block. The number of vessels stained positive for CD34 was counted at a magnification factor of 400. The mean value of MVD was calculated for the entire tumour cross section (hereafter termed tumour cross section MVD). Assessment of the histological response to CRT was achieved for each RC using the tumour regression according to Dworak et al. [28]. This score identifies five TRG based on the presence of residual tumour and the extent of fibrosis: TRG 0, no regression; TRG 1, predominance of vital tumour cells over peritumoural fibrosis (focal regres-sion); TRG 2, predominance of fibrosis over vital tumour cells (partial regression); TRG 3, residual tumour cells in fibrotic tissue (subtotal regression); TRG 4, no vital tumour cells de-tectable (total regression). Based on the Dworak classification, tumours with TRG 0–1 scores were regarded as non-responders and those with TRG 2–4 scores as responders.
Integrated18F-FDG PET/PCT imaging
All patients were examined in the supine position on a com-bined PET/CT in-line system (Discovery VCT, GE Healthcare, Milwaukee, WI, USA). These dedicated systems integrate a full-ring PET with a multislice helical 64-slice CT and permit the acquisition of coregistered CT and PET images in one imaging procedure. The patients were instructed to fast for 4 h prior to the examination. Scanning was started 60 min after the i.v. injection of a standard dose of 300–340 MBq FDG. Blood sugar levels were checked prior to the injection of the FDG.
After the acquisition of a low-dose, non-enhanced CT examination (80 mA, 140 kV, 0.5-s tube rotation, 4.25-mm section thickness), which was used for attenuation correction of the PET data as well as for the determination of anatomic distribution of increased radionuclide uptake, the PET emis-sion examination was acquired with an acquisition time of 2 min per bed position [15-cm axial field of view (FOV)/bed position]. All PET images were reconstructed by using a standard fully 3-D iterative algorithm (ordered subset expec-tation maximization: 28 subsets, 2 iterations, 128×128 recon matrix and overlap of 9 slices).
The PCT examination was fully integrated into the standard contrast-enhanced PET/CT procedure [29]. The FOV of the PCT examination was defined on the basis of the focal glucose metabolism within the rectal wall with concomitant rectal wall thickening by one experienced radiologist, who directly reviewed the previously acquired PET/CT images on the scanner console. After target lesion definition, intravenous contrast injection was started by injecting a total dose of
70 ml contrast media (Ultravist 370, Bayer Schering Pharma, Berlin, Germany) at a flow rate of 6 ml/s via a cubital vein.
Dynamic CT image acquisition for perfusion imaging was started after a 5-s delay for 50 s in the area of interest using the following imaging parameters: 1-s rotation time with 1 image/ s, cine duration 50 s, 8 slices, 5 mm slice thickness, 80 mA, 80 kV and effective radiation dose of 6 mSv. Thus, a craniocaudal coverage of 4 cm was achieved for the perfusion examination of the target RC lesion. The first contrast media bolus was followed by a saline flush (20 ml, 5 ml/s). Since the system did not allow for a shuttle mode at the time of the study, a 4-cm FOV for perfusion imaging represents the maximum coverage possible with the chosen time resolution. All images were transferred to a commercially available workstation (Ad-vantage Workstation 4.4, GE Healthcare, Milwaukee, WI, USA) for further image post-processing (coregistration of PET and non-enhanced CT images) and image analysis. Image analysis
Figure 1 gives an overview of image series derived from integrated PET/PCT and corresponding image analysis. PET/CT data evaluation
PET data were evaluated by one board-certified radiologist and one board-certified nuclear medicine physician/radiologist in consensus according to routine clinical practice using dedicated PET/CT software (Volume Viewer PET/CT, Advantage Work-station 4.4, GE Healthcare), which provides multiplanar reformatted images of PET alone, CT alone and fused PET/CT. For quantitative analysis a cubic volume of interest (VOI) was placed over the primary target RC lesion on the fused PET/CT images by one of the two investigators. Using a threshold of 42 % of maximum voxel (default by software), the cuboid VOI is automatically transformed into a threshold delimited VOI and dedicated SUVmaxand SUVmeanbased on the FDG uptake were calculated separately for pretreatment (pre-SUVmax, pre-SUVmean) and post-treatment (post-SUVmax, post-SUVmean). Fi-nally, the percentage difference from pre- to post-treatment values was calculated for both parameters (ΔSUVmax, ΔSUVmean) as follows: (pre-SUV− post-SUV)/pre-SUV × 100. PCT evaluation
All PCT data were evaluated using a commercially available perfusion software (CT Perfusion 3.0, GE Healthcare, Milwau-kee, WI, USA). A threshold of−5 to 120 HU was defined for soft tissue visualization. The arterial input was defined by a circular automated region of interest (ROI) in one of the internal iliac arteries. The calculated time-enhancement curve and the paramet-ric imaging maps for BF (ml/100 mg tissue per min), BV (ml/ 100 mg tissue) and MTT (s) were automatically calculated by the
software. The permeability surface (PS) was not calculated due to the short acquisition time of the study protocol.
Two readers M.A.F. and P.V-H. with 5 and 8 years of experience in abdominal radiology drew a freehand ROI de-fined by the margin of the target RC lesion in every affected slice of the perfusion volume (max. 8 slices) on one selected contrast-enhanced image series of the arterial phase which best delineated the tumour. Afterwards the ROIs were copied and pasted to the coregistered colour-coded image maps and perfu-sion parameters were recorded for the pre- (pre-BF, pre-BV, pre-MTT) and post- (post-BF, post-BV, post-MTT) treatment
examinations separately. Similar to PET analysis (see above), percentage differences from pre- to post-treatment values were calculated for each parameter (ΔBF, ΔBV, ΔMTT). Finally, the FMP in terms of the flow-metabolic product (BF × SUVmax) was calculated for each examination [pre-(BF × SUVmax), post-(BF × SUVmax)], and the percentage difference after CRT [Δ(BF × SUVmax)] was determined. The product was chosen over the ratio of both parameters [24] asΔBF and ΔSUVmaxshowed a positive correlation, which was stronger as compared toΔBF and ΔSUVmean(see“Results” section). Statistical analysis
Data were descriptively reviewed and variables are expressed as mean ± SD or as frequencies and percentages. The inter-observer variability of perfusion parameters (BF, BV, MTT) was assessed using Lin’s concordance correlation coefficient (ρc) with 95 % confidence interval (CI) [30]. Because inter-observer variability was minimal (see“Results” section), the mean of both measurements was taken for further analysis. Correlation between PCT and/or PET values as well as MVD was assessed using Pearson’s correlation coefficient (r), whereas correlation of PCT and/or PET values with NI or regression index was assessed with Spearman’s rank correla-tion coefficient (ρ).
Student’s t test for related samples was used to test for significant differences between pre- and post-therapeutic PCT and/or PET values. Differences of PCT and/or PET values between different groups of histopathological tumour regression were tested for statistical significance with the Mann-Whitney U test. The log-rank test was used to deter-mine significant differences of 3-year survival between re-sponders (TRG≥2) and non-rere-sponders (TRG<2) to CRT.
To investigate the diagnostic accuracy ofΔ(BF × SUVmax) for prediction of histopathological therapy response, the area under the curve (AUC) was determined by receiver-operating characteristic (ROC) analysis. The cut-offΔ(BF × SUVmax) value was chosen to yield 100 % sensitivity for predicting treatment response as defined by histopathology. Sensitivity, specificity, negative predictive value (NPV) and positive pre-dictive value (PPV) are given with Wilson CIs. A p value <0.05 was considered statistically significant. All statistical analyses were performed using commercially available soft-ware (SPSS, release 17.0, Chicago, IL, USA).
Results Patients
The median interval between the baseline PET/PCT scan and surgery was 102±21 days (range 68–116). The 3-year overall survival rate was 100 % in 11/16 (69 %) patients with a mean
Fig. 1 Combined assessment of tumour perfusion and metabolism with integrated PET/PCT. A 57-year-old male patient with locally advanced RC (T3, N0, M0) undergoing simultaneous18F-FDG PET/CT (a–d) and PCT
(e–j) before (left side) and after (right side) neoadjuvant CRT. Pre- and post-therapeutic SUVmaxand SUVmeanwere calculated from18F-FDG PET (a
vs b) and18F-FDG PET/CT (b vs c), respectively, whereas BF (e vs f), BV
(g vs h) and MTT (i vs j) were calculated from ROI measurements (white circle) on corresponding perfusion maps (e–j). The relative change between pre- and post-treatment SUVmax, SUVmean, BF, BV and MTT
measure-ments was−50.3, −47.4, −34.5, −21.4 and +33.2 %, respectively. Histo-pathological analysis revealed moderate tumour regression (TRG 2), focal tumour necrosis (NI of 1) and intermediate MVD
follow-up period of 950±213 days (range 553–1092). Of 16 patients, 3 (31 %) died within a 3-year period (median survival 287±350 days, range 37–866). Three of five (60 %) patients died from reasons unrelated to RC including perioperative complications (n=2) and alcohol-related liver failure (n=1). These patients were excluded from the disease-specific sur-vival analysis. Two of five (40 %) patients died because of progressive disease. In the group of the 13 patients with a follow-up PET/PCT examination after CRT, the median inter-val between the baseline and the follow-up PET/PCT scan was 89±15 days (range 58–104), between completion of CRT and the follow-up scan 41±9 days (range 35–56) and between the follow-up PET/PCT scan and surgery 8±5 days (range 1–21). Histopathological findings
The pathological TNM classification included the following stages: ypT1 N0 (n=2), ypT2 N0 M0 (n=2), ypT2 N1 M0 (n=1), ypT3 N0 M0 (n=7), ypT3 N1 M1 (n=1), ypT3 N2 M0 (n=2) and ypT4 N2 M1 (n=1). Microvascular invasion was present in 4/16 (25 %) patients, whereas lymphangio-invasion was detected in 1/16 (6 %) patients. The mean MVD was 76.6 ±14.4 (range 56–107). No necrosis was observed in 7/16 (43.8 %), focal necrosis in 4/16 (25 %), moderate necrosis in 3/16 (18.8 %) and extensive necrosis in 2/16 (12.5 %) pa-tients. Tumour regression according to the Dworak classifica-tion revealed a TRG 1 in 2/16 (12.5 %), a TRG 2 in 10/16 (62.5 %), a TRG 3 in 2/16 (12.5 %) and a TRG 4 in 2/16 (12.5 %) patients. An inadequate histological response to CRT (TRG 1) was observed in 2/16 (12.5 %) patients, who were classified as non-responders. All other patients (87.5 %) dem-onstrated a subtotal to total regression following CRT and therefore were regarded as responders.
Integrated PET/PCT
Interreader agreement (IRA) of perfusion parameters IRA was good for pre-BF [ρc=0.82, 95 % confidence limit (CL) 0.56–0.93], BV (ρc=0.86, 95 % CL 0.67–0.95), pre-MTT (ρc=0.90, 95 % CL 0.77–0.96), post-BV (ρc=0.89, 95 % CL 0.69–0.97), post-MTT (ρc=0.83, 95 % CL 0.56– 0.94) andΔBF (ρc=0.90, 95 % CL 0.71–0.97) and excellent for post-BF (ρc=0.92, 95 % CL 0.79–0.97) and ΔBV (ρc= 0.93, 95 % CL 0.79–0.98). Moderate IRA was seen for ΔMTT (ρc=0.73, 95 % CL 0.34–0.90).
Monitoring of neoadjuvant CRT
Table 1 and Fig. 2 give an overview of pre- and post-therapeutic perfusion and metabolic parameters and the flow-metabolic product with corresponding percentage
changes and p values after neoadjuvant CRT. The greatest post-therapeutic change was revealed forΔ(BF × SUVmax). Correlation of PET and PCT parameters
No significant correlation was found between any combina-tion of perfusion and metabolic parameters between pretreat-ment, post-treatment andΔ values.
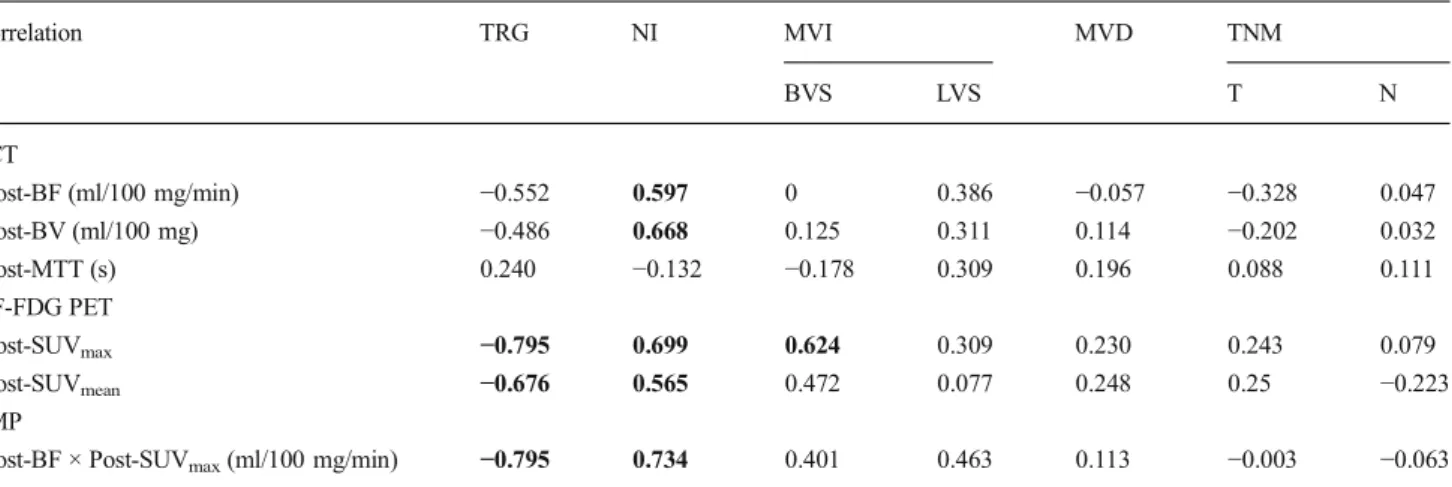
Correlation of PET and/or PCT with histopathology For pretreatment PET and/or PCT parameters, no significant correlation was found with any of the histopathological prog-nostic markers. After treatment all PET and PCT parameters except for post-MTT correlated significantly with the NI. In addition, a significant correlation was found between post-SUVmax, post-SUVmean, post-FMP and TRG as well as be-tween SUVmax and MVI of blood vessels (Table 2). No significant correlation was seen for TNM and MVD (all p>0.05).
Changes (%) of PET and/or PCT parameters from pre- to post-therapy showed a significant inverse correlation for all Δ values with TRG (all p<0.05) except for ΔMTT. The ΔFMP (BF × SUVmax) exploited the highest correlation coefficient (ρ=−877, p<0.001) of all parameters (Table 3). OnlyΔFMP (BF × SUVmax) showed a significant difference between partial, incomplete and complete histopathological regression with an AUC of 0.955 (95 % CI 0.833–1.000, p = 0.009), an AUC of 0.972 (95 % CI 0.809–1.000, p = 0.048) and an AUC of 1.0 (95 % CI 1.000–1.000, p=0.03), respectively (Fig.3).
Prediction of histopathological response to CRT
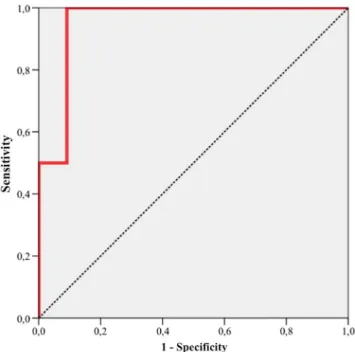
ΔPETand/or ΔPCT parameters are shown in Table3. Using a cut-offΔFMP (BF × SUVmax) of−75 %, we found a sensi-tivity of 100 % (CI 75–100 %) and a specificity of 91 % (CI 69–100 %) for prediction of therapy response (Fig. 4). The corresponding PPV was 67 % (CI 13–100 %) and NPV was 100 % (CI 95–100 %).
Discussion
In this prospective study we have shown that changes in the FMP derived from integrated PET/PCT allows for monitoring of neoadjuvant CRT, exploiting higher changes after CRT as compared to changes of perfusion and metabolic parameters alone. Before CRT, integrated PET/PCT did not correlate with any of the investigated histopathological parameters. After CRT, the strong as-sociation of BV with NI, SUVmax with vascular inva-sion and ΔFMP with tumour regression demonstrates
that PET/PCT measurements reflect histopathological changes indicative of a poor prognosis and as a result are helpful in predicting the response to CRT and over-all survival. Accordingly, ΔFMP showed an excellent diagnostic accuracy for prediction of histopathological response using a cut-off value of −75 %.
Accurate monitoring of neoadjuvant CRT is of major clinical importance for an individually tailored treatment regime of patients with RC [6–9, 31]. PET/CT is in-creasingly used in routine clinical practice for assess-ment of treatassess-ment response as metabolic parameters (SUVmax, SUVmean) decrease in cases of tumour regres-sion [12]. Recent studies showed the potential of PCT for monitoring of CRT in RC, while decreases in per-fusion parameters (BF, BV) are thought to reflect an-giogenic changes in neoplastic tissue in terms of a decreased number of arteriovenous shunts and a reduced volume of the vascular bed [18–20]. Consistent with these studies, our results demonstrate a significant de-crease in perfusion parameters (BF, BV) over the course of CRT. However, we observed no significant difference in MTT, which is in partial agreement with the previ-ously mentioned studies. This might be explained by insubstantially different changes to the volume of distri-bution (V) and the flow through the exchange unit (F) in RC over the course of CRT (MTT= V/F) and might be dependent on the time point of the follow-up exam-ination as volume changes usually appear more slowly than flow-related differences [32]. Compared with met-abolic parameters derived from 18F-FDG PET, PCT parameters in terms of ΔBF and ΔBV showed a similar potential for monitoring of CRT. However, combination of both parameters to a flow-metabolic product showed the highest changes after CRT (−81 %) as compared to
changes of perfusion and metabolic parameters alone, i n d i c a t i n g a p o t e n t i a l b e n e f i t f r o m c o m b i n e d multimodality assessment of perfusion and metabolic parameters for monitoring of neoadjuvant CRT.
Several studies have investigated the relationship be-tween 18F-FDG PET and PCT [22–24, 29, 33, 34], demonstrating that the balance between tumour vascu-larity and glucose metabolism offers substantial infor-mation concerning tumour adaption to the microenviron-ment. Matched high glucose metabolism with increased vascularity (coupling) represents a different biological status compared with mismatch of high metabolism and lower vascularity, the latter possibly indicating ad-aptation to hypoxia [35]. Accordingly, combined assess-ment of tumour BF and metabolism in terms of FMP was shown to provide additional diagnostic information for prediction of treatment response in breast and pan-creatic cancer [36–38]. In CRC, low flow and high metabolism were associated with higher levels of hypoxia-inducible factor 1α (hypoxia) and vascular en-dothelial growth factor (angiogenesis); however, uncoupling of flow and metabolism was revealed exclu-sively in stage I/II CRC, whereas coupling was demon-strated for stage III/IV CRC [23, 24]. Our results par-tially underline these findings as no coupling was re-vealed between 18F-FDG PET and PCT before and after CRT for the included stage II/III RC. Accordingly, the
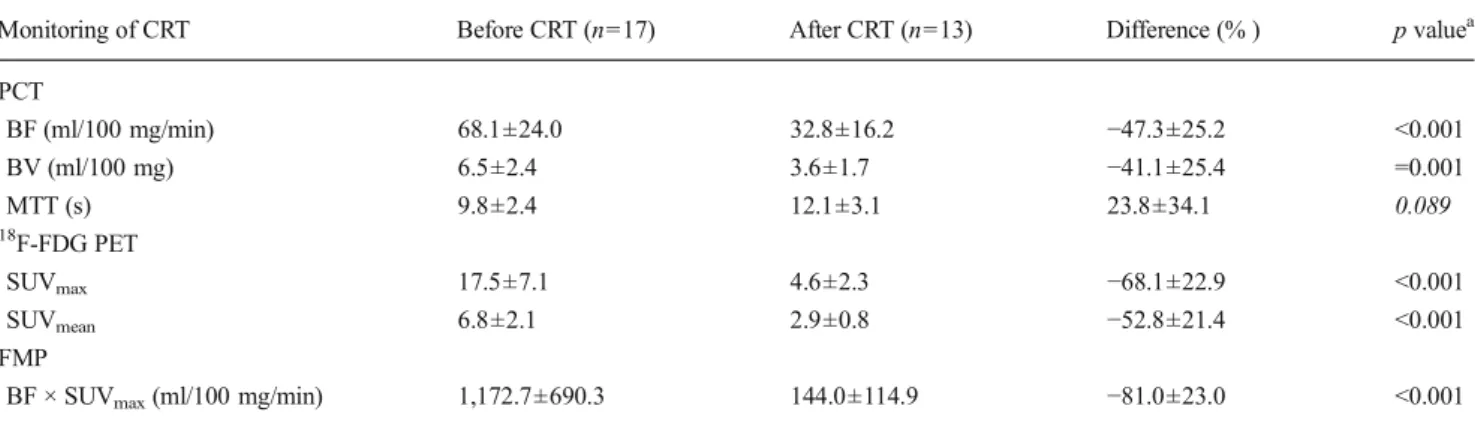
Table 1 Changes of18F-FDG PET, PCT and combined parameters (FMP) during neoadjuvant CRT
Monitoring of CRT Before CRT (n=17) After CRT (n=13) Difference (% ) p valuea PCT BF (ml/100 mg/min) 68.1±24.0 32.8±16.2 −47.3±25.2 <0.001 BV (ml/100 mg) 6.5±2.4 3.6±1.7 −41.1±25.4 =0.001 MTT (s) 9.8±2.4 12.1±3.1 23.8±34.1 0.089 18 F-FDG PET SUVmax 17.5±7.1 4.6±2.3 −68.1±22.9 <0.001 SUVmean 6.8±2.1 2.9±0.8 −52.8±21.4 <0.001 FMP
BF × SUVmax(ml/100 mg/min) 1,172.7±690.3 144.0±114.9 −81.0±23.0 <0.001
BF blood flow, BV blood volume, MTT mean transit time
a
Student’s t test for related samples was used to test for significant differences between pre- and post-therapeutic values. Italics indicate a non-significant result
Fig. 2 Comparison of pre- and post-CRT measurements of a PCT-derived vascular parameters (BF, BV, MTT), b18F-FDG PET-derived glucose metabolism parameters (SUVmax, SUVmean) and c combined
parameters (FMP). Data are displayed as box-and-whisker plots. Line within box indicates median, boundary of boxes indicates 25th and 75th percentiles and error bars indicate smallest and largest values within 1.5 box lengths of 25th and 75th percentiles
flow-metabolic relationships of other tumour entities like non-small cell lung cancer [34], breast cancer [39] and head and neck squamous cell cancer [22, 40, 41] were shown to depend upon tumour size and stage, indicating that BF and glucose uptake represent independent mea-sures of tumour biology.
However, no correlation was found for pretreatment perfusion and metabolic parameters alone and in com-bination (flow-metabolic ratio or product) with prog-nostic histopathological parameters evaluated in this study. This might be explained by the time point of histopathological evaluation which was, defined by standard routine clinical practice, performed after sur-gery and thus after CRT. Therefore, our results indicate that integrated PET/PCT at baseline might be of limit-ed value for prlimit-ediction of tumour grade and treatment response to neoadjuvant CRT in patients with locally advanced RC. This is consistent with a study evaluat-ing the prognostic value of metabolic parameters [42] but in contrast to results of two recent studies reveal-ing the prognostic value of baseline perfusion parame-ters for prediction of treatment response to neoadjuvant CRT [19, 20]. However, both studies defined treatment response (local downstaging after CRT/TRG 3–4) dif-ferently compared to our study (TRG 2–4).
In contrast to pretreatment parameters, a significant positive correlation of several PCT and 18F-FDG PET parameters with histopathological factors was revealed after CRT. Of those, post-BV/post-SUVmax and post-SUVmax showed the highest correlation with the NI and the invasion of blood vessels. The presence of tumour necrosis has been related to intra-/peritumoural inflammation and microsatellite status [43] and was shown to be an independent predictor of disease pro-gression and cancer-specific survival [27]. Similar to microvascular invasion of blood or lymphogenic vessels, it is therefore regarded as a surrogate for a more ag-gressive tumour phenotype. Thus, the low BV might be explained by a lower amount of viable tumour tissue of n e c r o t i c v e r s u s n o n - n e c r o t i c t u m o u r s , w h e r e a s dedifferentiated (more aggressive) carcinomas typically show a constitutively upregulated glycolysis [44], which explains the higher SUVmax of necrotic and invasive RC demonstrated in our study.
Similar to previous studies, we did not find a rela-tionship between perfusion or metabolic parameters and the MVD [14, 45, 46], which is considered a surrogate marker of tumoural angiogenesis and was correlated with poor outcome in RC [47]. However, another study suggests a relationship between MVD and RC [13], indicating that different results might be due to under-estimation of the MVD with CD34 antibodies [48] or to the high interobserver and methodological variability of
MVD assessment [23, 49]. Moreover, we did not ana-tomically match histopathological samples and perfusion measurements, which implies a potential measurement bias, although the whole tumour volume was assessed using integrated PET/PCT.
The histopathological TRG is a known prognostic factor in locally advanced RC treated with neoadjuvant CRT and the use of the standardized Dworak grading system to evaluate the TRG in RC was shown to be reliable to identify patients with a worse prognosis [50, 51]. In our study, correlation of Dworak’s TRG derived from histopathology and PCT/18F-FDG PET parameters
was demonstrated for metabolic changes (ΔSUVmax/ mean) and TRG 2, whereas changes to tumour perfusion (ΔBF/BV) showed significant correlation with TRG 3 and 4. Accordingly, changes to tumour metabolism seem to appear earlier (lower threshold) in treated RC (demonstrating a possibly higher sensitivity), whereas changes to tumour perfusion seem to appear later in the presence of subtotal or total tumour fibrosis, thus demonstrating a possibly higher specificity. As changes to perfusion were shown to be linked to chemothera-peutic agents like bevacizumab, whereas metabolic changes occurred predominantly after addition of
Table 2 Correlation of post-CRT18F-FDG PET, PCT and combined parameters (FMP) with histopathological prognostic factors derived from resected specimens Correlation TRG NI MVI MVD TNM BVS LVS T N PCT Post-BF (ml/100 mg/min) −0.552 0.597 0 0.386 −0.057 −0.328 0.047 Post-BV (ml/100 mg) −0.486 0.668 0.125 0.311 0.114 −0.202 0.032 Post-MTT (s) 0.240 −0.132 −0.178 0.309 0.196 0.088 0.111 18F-FDG PET Post-SUVmax −0.795 0.699 0.624 0.309 0.230 0.243 0.079 Post-SUVmean −0.676 0.565 0.472 0.077 0.248 0.25 −0.223 FMP
Post-BF × Post-SUVmax(ml/100 mg/min) −0.795 0.734 0.401 0.463 0.113 −0.003 −0.063
Spearman’s rank correlation coefficients (ρ) are displayed for all correlations except for MVD (Pearson’s r). Boldface indicates significant correlation (p<0.05)
TRG tumour regression grade, NI necrosis index, MVI microscopic vascular invasion, BVS blood vessels, LVS lymphogenic vessels, MVD microvessel density, T tumour, N node, BF blood flow, BV blood volume, MTT mean transit time, Post- post-CRT
Table 3 Comparison of changes (Δ) to18F-FDG PET, PCT and combined parameters (FMP) over the course of CRT with TRG derived from histopathological analysis
Response to CRT TRG
Correlation (ρ) TRG≥2 (p value) TRG≥3 (p value) TRG=4 (p value) PCT ΔBF (%) −0.795 >0.05 <0.05 <0.05 ΔBV (%) −0.699 >0.05 <0.05 <0.05 ΔMTT (%) 0.513 >0.05 <0.05 >0.05 18 F-FDG PET ΔSUVmax(%) −0.666 <0.05 >0.05 >0.05 ΔSUVmean(%) −0.723 <0.05 <0.05 >0.05 FMP Δ(BF × SUVmax) (%) −0.877 <0.05 <0.01 <0.05
Spearman’s rank correlation coefficient (ρ). Boldface indicates significant correlation (p<0.05) or significant differences between different regression groups.Δ− indicates percentage difference between pre- and post-CRT values
TRG ranked 0–4. TRG 2 partial regression, TRG 3 incomplete regression, TRG 4 complete regression, BF blood flow, BV blood volume, MTT mean transit time
radiation therapy in RC [35], our results confirm that both parameters exploit different surrogate markers for therapy response and suggest the benefit of combined assessment of perfusion and metabolism in terms of a f l o w - m e t a bo l i c p r o d u c t ( c o u p l i n g of ΔBF and ΔSUVmax). ΔFMP was the only parameter to show a significant difference between all groups of TRG pres-ent in our study. Similar to the previously mpres-entioned study of Dhadda et al. [50], we defined specimens with a TRG of 2–4 as responders and specimens with a TRG of 0–1 as non-responders to CRT as both groups showed a significant difference in patient survival. By doing so, ΔFMP showed an excellent accuracy for prediction of treatment response to neoadjuvant CRT in patients with RC.
Limitations
We have to acknowledge the small patient population as a limitation, and further studies on larger groups of patients are required to confirm our findings. However, our study indicates that PET/PCT may serve as an important adjunct in determin-ing the biological response to CRT and in predictdetermin-ing histo-pathological and clinical outcome in patients with RC. Sec-ondly, perfusion imaging contributes a substantial increase of radiation dose to the patient. However, evaluated tumour volumes (4 cm) and therefore applied radiation doses were relatively small and all patients underwent neoadjuvant radio-therapy, which is associated with significantly higher radiation exposure. Moreover, additional parameters of integrated PET/ PCT such as the PS area product or the total lesion glycolysis and PETvolneed to be evaluated in future. Finally, the accu-racy of perfusion measurements have been shown to depend on technical and individual aspects like temporal scan interval [52], post-processing software [53], tumour ROI placement and observer variation [54], which hamper a comparison of PCT measurements between different vendors. Howev-er, ΔFMP should be robust enough to remain unaffect-ed by those confounding factors if baseline and preop-erative examinations are performed by the same inves-tigator and imaging system.
Conclusion
The ΔFMP of RC derived from integrated 18F-FDG PET/ PCT has potential for monitoring the effects of neoadjuvant CRT and allows prediction of histopathological response to CRT.
Conflicts of interest None. Fig. 3 Comparison of percentage changes (Δ) to BF, SUVmaxand the
combination of both parameters in terms of FMP (BF × SUVmax) over the
course of CRT in regards to the TRG as derived from histopathological analysis of the resected specimens. Significant inverse correlation was shown for allΔ values with TRG (all p<0.05). However, Δ(BF × SUVmax) exploited the highest correlation coefficient (ρ=−877,
p<0.001) and was the only parameter that showed a significant difference between partial, incomplete and complete histopathological regression (p<0.05). Data are displayed as box-and-whisker plots. Line within box indicates median, boundary of boxes indicates 25th and 75th percentiles and error bars indicate smallest and largest values within 1.5 box lengths of 25th and 75th percentiles
Fig. 4 Diagnostic accuracy of pre- to post-therapeutic changes to the FMPΔ(BF × SUVmax) for prediction of response to CRT as determined
by histopathology. ROC analysis revealed an AUC of 0.955 (95 % CI 0.833–1.000, p=0.009), a sensitivity of 100 % (CI 75–100 %) and a specificity of 91 % (CI 69–100 %) using a cut-off value of −75 %. The corresponding PPV was 67 % (CI 13–100 %) and NPV was 100 % (CI 95–100 %)
References
1. Gondos A, Hiripi E, Holleczek B, Luttmann S, Eberle A, Brenner H, et al. Survival among adolescents and young adults with cancer in Germany and the United States: an international comparison. Int J Cancer 2013;133:2207–15. doi:10.1002/ijc.28231.
2. Ferlay J, Shin HR, Bray F, Forman D, Mathers C, Parkin DM. Estimates of worldwide burden of cancer in 2008: GLOBOCAN 2008. Int J Cancer 2010;127:2893–917. doi:10.1002/ijc.25516. 3. Roh MS, Colangelo LH, O’Connell MJ, Yothers G, Deutsch M,
Allegra CJ, et al. Preoperative multimodality therapy improves disease-free survival in patients with carcinoma of the rectum: NSABP R-03. J Clin Oncol 2009;27:5124–30. doi:10.1200/JCO. 2009.22.0467.
4. Sauer R, Becker H, Hohenberger W, Rödel C, Wittekind C, Fietkau R, et al. Preoperative versus postoperative chemoradiotherapy for rectal cancer. N Engl J Med 2004;351:1731–40. doi:10.1056/ NEJMoa040694.
5. Minsky BD, Cohen AM, Kemeny N, Enker WE, Kelsen DP, Reichman B, et al. Enhancement of radiation-induced downstaging of rectal cancer by fluorouracil and high-dose leucovorin chemother-apy. J Clin Oncol 1992;10:79–84.
6. Bosset JF, Collette L, Calais G, Mineur L, Maingon P, Radosevic-Jelic L, et al. Chemotherapy with preoperative radiotherapy in rectal cancer. N Engl J Med 2006;355:1114–23. doi:10.1056/ NEJMoa060829.
7. Gérard JP, Conroy T, Bonnetain F, Bouché O, Chapet O, Closon-Dejardin MT, et al. Preoperative radiotherapy with or without concur-rent fluorouracil and leucovorin in T3-4 rectal cancers: results of FFCD 9203. J Clin Oncol 2006;24:4620–5. doi:10.1200/JCO.2006.06.7629. 8. Mohiuddin M, Regine WF, Marks GJ, Marks JW. High-dose preop-erative radiation and the challenge of sphincter-preservation surgery for cancer of the distal 2 cm of the rectum. Int J Radiat Oncol Biol Phys 1998;40:569–74.
9. Rau B, Wust P, Hohenberger P, Löffel J, Hünerbein M, Below C, et al. Preoperative hyperthermia combined with radiochemotherapy in locally advanced rectal cancer: a phase II clinical trial. Ann Surg 1998;227:380–9.
10. Huh JW, Park YA, Jung EJ, Lee KY, Sohn SK. Accuracy of endorectal ultrasonography and computed tomography for restaging rectal cancer after preoperative chemoradiation. J Am Coll Surg 2008;207:7–12. doi:10.1016/j.jamcollsurg.2008.01.002.
11. Huebner RH, Park KC, Shepherd JE, Schwimmer J, Czernin J, Phelps ME, et al. A meta-analysis of the literature for whole-body FDG PET detection of recurrent colorectal cancer. J Nucl Med 2000;41:1177–89.
12. Pauwels EK, Coumou AW, Kostkiewicz M, Kairemo K. [18F]Fluoro-2-deoxy-D-glucose positron emission tomography/ computed tomography imaging in oncology: initial staging and evaluation of cancer therapy. Med Princ Pract 2013;22:427–37. doi:10.1159/000346303.
13. Goh V, Halligan S, Daley F, Wellsted DM, Guenther T, Bartram CI. Colorectal tumor vascularity: quantitative assessment with multide-tector CT–do tumor perfusion measurements reflect angiogenesis? Radiology 2008;249:510–7. doi:10.1148/radiol.2492071365. 14. Reiner CS, Roessle M, Thiesler T, Eberli D, Klotz E, Frauenfelder T,
et al. Computed tomography perfusion imaging of renal cell carcino-ma: systematic comparison with histopathological angiogenic and prognostic markers. Invest Radiol 2013;48:183–91. doi:10.1097/ RLI.0b013e31827c63a3.
15. Wu GY, Ghimire P. Perfusion computed tomography in colorectal cancer: protocols, clinical applications and emerging trends. World J Gastroenterol 2009;15:3228–31.
16. Kerbel RS. Tumor angiogenesis. N Engl J Med 2008;358:2039–49. doi:10.1056/NEJMra0706596.
17. Morsbach F, Pfammatter T, Reiner CS, Fischer MA, Sah BR, Winklhofer S, et al. Computed tomographic perfusion imaging for the prediction of response and survival to transarterial radioembolization of liver metastases. Invest Radiol 2013;48:787– 94. doi:10.1097/RLI.0b013e31829810f7.
18. Curvo-Semedo L, Portilha MA, Ruivo C, Borrego M, Leite JS, Caseiro-Alves F. Usefulness of perfusion CT to assess response to neoadjuvant combined chemoradiotherapy in patients with locally advanced rectal cancer. Acad Radiol 2012;19:203–13. doi:10.1016/j. acra.2011.10.019.
19. Bellomi M, Petralia G, Sonzogni A, Zampino MG, Rocca A. CT perfusion for the monitoring of neoadjuvant chemotherapy and radi-ation therapy in rectal carcinoma: initial experience. Radiology 2007;244:486–93. doi:10.1148/radiol.2442061189.
20. Sahani DV, Kalva SP, Hamberg LM, Hahn PF, Willett CG, Saini S, et al. Assessing tumor perfusion and treatment response in rectal cancer with multisection CT: initial observations. Radiology 2005;234:785–92. doi:10.1148/radiol.2343040286.
21. Janssen MH, Aerts HJ, Buijsen J, Lambin P, Lammering G, Öllers MC. Repeated positron emission tomography-computed tomography and perfusion-computed tomography imaging in rectal cancer: fluorodeoxyglucose uptake corresponds with tumor perfusion. Int J Radiat Oncol Biol Phys 2012;82:849–55. doi:10.1016/j.ijrobp.2010. 10.029.
22. Veit-Haibach P, Schmid D, Strobel K, Soyka JD, Schaefer NG, Haerle SK, et al. Combined PET/CT-perfusion in patients with head and neck cancers. Eur Radiol 2013;23:163–73. doi: 10.1007/s00330-012-2564-5.
23. Goh V, Rodriguez-Justo M, Engledow A, Shastry M, Endozo R, Peck J, et al. Assessment of the metabolic flow phenotype of primary colorectal cancer: correlations with microvessel density are influ-enced by the histological scoring method. Eur Radiol 2012;22: 1687–92. doi:10.1007/s00330-012-2423-4.
24. Goh V, Engledow A, Rodriguez-Justo M, Shastry M, Peck J, Blackman G, et al. The flow-metabolic phenotype of primary colo-rectal cancer: assessment by integrated 18F-FDG PET/perfusion CT with histopathologic correlation. J Nucl Med 2012;53:687–92. doi:
10.2967/jnumed.111.098525.
25. Weichert W, Schewe C, Lehmann A, Sers C, Denkert C, Budczies J, et al. KRAS genotyping of paraffin-embedded colorectal cancer tissue in routine diagnostics: comparison of methods and impact of histology. J Mol Diagn 2010;12:35–42. doi:10.2353/jmoldx.2010. 090079.
26. Sobin LHGM, Wittekind C, Compton CC. TNM classification of malignant tumours. 7th ed. Chichester: Wiley-Blackwell; 2010. 27. Pollheimer MJ, Kornprat P, Lindtner RA, Harbaum L, Schlemmer A,
Rehak P, et al. Tumor necrosis is a new promising prognostic factor in colorectal cancer. Hum Pathol 2010;41:1749–57. doi:10.1016/j. humpath.2010.04.018.
28. Dworak O, Keilholz L, Hoffmann A. Pathological features of rectal cancer after preoperative radiochemotherapy. Int J Colorectal Dis 1997;12:19–23.
29. Veit-Haibach P, Treyer V, Strobel K, Soyka JD, Husmann L, Schaefer NG, et al. Feasibility of integrated CT-liver perfusion in routine FDG-PET/CT. Abdom Imaging 2010;35:528–36. doi: 10.1007/s00261-009-9559-y.
30. Lin L, Torbeck LD. Coefficient of accuracy and concordance corre-lation coefficient: new statistics for methods comparison. PDA J Pharm Sci Technol 1998;52:55–9.
31. Guillem JG, Chessin DB, Cohen AM, Shia J, Mazumdar M, Enker W, et al. Long-term oncologic outcome following preoperative com-bined modality therapy and total mesorectal excision of locally advanced rectal cancer. Ann Surg 2005;241:829–36. discussion 36-8. 32. Roberts GW, Larson KB, Spaeth EE. The interpretation of mean transit time measurements for multiphase tissue systems. J Theor Biol 1973;39:447–75.
33. Groves AM, Wishart GC, Shastry M, Moyle P, Iddles S, Britton P, et al. Metabolic-flow relationships in primary breast cancer: feasibility of combined PET/dynamic contrast-enhanced CT. Eur J Nucl Med Mol Imaging 2009;36:416–21. doi:10.1007/s00259-008-0948-1. 34. Miles KA, Griffiths MR, Keith CJ. Blood flow-metabolic
relation-ships are dependent on tumour size in non-small cell lung cancer: a study using quantitative contrast-enhanced computer tomography and positron emission tomography. Eur J Nucl Med Mol Imaging 2006;33:22–8. doi:10.1007/s00259-005-1932-7.
35. Padhani AR, Miles KA. Multiparametric imaging of tumor response to therapy. Radiology 2010;256:348–64. doi:10.1148/radiol. 10091760.
36. Dunnwald LK, Gralow JR, Ellis GK, Livingston RB, Linden HM, Specht JM, et al. Tumor metabolism and blood flow changes by positron emission tomography: relation to survival in patients treated with neoadjuvant chemotherapy for locally advanced breast cancer. J Clin Oncol 2008;26:4449–57. doi:10.1200/JCO.2007.15.4385. 37. Tseng J, Dunnwald LK, Schubert EK, Link JM, Minoshima S, Muzi
M, et al. 18F-FDG kinetics in locally advanced breast cancer: corre-lation with tumor blood flow and changes in response to neoadjuvant chemotherapy. J Nucl Med 2004;45:1829–37.
38. Komar G, Kauhanen S, Liukko K, Seppänen M, Kajander S, Ovaska J, et al. Decreased blood flow with increased metabolic activity: a novel sign of pancreatic tumor aggressiveness. Clin Cancer Res 2009;15:5511–7. doi:10.1158/1078-0432.CCR-09-0414.
39. Specht JM, Kurland BF, Montgomery SK, Dunnwald LK, Doot RK, Gralow JR, et al. Tumor metabolism and blood flow as assessed by positron emission tomography varies by tumor subtype in locally advanced breast cancer. Clin Cancer Res 2010;16:2803–10. doi:10. 1158/1078-0432.CCR-10-0026.
40. Bisdas S, Spicer K, Rumboldt Z. Whole-tumor perfusion CT param-eters and glucose metabolism measurements in head and neck squa-mous cell carcinomas: a pilot study using combined positron-emission tomography/CT imaging. AJNR Am J Neuroradiol 2008;29:1376–81. doi:10.3174/ajnr.A1111.
41. Hirasawa S, Tsushima Y, Takei H, Hirasawa H, Taketomi-Takahashi A, Takano A, et al. Inverse correlation between tumor perfusion and glucose uptake in human head and neck tumors. Acad Radiol 2007;14:312–8. doi:10.1016/j.acra.2006.12.017.
42. Martoni AA, Di Fabio F, Pinto C, Castellucci P, Pini S, Ceccarelli C, et al. Prospective study on the FDG-PET/CT predictive and prog-nostic values in patients treated with neoadjuvant chemoradiation therapy and radical surgery for locally advanced rectal cancer. Ann Oncol 2011;22:650–6. doi:10.1093/annonc/mdq433.
43. Greenson JK, Bonner JD, Ben-Yzhak O, Cohen HI, Miselevich I, Resnick MB, et al. Phenotype of microsatellite unstable colorectal
carcinomas: well-differentiated and focally mucinous tumors and the absence of dirty necrosis correlate with microsatellite instability. Am J Surg Pathol 2003;27:563–70.
44. Warburg O. On the origin of cancer cells. Science 1956;123: 309–14.
45. Li ZP, Meng QF, Sun CH, Xu DS, Fan M, Yang XF, et al. Tumor angiogenesis and dynamic CT in colorectal carcinoma: radiologic-pathologic correlation. World J Gastroenterol 2005;11:1287–91. 46. Feng ST, Sun CH, Li ZP, Mak HK, Peng ZP, Guo HY, et al.
Evaluation of angiogenesis in colorectal carcinoma with multidetector-row CT multislice perfusion imaging. Eur J Radiol 2010;75:191–6. doi:10.1016/j.ejrad.2009.04.058.
47. Li C, Gardy R, Seon BK, Duff SE, Abdalla S, Renehan A, et al. Both high intratumoral microvessel density determined using CD105 antibody and elevated plasma levels of CD105 in colorectal cancer patients correlate with poor prognosis. Br J Cancer 2003;88:1424–31. doi:10.1038/sj.bjc.6600874. 48. Weidner N. Intratumor microvessel density as a prognostic factor in
cancer. Am J Pathol 1995;147:9–19.
49. Hansen S, Grabau DA, Rose C, Bak M, Sørensen FB. Angiogenesis in breast cancer: a comparative study of the observer variability of methods for determining microvessel density. Lab Invest 1998;78: 1563–73.
50. Dhadda AS, Dickinson P, Zaitoun AM, Gandhi N, Bessell EM. Prognostic importance of Mandard tumour regression grade following pre-operative chemo/radiotherapy for locally ad-vanced rectal cancer. Eur J Cancer 2011;47:1138–45. doi:10. 1016/j.ejca.2010.12.006.
51. Losi L, Luppi G, Gavioli M, Iachetta F, Bertolini F, D’Amico R, et al. Prognostic value of Dworak grade of regression (GR) in patients with rectal carcinoma treated with preoperative radiochemotherapy. Int J Colorectal Dis 2006;21:645–51. doi:
10.1007/s00384-005-0061-x.
52. Goh V, Liaw J, Bartram CI, Halligan S. Effect of temporal interval between scan acquisitions on quantitative vascular parameters in colorectal cancer: implications for helical volumetric perfusion CT techniques. AJR Am J Roentgenol 2008;191:W288–92. doi:10. 2214/AJR.07.3985.
53. Goh V, Halligan S, Bartram CI. Quantitative tumor perfusion assess-ment with multidetector CT: are measureassess-ments from two commercial software packages interchangeable? Radiology 2007;242:777–82. doi:10.1148/radiol.2423060279.
54. Goh V, Halligan S, Gharpuray A, Wellsted D, Sundin J, Bartram CI. Quantitative assessment of colorectal cancer tumor vascular param-eters by using perfusion CT: influence of tumor region of interest. Radiology 2008;247:726–32. doi:10.1148/radiol.2473070414.