Publisher’s version / Version de l'éditeur:
Journal of Raman Spectroscopy, 42, 4, pp. 580-585, 2011-08-28
READ THESE TERMS AND CONDITIONS CAREFULLY BEFORE USING THIS WEBSITE.
https://nrc-publications.canada.ca/eng/copyright
Vous avez des questions? Nous pouvons vous aider. Pour communiquer directement avec un auteur, consultez la
première page de la revue dans laquelle son article a été publié afin de trouver ses coordonnées. Si vous n’arrivez pas à les repérer, communiquez avec nous à [email protected].
Questions? Contact the NRC Publications Archive team at
[email protected]. If you wish to email the authors directly, please see the first page of the publication for their contact information.
NRC Publications Archive
Archives des publications du CNRC
This publication could be one of several versions: author’s original, accepted manuscript or the publisher’s version. / La version de cette publication peut être l’une des suivantes : la version prépublication de l’auteur, la version acceptée du manuscrit ou la version de l’éditeur.
For the publisher’s version, please access the DOI link below./ Pour consulter la version de l’éditeur, utilisez le lien DOI ci-dessous.
https://doi.org/10.1002/jrs.2761
Access and use of this website and the material on it are subject to the Terms and Conditions set forth at
Background removal from polarized Raman spectra of tooth enamel
using the wavelet transform
Li, Jianghua; Choo-Smith, Lin-P’ing; Tang, Zhilie; Sowa, Michael G.
https://publications-cnrc.canada.ca/fra/droits
L’accès à ce site Web et l’utilisation de son contenu sont assujettis aux conditions présentées dans le site
LISEZ CES CONDITIONS ATTENTIVEMENT AVANT D’UTILISER CE SITE WEB.
NRC Publications Record / Notice d'Archives des publications de CNRC: https://nrc-publications.canada.ca/eng/view/object/?id=894e2374-f974-4cfe-a360-8039fdd3e302 https://publications-cnrc.canada.ca/fra/voir/objet/?id=894e2374-f974-4cfe-a360-8039fdd3e302
Background removal from polarized Raman spectra of tooth enamel
using the wavelet transform
Jianghua Li, Lin-
P’ing Choo-Smith, Zhilie Tang, Michael G. Sowa
A wavelet transformation method is introduced to remove the large fluorescence background from polarized Raman spectra of stained tooth enamel. This method exploits the wavelet multiresolution decomposition where the experimental Raman spectrum is decomposed into signals with different frequency components, and where the lowest frequency background and highest frequency noise are removed. This method is optimized using a simulated collection of parallel-polarized and cross-polarized Raman spectra of the enamel and then applied to a set of experimental data. The results show that the wavelet transform technique can extract the pure spectra from background and noise, with the depolarization ratio used to discriminate between early dental caries and sound enamel preserved.
Keywords: wavelet transform; enamel; caries; background removal Introduction
Raman spectroscopy has been applied in recent years in dental research. The main appeal is that this technique can provide chemical-specific information about the composition of a sample. For example, the method has been applied to examine the composition of enamel and dentin[1] and for understanding the interaction of various bonding agents and materials used in dental restorations.[2–4] In addition, we have recently demonstrated that polarized Raman
spectroscopy (PRS) using near-infrared excitation can readily be used to differentiate between sound enamel and carious enamel using the depolarization ratio based on the integrated peak intensities of the symmetric phosphate stretching vibration at 959 cm−1.[5-7] However, for tooth enamel therecan be a strong interfering background in the Raman spectrum resulting from extrinsic stains arising from food, drugs, tobacco usage or other sources and intrinsic stains, which obscure small Raman signals and affect calibration and quantitation based on spectral peak information. In order to use the depolarization ratio to distinguish sound enamel from early carious regions in stained enamel, it would seem that it is only necessary to remove the
background from the small wavenumber interval in the region of 900–1000 cm−1. However, our study using the approach of fitting a straight line background in the region of the peak and subtracting this background before calculating areas under the peak has shown that
background fluorescence from staining complicates the use of PRS for discriminating stained sound enamel from carious enamel. When the background is corrected using this method, the differences in the mean depolarization ratios of stained enamel and caries are not statistically significant.[8] The presence of a fluorescence background superimposed on the Raman spectra skews the calculated depolarization ratio and diminishes the ability of using Raman
measurements to discriminate between healthy and carious enamel. Although we focus primarily on the ν1 (∼959 cm−1) peak for quantitative analyses, our early studies have also shown that there are subtle changes in the ν2, ν3 and ν4 phosphate vibrations.[5] By correcting the background of the entire Raman spectrum, we can potentially gain additional insight
regarding the alterations occurring in the other phosphate vibrations. For these various reasons, we began exploring alternative methods for background removal that would involve the entire Raman spectrum in order to obtain reliable diagnostic results.
Recently, several computational methods have been implemented to accomplish the task of background removal. These methods include frequency-domain filtering,[9] first and second derivatives,[10] polynomial fitting[11,12] and wavelet transform.[13–16] Detailed discussions of the various methods have been elaborated in recent papers.[10,17] Our experience with using a high-order polynomial curve fitting method to subtract out the background fluorescence showed that there was no improvement in separating out the Raman depolarization ratios from stained sound enamel and unstained carious enamel. Rather, the polynomial correction method led to higher depolarization ratios for stained enamel thus caused more overlap with depolarization values obtained from unstained carious enamel.
Of the various subtraction methods proposed in the literature, the wavelet transform is
becoming increasingly common, not just because of computational efficiency but also because of its time–frequency multiresolution analysis property. Multiresolution analysis allows for separating information in time and frequency domains, enabling the suppression of a variable background without a significant loss of signal information.
The wavelet transform is a powerful tool to deal with nonperiodic signals. It has been
successfully used in denoising,[18] information extraction,[19] resolving overlapping signals[20] and data compression.[21] Also, it has been successfully used to remove the background in Raman spectra.[15,16,18] However, it has never been used for recovering the Raman spectrum of tooth enamel in the presence of a broad fluorescence background caused by naturally
occurring staining of the enamel. In many cases, the broad background can obscure the Raman signal even when near-infrared excitation is used. In this paper, a wavelet transform method is introduced to extract the weak Raman spectra from stained tooth enamel.
Two sets of simulated polarized Raman spectral data, one for sound enamel and another for carious enamel, were used to choose the optimal wavelet basis and decomposition level, as well as to confirm the ability of the wavelet transform approach to remove background
contamination and noise. These parameters were then used to treat experimental tooth enamel spectra in order to reconstruct the pure Raman signal.
Theory
The theory of multiresolution wavelet decomposition and reconstruction has been described in detail previously.[15,16,18,22–24] We briefly outline its use in denoising and baseline removal. Mallat’s pyramidal algorithm decomposes the original signal f (t) into an approximated part (low frequency) and a detailed part (high frequency). For example, for a signal f (t) with a sampling frequency Fs, according to the Nyquist sampling theory, the basic frequency of f (t) should be
Fmax = Fs/2. A single-level decomposition of the signal divides it into an approximate signal
component A1 (whose frequency ranges from 0 to Fmax/2) and a detail component D1 (whose frequency ranges from Fmax/2 toFmax). At the second level, the approximate signal component
A1 is further decomposed into a new approximate component A2 and detail component D2.
This process is continued so that the original signal is represented by a new sequence f = Aj +Dj +Dj−1 +. . .+D1. If Aj is set to zero, the reconstructed signal consists of the higher frequency part of the original signal, and thus the background can be eliminated. In the same way, if Dj is set to zero, the reconstructed signal is missing the higher frequency parts of the signal, thus the noise can be eliminated.
To obtain smooth spectra before the wavelet transform, soft thresholding and scaled noise option as proposed by Donoho was used to remove the noise.[25] Firstly, we chose the ‘db 4’ wavelet and level 6 to compute the wavelet decomposition of the signal using the function ‘wavedec’ from theMatlab 7.5 Wavelet Toolbox (The Mathworks, Inc., Natick, MA, USA).
Wavedec performs a multilevel one-dimensional wavelet analysis using either a specific wavelet or specific wavelet decomposition filters. Then for each level, the threshold obtained by the function ‘wthrmngr’ was selected where wthrmngr returns a global threshold or level dependent thresholds. Finally, the thresholds were applied to the detail coefficients to denoise by the function ‘wdencmp’. The function wdencmp performs a denoising or compression process of a signal or an image, using wavelets.
The proposed algorithm involves three steps: (1) denoising using soft thresholding and scaled noise option; (2) multiple-level decomposition and (3) signal reconstruction. These steps were applied using the original approximation coefficients of jth level and the modified detail
coefficients of levels from 1 to the jth level. Experimental
Polarized Raman spectral data of unstained regions of sound enamel and carious enamel were used to develop a simulated dataset with varying levels of background. As well, a set of
experimental Raman spectra of sound teeth and carious teeth, with and without stains, were used to validate the utility of the method for removing the background and noise. All
computations and programming were carried out with the Matlab software (The Mathworks, Inc., Natick, MA, USA), version 7.5, equipped with the Wavelet Toolbox, where the function
‘wavedec’ and ‘waverec’ were used for wavelet decomposition and reconstruction, respectively. Simulation analysis
Representative spectra corresponding to parallel- and cross-polarized Raman spectra of carious and healthy regions of unstained enamel were used in conjunction with various backgrounds to simulate the effects of staining on the Raman spectrum of enamel. The performance of the wavelet transform method for background removal was evaluated with this dataset. Larger and larger backgrounds composed of a linear function (1 + a × λ) and a Gaussian peak (b × exp(−(λ − c)2/80 000)), where a1 = 2.2, b1 = 1000, c1 = 50; a2 = 3, b2 = 2000, c2 = 100; a3 = 3, b3 = 4000, c3 = 200; a4 = 3.8, b4 = 6000, c4 = 300; a5 = 4.5, b5 = 7000, c5 = 400; a6 = 5.5, b6 = 8000, c6 = 600; a7 = 6, b7 = 10000, c7 = 800; a8 = 7, b8 = 10000, c8 = 1200; were
superimposed on the base parallel-polarized and cross-polarized Raman spectra of carious lesions and healthy enamel.
Selection of mother wavelet function and the level of decomposition
There are many possible mother wavelet functions that could be used. One criterion is to choose a function that resembles the patterns to be localized in the signal, as this will ensure that the structures of interest are efficiently localized in the time and frequency domains. Furthermore, this approach minimizes ‘spurious’ effects in the reconstruction of the signal from the inverse filter coefficients.
The sets of parallel- and cross-polarized Raman spectra simulating stained sound enamel and carious enamel were used to help choose an effective wavelet function. The results using the
Daubechies and Symmlets families are reported. These wavelet families have a high degree of similarity to the original signal and previous studies have found them to be very suitable for spectral analysis.[15,16] The quality of the wavelet decomposition was judged according to the root mean-squared error (RMSE) in the difference between the original signal and the
reconstructed signal at a defined level j. The mother wavelet function and the level of
decomposition producing the smallest RMSE on the simulated data were then applied to the experimental data from stained and unstained enamel.
Experimental Raman Spectra Tooth samples
Sixteen extracted human teeth were acquired from the Oral Surgery Clinics of the Faculty of Dentistry of University of Manitoba and of Dalhousie University, as well as from private dental clinics in Winnipeg and Morden, MB. These teeth were extracted from consenting patients who were undergoing extractions for orthodontic and other reasons. Remaining soft tissue on extracted teeth was removed by scaling and the samples were rinsed with water. Teeth were then preserved in sterile filtered deionized water until measured.
Polarized Raman microspectroscopy
Raman spectra were acquired on a LabRamHR confocal Raman microspectrometer (Horiba Jobin Yvon, Edison,NJ, USA) operating with near-infrared laser excitation at 830 nm (Spectra-Physics 3900S titanium sapphire laser pumped with a 5 W Millennia Pro solid-state laser, Spectra-Physics, Mountain View, CA). The 3900S laser is linearly polarized with the beam having a horizontal polarization. Laser powers were adjusted such that at the sample there was approximately 100mW under the 10×(Nikon) microscope objective lens. The confocal hole size was set at 800m and the slit size at 100 m. A spectrograph with a 300 lines/mm grating was used to provide a spectral resolution of 4 cm−1. Parallel-polarized and cross-polarized spectra were obtained by placing a linear polarizer (i.e. analyzer) oriented parallel (||) to and
perpendicular (⊥) to that of the linearly polarized laser light, respectively. Spectra were acquired by placing the intact tooth surface of interest under the microscope objective and oriented orthogonal to the laser beam direction. Spectra were acquired for 5 s with six accumulations to equal 30 s measurement time. Labspec (version 4.12, Horiba Jobin Yvon, Edison, NJ, USA) software accompanying the LabRamHR system was used for spectrometer control and data acquisition. Details of the instrumentation have been outlined previously.[5,6]
Data analysis
Spectral background optics subtraction, instrument response correction for Raman spectra and spectral correction for the polarization dependence of the optics were performed as described previously.[5,6]
The Raman depolarization ratio ρ959 was calculated according to conventional definition:
where I959(⊥) and I959(||) are the integrated peak intensities of the 959 cm−1 peak detected with the
analyzer oriented perpendicular to (⊥) and parallel to (||) the polarization direction of the linearly polarized laser light, respectively. The peak at 959 cm−1 represents the totally symmetric P–O stretching vibration of the phosphate ions (PO3−4 ) within hydroxyapatite, which is the dominant component of tooth enamel.
For statistical analysis, ρ959 values were obtained for two datasets, named ρ959(C) for carious
lesions and ρ959(S) for sound enamel. In order to determine whether there is a significant
difference between these two sets of data, a t-test was carried out using the t-critical value at 95% confidence interval level with N1 + N2 − 2 degrees of freedom. The analyses were divided up between stained and unstained measurements where N1 = 16 (unstained sound enamel) and N2 = 30 (unstained carious enamel) for one analysis and N1 = 17 (stained sound enamel) and N2 = 15 (stained carious enamel) for the other analysis.
Results and Discussion
Determination of the wavelet function and decomposition level
he function wmaxlev was used to determine the maximum possible level of decomposition and was usually between level 7 and level 8 for these data. At low levels of decomposition (i.e. below level 6), due to distortion of the resulting spectra, visual inspection was sufficient to determine the poor mismatch between the original and reconstructed spectrum. Spectral
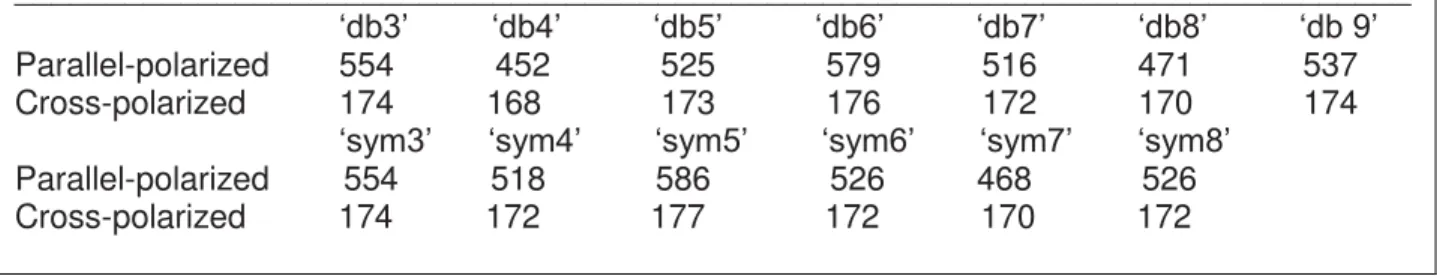
reconstruction was usually adequate after six levels of decomposition and therefore was chosen for our analyses. The performance of the best mother wavelet type (Daubechies or Symmlet) and the optimum level was evaluated by computing the RMSE between the original spectrum before a background was added and the reconstructed spectrum (Table 1) where the added baseline was eliminated. It was found that reconstruction of a typical tooth enamel spectrum had the smallest RMSE using the ‘db 4’ mother wavelet at six levels of decomposition. Hence, ‘db 4’ wavelets and level 6 were used for wavelet decomposition and reconstruction. Like many of the other subtraction methods proposed in the literature, this wavelet approach does require some user supervision to assess the quality of the fit and thereby guide the selection of the
appropriate decomposition method. However, evaluating the RMSE of the fit offers a non-subjective method of choosing the decomposition method and level.
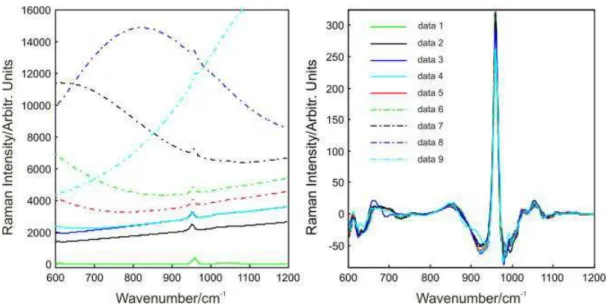
The original and corresponding reconstructed simulated cross-polarized Raman spectra of sound enamel are shown in Fig. 1. The series of spectra in the left panel correspond to varying backgrounds added to the original spectrum of sound enamel. The right panel shows the corresponding reconstructed spectra. All of the reconstructed spectra overlap after the wavelet transformation, such that the background and the enamel Raman spectra can be separated. In the same way, the background was removed from all the simulated parallel-polarized and crosspolarized spectral data mimicking sound enamel and carious stained enamel. The depolarization ratios ρ959 obtained from the reconstructed spectra and from the original are compared in Table 2. It can be seen that the values are close: ρ959(C) = 0.1395 (original),
ρ959(C) = 0.1389 ± 0.001 (after reconstruction) and ρ959(S) = 0.0717 (original), ρ959(S) = 0.0616 ± 0.002 (after reconstruction).
Experimental polarized Raman spectra
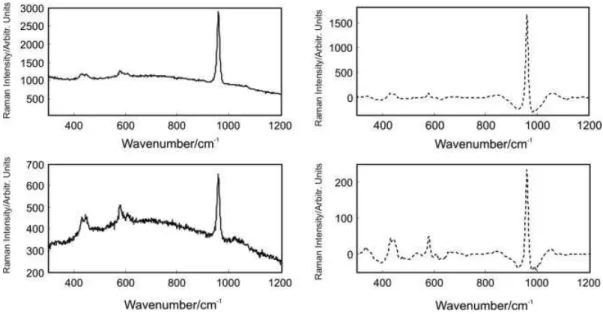
Representative parallel- (P1) and cross-polarized (P2) Raman spectra for sound unstained enamel, caries unstained enamel, sound stained enamel and caries stained enamel and their corresponding wavelet reconstruction are shown in Figs 2–4. As described previously, the intensity of the Raman peaks at 590, 608, 959, 1069 and 1104 cm−1 of enamel show polarization dependence. Most noticeable is the dramatic intensity change of the 959 cm−1 peak. In contrast to sound enamel, the peak intensity change with cross-polarization is not as dramatic at sites of carious lesions. The majority of Raman spectra of sound enamel and carious enamel contain a minor sloping baseline as background. After the wavelet
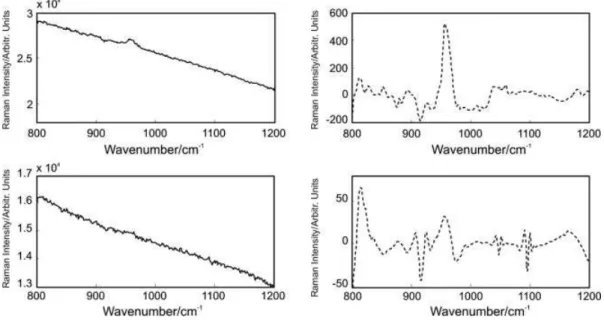
transformation, the background and noise can be removed. Figure 2 displays representative spectra before and after the backgrounds were removed by wavelet reconstruction. The depolarization ratios at 959 cm−1 are 0.07 and 0.14 for these representative spectra of sound enamel and carious enamel, respectively. Some representative Raman spectra of stained sound enamel displaying larger background fluorescence and the corresponding corrected spectra are shown in Fig. 3. The results show that the Raman spectral peaks of enamel that are barely visible due to the interfering fluorescence background can be extracted using this wavelet method. The recovered signal contains spectral peaks that can be used for determining the depolarization ratios. Another example of a stained carious lesion is shown in Fig. 4, where again the broad background is successfully removed using this wavelet reconstruction method. The depolarization ratios of the 959 cm−1 peak were 0.02 and 0.17 for the stained sound enamel and stained carious enamel, respectively for this example.
Table 1. MSE values between original and reconstructed polarized Raman spectra for sound enamel obtained using different Daubechies wavelet (db3–db9) and different Symmlet wavelet (sym3–sym8) parameters at the same level 6
____________________________________________________________________________ ‘db3’ ‘db4’ ‘db5’ ‘db6’ ‘db7’ ‘db8’ ‘db 9’ Parallel-polarized 554 452 525 579 516 471 537 Cross-polarized 174 168 173 176 172 170 174
‘sym3’ ‘sym4’ ‘sym5’ ‘sym6’ ‘sym7’ ‘sym8’ Parallel-polarized 554 518 586 526 468 526 Cross-polarized 174 172 177 172 170 172
Table 2. Comparison of the depolarization ratio derived from the original and reconstructed spectra of varying backgrounds using wavelet function analysis
Original depolarization ratio Reconstructed depolarization ratio
____________________________________________________________________________ Carious enamel 0.1395 0.1389 ± 0.001
Figure 1. Wavelet reconstruction of simulated cross-polarized Raman spectra of sound enamel: (left panel) original spectra with
varying background levels (data 1 is the original spectrum with data 2–9 being the spectra with sequentially increasing background) and (right panel) the corresponding wavelet reconstructed spectra at level 6 using ‘db4’.
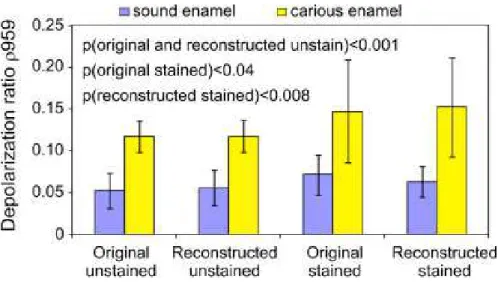
In order to evaluate the effect of the wavelet reconstruction on using the depolarization ratio to discriminate carious lesion from sound enamel, a total of 45 measurements from carious lesions and 33 from sound enamel were examined. Figure 5 illustrates the distribution of ρ959 for both sound enamel and carious enamel in bar graphs before and after reconstruction. Reconstruction does not significantly alter the mean value of the depolarization ratio in each of the four
groupings of samples but it does reduce the variance in each of the groupings, particularly the two groups of stained enamel. Following reconstruction, the mean ρ959 values with standard deviation are as follows: ρ959(S) = 0.0559 ± 0.02 (unstained), ρ959(S) = 0.0629 ± 0.018 (stained) for sound enamel; ρ959(C) = 0.1178 ± 0.019 (unstained), ρ959(C) = 0.1522 ± 0.060 (stained) for carious enamel. A statistical analysis involving t-test performed at 95% confidence interval indicates that the difference in ρ959 between reconstructed sound enamel and
reconstructed carious lesions is statistically significant with p < 0.001 for unstained teeth and p
< 0.008 for stained teeth. Prior to reconstruction, the stained samples were more poorly
distinguished (p = 0.04 (enamel vs caries)). These results indicate that wavelet transform analysis preserves the ability to use the depolarization ratio to discriminate between sound enamel and carious enamel and is particularly effective for stained enamel.
Conclusions
The potential of applying wavelet transform for removing the interfering fluorescence
background of polarized Raman spectra from tooth enamel has been evaluated. This method proved to be very efficient at handling the broad background and noise that is usually found when stained tooth samples are inspected by when stained tooth samples are inspected by Raman spectroscopy.
(a) (b)
Figure 2. Original (solid lines) and reconstructed (dashed lines) polarized Raman spectra of unstained tooth enamel: (a) sound
enamel – P1 polarization, (b) sound enamel – P2 polarization, (c) carious enamel – P1 polarization and (d) carious enamel – P2 polarization.
Figure 3. Representative Raman spectra of stained sound enamel: (a) P1 polarization – original, (b) P1 polarization –
reconstructed, (c) P2 polarization – original and (d) P2 polarization – reconstructed.
The results of background removal by the wavelet transform was deemed to be satisfactory in both simulated and experimental signals because the broad background and noise was removed without significantly altering the spectral shape yet preserving the peak band areas. This was particularly important for calculating the depolarization ratio of the symmetric
phosphate stretching vibration at 959 cm−1. We have previously used this polarization ratio as a quantitative measure to assess the extent of demineralization of enamel.[5,6] Where our
previous investigations showed that other subtraction methods such as linear and polynomial fitting failed to provide adequate separation of stained sound enamel and unstained carious enamel, the current studies show that the wavelet transform technique is an effective and
practical tool to separate the Raman signal of tooth enamel from the background and noise. The multiresolution wavelet method described is computationally efficient and uses established functions within Matlab’s Wavelet Toolbox, which is in principle accessible to all. This open-access concept allows for other groups to use and evaluate these functions without relying on in-house written software and code where it is more difficult for widespread validation. Our studies have shown that the reconstructed signal can be used to differentiate between sound enamel and carious enamel according to the integrated peak intensities of the Raman peak at 959 cm−1 from polarized Raman spectra. Effective background removal using wavelet
transform should enable us to extend the use of this Raman method to detect caries lesions in teeth that are stained. This method would also improve the clinical utility of polarized Raman spectra for early caries assessment.
Figure 4. Representative Raman spectrum of stained carious enamel: (a) P1 polarization – original, (b) P1 polarization –
Figure 5. Bar graphs of the Raman depolarization ratios of the 959 cm−1 peak obtained from sound enamel versus carious enamel.
Mean ± standard deviation values are shown. N = 33 (17 unstained, 16 stained measurements) for sound enamel and N = 45 (30 unstained, 15 stained measurements) for carious enamel. The p-values comparing the means of sound enamel from carious enamel from various statistical analyses are displayed.
Acknowledgements
This research project was supported by a grant from the National Institutes of Health
(R01DE017889). We would like to thank Dr. Cecilia Dong, Dr. Blaine Cleghorn, the Oral Surgery Clinics at the Faculty of Dentistry of the University of Manitoba and Dalhousie University, as well as the staff of various private dental clinics in Winnipeg and Morden, MB, for assisting in
collection of teeth for this study. References
1. E. Wentrup-Byrne, C. A. Armstrong, R. S. Armstrong, B. M. Collins, J. Raman
Spectrosc. 1997, 28, 151.
2. L. E. S. Soares, P. C. S. Liporoni, A. A. Martin, Oper. Dent. 2007, 32, 160.
3. R. Parthasarathy, G. Thiagarajan, X. Yao, Y. P. Wang, P. Spencer, Y. Wang, J. Biomed.
Opt. 2008, 13, 014020.
4. M. A. Latta, J. Adhes. Dent. 2007, 9, 245.
5. A. C. T. Ko, L.-P. Choo-Smith, M. Hewko, L. Leonardi, M. G. Sowa, J. Biomed. Opt. 2005, 10, 03118.
6. C. T. Ko, L.-P. Choo-Smith, M. Hewko, M. G. Sowa, Opt. Express 2006, 14, 203. 7. C.-T. Ko, M.Hewko, M.G. Sowa, C.C. S.Dong, B.Cleghorn, L.-P. Choo-Smith, Opt.
Express 2008, 16, 6274.
8. Huminicki, C. Dong, B. Cleghorn, M. Sowa, M. Hewko, L.-P. Choo- Smith, Int. J. Dent. 2010, 2010, 879252.
9. P. A. Mosier-Boss, S. H. Lieberman, R. Newbery, Appl. Spectrosc. 1995, 49, 630. 10. D. Zhang, D. Ben-Amotz, Appl. Spectrosc. 2000, 54, 1379.
11. A. Lieber, A. Mahadevan-Jansen, Appl. Spectrosc. 2003, 57, 1363. 12. D. Beier, A. J. Berger, Analyst 2009, 134, 1198.
13. Camerlingo, F. Zenone, M. Lepore, Sensors 2008, 8, 3656.
14. Y.G.Hu, J. Tao, A. G. Shen, W. Li, X. P.Wang, J.M.Hu, Chemometr. Intell Lab. Syst. 2007, 85, 26.
15. Q. Li, H. Y. Liao, X. Z. Liu, Electron.Meas. Instrum. 2007, 18, 2. 16. M. R. Pablo, R. Itziar, J. Raman Spectrosc. 2005, 36, 848.
17. A. Cao, A. K. Pandya, G. K. Serhatkulu, R. E. Weber, H. Dai, J. S. Thakur, V. M. Naik, R. Naik, G.W. Auner, R. Rabash, D. C. Freeman, J. Raman Spectrosc. 2007, 38, 1199. 18. G. Li, Second International Symposium on Intelligent Information Technology Application
IITA 08, Shanghai, China, 2008, 1, 535.
19. V. Perov, A. B. Rinkevich, Acoust. Phys. 2005, 51, 443.
20. J. Zheng, Z. Tang, Y. He, L. Guo, J. Appl. Phys. 2008, 103, 093116. 21. T. Char, T. M. Shih, J. B. Gao, C. K. Chan, Appl. Spectrosc. 1996, 50, 339. 22. S. G. Mallat, IEEE Trans. Pattern Anal.Mach. Intell. 1989, 11, 674.
23. S. G. Mallat, Proc. Int. Congress ofMathematicians (ICM), Berlin, 1998, 1, 1. 24. L.M. Shao, X.Q. Lin, X. G. Shao, Appl. Spectrosc. Rev. 2002, 37, 429.