HAL Id: hal-01773876
https://hal.archives-ouvertes.fr/hal-01773876
Submitted on 25 Apr 2018
HAL is a multi-disciplinary open access
archive for the deposit and dissemination of
sci-entific research documents, whether they are
pub-lished or not. The documents may come from
teaching and research institutions in France or
abroad, or from public or private research centers.
L’archive ouverte pluridisciplinaire HAL, est
destinée au dépôt et à la diffusion de documents
scientifiques de niveau recherche, publiés ou non,
émanant des établissements d’enseignement et de
recherche français ou étrangers, des laboratoires
publics ou privés.
Emission (VESTIGE).III. Star formation in the stripped
gas of NGC 4254
A. Boselli, M. Fossati, J. C. Cuillandre, Samuel Boissier, M. Boquien, V.
Buat, D. Burgarella, G. Consolandi, L. Cortese, P. Cote, et al.
To cite this version:
A. Boselli, M. Fossati, J. C. Cuillandre, Samuel Boissier, M. Boquien, et al.. A Virgo Environmental
Survey Tracing Ionised Gas Emission (VESTIGE).III. Star formation in the stripped gas of NGC
4254. Astronomy and Astrophysics - A&A, EDP Sciences, 2018. �hal-01773876�
March 13, 2018
A Virgo Environmental Survey Tracing Ionised Gas Emission
(VESTIGE).III. Star formation in the stripped gas of NGC 4254
?
,
A. Boselli
1??, M. Fossati
2,3, J.C. Cuillandre
4, S. Boissier
1, M. Boquien
5, V. Buat
1, D. Burgarella
1, G. Consolandi
6,7, L.
Cortese
8, P. Cˆot´e
9, S. Cˆot´e
9, P. Durrell
10, L. Ferrarese
9, M. Fumagalli
11, G. Gavazzi
6, S. Gwyn
9, G. Hensler
12, B.
Koribalski
13, J. Roediger
9, Y. Roehlly
14, D. Russeil
1, M. Sun
15, E. Toloba
16, B. Vollmer
17, A. Zavagno
11 Aix Marseille Univ, CNRS, LAM, Laboratoire d’Astrophysique de Marseille, Marseille, France e-mail:
alessandro.boselli@lam.fr, samuel.boissier@lam.fr, veronique.buat@lam.fr, denis.burgarella@lam.fr, delphine.russeil@lam.fr, annie.zavagno@lam.fr
2 Universit¨ats-Sternwarte M¨unchen, Scheinerstrasse 1, D-81679 M¨unchen, Germany
3 Max-Planck-Institut f¨ur Extraterrestrische Physik, Giessenbachstrasse, 85748, Garching, Germany e-mail:
mfossati@mpe.mpg.de
4 CEA/IRFU/SAP, Laboratoire AIM Paris-Saclay, CNRS/INSU, Universit Paris Diderot, Observatoire de Paris, PSL Research
University, F-91191 Gif-sur-Yvette Cedex, France e-mail: jc.cuillandre@cea.fr
5 Universidad de Antofagasta, Unidad de Astronomia, Avenida Angamos 601, Antofagasta 1270300, Chile e-mail:
mederic.boquien@uantof.cl
6 Universit´a di Milano-Bicocca, piazza della scienza 3, 20100, Milano, Italy e-mail: giuseppe.gavazzi@mib.infn.it 7 INAF - Osservatorio Astronomico di Brera, via Brera 28, 20159 Milano, Italy e-mail: guido.consolandi@brera.inaf.it 8 International Centre for Radio Astronomy Research, The University of Western Australia, 35 Stirling Highway, Crawley WA 6009,
Australia e-mail: luca.cortese@uwa.edu.au
9 NRC Herzberg Astronomy and Astrophysics, 5071 West Saanich Road, Victoria, BC, V9E 2E7, Canada e-mail:
laura.ferrarese@nrc-cnrc.gr.ca, patrick.cote@nrc-cnrc.gr.ca, stephen.gwyn@nrc-cnrc.gr.ca, joel.roediger@nrc-cnrc.gr.ca
10 Department of Physiscs and Astronomy, Youngstown State University, Youngstown, OH, USA e-mail: prdurrell@ysu.edu 11 Institute for Computational Cosmology and Centre for Extragalactic Astronomy, Department of Physics, Durham University, South
Road, Durham DH1 3LE, UK e-mail: michele.fumagalli@durham.ac.uk
12 Department of Astrophysics, University of Vienna, T¨urkenschanzstrasse 17, 1180, Vienna, Austria e-mail:
gerhard.hensler@univie.ac.at
13 Australia Telescope National Facility, CSIRO Astronomy and Space Science, P.O. Box 76, Epping, NSW 1710, Australia e-mail:
baerbel.koribalski@csiro.au
14 Astronomy Centre, Department of Physics and Astronomy, University of Sussex, Falmer, Brighton BN1 9QH, UK 15 Physics Department, University of Alabama in Huntsville, Huntsville, AL 35899, USA e-mail: ms0071@uah.edu
16 Department of Physiscs, University of the Pacific, 3601 Pacific Avenue, Stockton, CA 95211, USA e-mail:
etoloba@pacific.edu
17 Observatoire Astronomique de Strasbourg, UMR 7750, 11, rue de l’Universit´e, 67000, Strasbourg, France e-mail:
bernd.vollmer@astro.unistra.fr
ABSTRACT
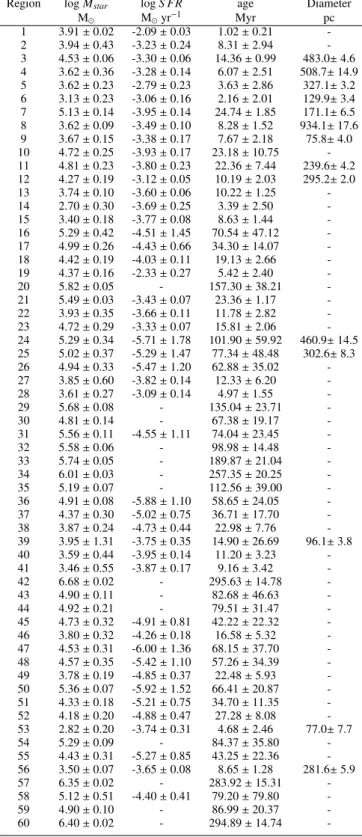
During pilot observations of the Virgo Environmental Survey Tracing Galaxy Evolution (VESTIGE), a blind narrow-band Hα+[NII] imaging survey of the Virgo cluster carried out with MegaCam at the CFHT, we have observed the spiral galaxy NGC 4254 (M99). Deep Hα+[NII] narrow-band and GALEX UV images revealed the presence of 60 compact (70-500 pc radius) star forming regions up to ' 20 kpc outside the optical disc of the galaxy. These regions are located along a tail of HI gas stripped from the disc of the galaxy after a rapid gravitational encounter with another Virgo cluster member that simulations indicate occurred 280-750 Myr ago. We have combined the VESTIGE data with multifrequency data from the UV to the far-infrared to characterise the stellar populations of these regions and study the star formation process in an extreme environment such as the tails of stripped gas embedded in the hot intracluster medium. The colour, spectral energy distribution (SED), and linear size consistently indicate that these regions are coeval and have been formed after a single burst of star formation that occurred. 100 Myr ago. These regions might become free floating objects within the cluster potential well, and be the local analogues of compact sources produced after the interaction of gas-rich systems that occurred during the early formation of clusters.
Key words.Galaxies: individual: NGC 4254; Galaxies: clusters: general; Galaxies: clusters: individual: Virgo; Galaxies: evolution; Galaxies: interactions; Galaxies: ISM
? Based on observations obtained with MegaPrime/MegaCam, a joint
project of CFHT and CEA/DAPNIA, at the Canadian-French-Hawaii Telescope (CFHT) which is operated by the National Research Council (NRC) of Canada, the Institut National des Sciences de l’Univers of the
Centre National de la Recherche Scientifique (CNRS) of France and the University of Hawaii.
?? Visiting Astronomer at NRC Herzberg Astronomy and
Astrophysics, 5071 West Saanich Road, Victoria, BC, V9E 2E7, Canada
1. Introduction
The environment plays a fundamental role in shaping galaxy evolution. Since the work of Dressler (1980), it is clear that clus-ters of galaxies are dominated by early-type systems (ellipticals and lenticulars) which are relatively rare in the field (see also Whitmore et al. 1993). It is also well established that late-type galaxies in dense environments have a lower atomic gas con-tent than their isolated counterparts (Haynes & Giovanelli 1984; Cayatte et al. 1990; Solanes et al. 2001; Gavazzi et al. 2005) with several recent indications that this occurs also for the molecu-lar gas phase (Fumagalli et al. 2009; Boselli et al. 2014a) and the dust content (Cortese et al. 2010; 2012a). The gas removal, which begins in the outer regions and progress inwards, leading to truncated discs (Cayatte et al. 1994; Boselli et al. 2006), in-duces a decrease of the star formation activity, as it is systemat-ically observed in nearby clusters (e.g. Kennicutt 1983; Gavazzi et al. 1998; Gomez et al. 2003; Boselli et al. 2014b).
Since the discovery of these systematic differences between galaxies in rich environments from those in the field, observers, modelers and simulators made great strides in identifying the dominant physical mechanism responsible for the gas removal and for the subsequent quenching of the star formation activ-ity, as reviewed in Boselli & Gavazzi (2006, 2014). The de-tailed observations of local galaxies with strong signs of an on-going perturbation (Kenney et al. 2004, 2014; Gavazzi et al. 2001; Vollmer et al. 2006, 2008a,b, 2009, 2012; Sun et al. 2007; Boselli et al. 2006, 2016a; Scott et al. 2012), the analysis of lo-cal samples of cluster galaxies (Gavazzi et al. 1998, 2010, 2013; Boselli et al. 2008ab, 2014b, 2016b), as well as finely tuned models and simulations of representative objects (Roediger & Hensler 2005; Roediger & Bruggen 2007, 2008; Tonnesen & Bryan 2009) suggest that the dominant process in local clusters is the ram pressure (Gunn & Gott 1972) exerted by the dense intracluster medium on the interstellar medium of galaxies mov-ing at high velocity within the cluster. On the other hand, the sta-tistical analysis of large samples of galaxies extracted from the SDSS spanning a wide range of density, combined with hydro-dynamic cosmological simulations, favour a less violent interac-tion able to remove only the hot gas halo and thus stop the the infall of fresh material, thus reducing the activity of star forma-tion only once the the cold gas on the galaxy discs has been fully transformed into stars (starvation - Larson et al. 1980). Other processes, such as galaxy harassment (Moore et al. 1998), might have significantly contributed during the accretion of galaxies in massive clusters via small groups (pre-processing, Dressler 2004) and may still be dominant under specific conditions.
So far, however, there has been no systematic efforts to study the fate of the stripped gas. This situation is mainly due to two major reasons: 1) the difficulty in observing the gas once removed from the galactic disc, and thus to provide stringent constraints to models and simulations; 2) the difficulty in sim-ulating the dynamical evolution of the gas properties within a complex and inhomogeneous cluster environment (density, tur-bulence, temperature) in its different phases (atomic, molecular, ionised, hot) and at different scales (from molecular clouds on pc scales to tails 50-100 kpc long). One of the first detections of stripped material in cluster late-type galaxies is the observations of ∼ 50 kpc long radio continuum tails (synchrotron emission) in three galaxies at the periphery of A1367 (Gavazzi & Jaffe 1985, 1987; Gavazzi et al. 1995). Their cometary shape has been inter-preted as a clear evidence of an ongoing ram pressure stripping event. Deep narrow-band Hα observations of the same galaxies have highlighted long tails of ionised gas (Gavazzi et al. 2001),
suggesting that the cold atomic hydrogen might change phase once in contact with the hot intracluster medium via e.g., thermal evaporation (Cowie & Songaila 1977). Indeed, the observations of tails of neutral atomic gas (HI) are still quite uncommon: only a few cases are known in nearby clusters (Virgo - Chung et al. 2007; A1367 - Scott et al. 2012). The situation changed recently thanks to the advent of large panoramic detectors mounted on 4 metre class telescopes with narrow-band filters, that allowed the detection of tails of ionised gas after very deep exposures in sev-eral galaxies in Virgo (Yoshida et al. 2002; Kenney et al. 2008; Boselli et al. 2016a), Coma (Yagi et al. 2010; Fossati et al. 2012), Norma (Sun et al. 2007; Zhang et al. 2013), and A1367 (Gavazzi et al. 2001; Boselli & Gavazzi 2014; Yagi et al. 2017). A further observational constraint came from X-ray observations, which allowed the detection of hot gas within these tails (Sun et al. 2006). It comes also from long-slit (Yoshida et al. 2012; Yagi et al. 2013) or IFU spectroscopic observations (Fumagalli et al. 2014; Fossati et al. 2016; Poggianti et al. 2017; Bellhouse et al. 2017; Fritz et al. 2017; Consolandi et al. 2017), which are funda-mental for understanding the kinematic of the stripped gas and its chemical composition and physical state. Recently, also CO observations have been made possible for the detection of the molecular gas phase (Jachym et al. 2013, 2014, 2017; Verdugo et al. 2015).
A surprising result of these recent studies is that only in a few cases does the stripped gas collapse to form stars outside the disc of the perturbed galaxy. This generally happens within compact H ii regions dominated by young stellar populations (Hester et al. 2010; Fumagalli et al. 2011a; Fumagalli et al. 2014; Fossati et al. 2016; Consolandi et al. 2017). There are indeed several instances within the Virgo cluster where the stripped gas remains diffuse in its atomic neutral (Boissier et al. 2012) or ionised (Boselli et al, 2016a) phase and does not collapse to form new stars, while in other objects a star formation event occurs (Hester et al. 2010; Fumagalli et al. 2011a; Arrigoni-Battaia et al. 2012; Kenney et al. 2014). This observational evidence is in contrast with the re-sults of models and simulations which systematically predict the formation of new stars outside the galaxy disc (Kapferer et al. 2009; Tonnesen & Bryan 2010, 2012), an indication that the physical prescriptions used in the models need still to be refined. VESTIGE (A Virgo Environmental Survey Tracing Ionised Gas Emission; Boselli et al. 2018, paper I) is a deep narrow-band Hα imaging survey of the Virgo cluster carried out with MegaCam at the CFHT. This survey is providing us with a unique opportunity to study the fate of the stripped gas in cluster galaxies, being the first complete narrow-band imaging survey of a nearby cluster up to its virial radius (covering an area of 104o2). Thanks to its unique sensitivity ( f (Hα) ∼ 4 × 10⁻¹⁷erg sec−1cm−2- 5σ detection limit for point sources andΣ(Hα) ∼ 2 × 10⁻¹⁸erg sec−1cm−2arcsec−2- 1σ detection limit at 3 arcsec resolution for extended sources) and subarcsecond image qual-ity, VESTIGE will detect the diffuse ionised gas stripped from the perturbed galaxies, as well as compact H ii regions of lumi-nosity L(Hα) ≥ 1036 erg s−1. VESTIGE will also benefit from the large number of available multifrequency data for the Virgo cluster, from the X-ray to the radio, which are necessary for a coherent and complete analysis of the multiphase gas (Boselli et al. 2017). The use of Hα data with respect to other star formation tracers is crucial if we want to study the process of star forma-tion on timescales of. 10 Myr (Boselli et al. 2009; Boquien et al. 2014). This is necessary whenever the perturbing process is rapid (. 500 Myr), as indeed expected within a rich cluster such as Virgo (Boselli et al. 2016b).
This paper is dedicated to the study of the spiral (SA(s)c) galaxy NGC 4254 (M99) located at the northern periphery of the cluster at ' 1.0 Mpc from M87 (' 0.7 × Rvir). The pres-ence of a ' 250 kpc long tail of HI gas indicates that the galaxy has been gravitationally perturbed after a rapid encounter with another Virgo cluster member (Haynes et al. 2007). The inter-action is thought to be responsible for the creation of a free floating HI cloud of gas not associated to any stellar compo-nent, the so called dark galaxy Virgo HI21 (Minchin et al. 2005). Dedicated simulations suggest that this interaction occurred ∼ 280 - 750 Myr ago (Vollmer et al. 2005; Bekki et al. 2005; Duc & Bournaud 2008). The same simulations indicate that, during a rapid galaxy-galaxy encounter (galaxy harassment - Moore et al. 1998), only the gaseous component is perturbed leving the stellar disc intact (Duc & Bournaud 2008). What happens to the stripped gas? Why is it still in its cold atomic phase? Being still cold, can it collapse and form new stars outside the galaxy disc and, if so, under what conditions? NGC 4254 is thus an ideal laboratory for studying the star formation process in extreme and unusual conditions, and another candidate to extend previ-ous studies to different environments (Boquien et al. 2007, 2009, 2010, 2011; Fumagalli et al. 2011a; Arrigoni-Battaia et al. 2012; Jachym et al. 2013, 2014, 2017; Kenney et al. 2014; Lisenfeld et al. 2016).
In this paper, we search for and study the properties of ex-traplanar H ii regions formed after the interaction of the galaxy within the hostile cluster environment. We do that by using the unique set of multifrequency data sensitive to the youngest stellar populations available for this representative galaxy com-bined with SED fitting models. The narrow-band Hα observa-tions and data reduction are described in Sect. 2. The multifre-quency dataset used in the analysis are described in Sect. 3, while Sect. 4 and 5 describe respectively the identification of the extra-planar H ii regions and the derivation of their physical parame-ters. The discussion is given in Sect. 6. Given its position within the cluster, we assume the galaxy to be at a distance of 16.5 Mpc (Gavazzi et al. 1999; Mei et al. 2007; Blakeslee et al. 2009). All magnitudes are given in the AB system.
2. Observations and data reduction
The galaxy NGC 4254 has been observed during the second run of pilot observations of the VESTIGE survey in spring 2016 (see Boselli et al. 2017 for details). The observations have been car-ried out with MegaCam at the CFHT using the new narrow-band filter MP9603 (λc= 6590 Å; ∆λ = 104 Å, T = 93%) which in-cludes at the redshift of the galaxy (vel= 2404 km s−1) the Hα line (λ= 6563 Å) and the two [NII] lines (λ =6548, 6583 Å)1. The camera is composed of 40 CCDs with a pixel scale of 0.187 arcsec/pixel. The galaxy has been observed using the pointing-macro QSO LDP-CCD7 especially designed for the Elixir-LSB data reduction pipeline. This macro is composed of 7 different pointings overlapping over a region of 40×30 arcmin2. To se-cure the determination of the stellar continuum, the galaxy was also observed in the r-band filter. The integration time for each single pointing within the macro was of 66 sec in the r-band and 660 sec in the narrow-band filter. The macro was run two times, thus the total integration time in the central 40×30 arcmin2 of the combined image is of 924 sec in r-band and 9240 sec in narrow-band.
1 Hereafter we will refer to the Hα+[NII] band simply as Hα, unless
otherwise stated.
The data reduction has been completed using the standard procedures adopted for the VESTIGE data (extensively de-scribed in paper I). The MegaCam images have been reduced us-ing Elixir-LSB, a data reduction pipeline optimised to detect the diffuse emission of extended low surface brightness features as-sociated with the perturbed galaxies by removing any contribu-tion of scattered light in the different science frames. This proce-dure, tuned to detect low surface brightness features, is perfectly adapted for the narrow-band frames whenever the images are background dominated, as is the case for those obtained in this work (see Boselli et al. 2016a). The photometric calibration of the r-band filter has been derived using the standard MegaCam calibration procedures (Gwyn 2008). Those in the narrow-band filter have been done as described in Fossati et al. (in prep.). The typical uncertainty is 0.01 mag in both bands. The single images were stacked and an astrometric correction was applied using the MegaPipe pipeline (Gwyn 2008). As for the VESTIGE sur-vey, the sensitivity is of f (Hα) ∼ 4×10⁻¹⁷erg s−1cm−2for point souces (5σ) and Σ(Hα) ∼ 2×10⁻¹⁸ erg s−1 cm−2 arcsec−2 for extended sources (1σ detection limit at ∼ 3 arcsec resolution), while the depth in the r-band is 24.5 AB mag (5σ) for point sources and 25.8 AB mag arcsec−2 (1σ) for extended sources. The mean image quality is of 0.60 arcsec in the r-band and 0.56 arcsec in the narrow-band filter.
3. Multifrequency data
The Virgo cluster region has been the target of several multifre-quency blind surveys. These data are crucial for the identification of the stellar population dominating any extraplanar star forming region.
3.1. GALEX
Two very deep GALEX exposures are available for the galaxy NGC 4254 in the FUV (λc= 1539 Å, ∆λ = 442 Å; integration time 18131 sec) and NUV (λc= 2316 Å. ∆λ = 1060 Å; integra-tion time 27726 sec) bands (Boselli et al. 2011). For these ex-posure times, the limiting magnitude for point sources is FUV ∼ 25.3 AB mag and NUV ∼ 24.9 AB mag (Voyer et al. 2014), while for extended sources is ∼ 29.7 mag arcsec−2in both bands. The GALEX images have a pixel size of 1.5 arcsec, and an an-gular resolution of 4.0 arcsec FWHM in the FUV and 5.6 arcsec in the NUV. The photometric accuracy of the instrument is of 0.05 AB mag in FUV and 0.03 in NUV, while the astrometric accuracy is of 0.5 arcsec in both bands (Morrissey et al. 2007).
3.2. Optical
Very deep optical images in the u, g, i and z bands are avail-able from the NGVS survey taken with MegaCam at the CFHT (Ferrarese et al. 2012). Their depth is ∼ 1 mag deeper than the VESTIGE r-band images. The photometric and astrometric ac-curacy, and angular resolution of NGVS in these photometric bands is comparable to that reached in the r- and in the narrow-band filters.
3.3. Near- and far-IR
NGC 4254 has been observed in the near- and far-infrared by Spitzer with IRAC at 3.6, 4.5, 5.8, and 8.0 µm (Cielsa et al. 2014) and MIPS at 24 µm and 70 µm (Bendo et al. 2012) dur-ing the SINGS survey (Kennicutt et al. 2003), and by Herschel
≈ 4.8 kpc
12h19m00s
18m50s
40s
30s
14
◦28’00”
26’00”
24’00”
22’00”
20’00”
R.A. (J2000)
Dec
(J2000)
Fig. 1. Colour ugi RGB image of the galaxy NGC 4254 obtained using the NGVS data (Ferrarese et al. 2012). At the distance of the galaxy (16.5 Mpc), 1 arcmin= 4.8 kpc. The star forming regions analysed in this work are the blue blobs in the south-west outside the disc of the galaxy.
with PACS at 100 µm and 160 µm (Cortese et al. 2014) and SPIRE at 250, 350, and 500 µm (Ciesla et al. 2012) as part of the HeViCS (Davies et al. 2010) and HRS (Boselli et al. 2010) surveys. Near-IR data are also available from the WISE survey (Wright et al. 2010). Given the compact nature of the extrapla-nar H ii regions analysed in this work, and their weak emission, the following analysis will use only the four IRAC and MIPS 24 µm bands, where the angular resolution and the sensitivity of the instruments allow the detection or the determination of strin-gent upper limits for the H ii regions observed in the UV and optical bands. None of the sources has been detected at longer wavelengths.
3.4. HI and CO
The discovery of an ongoing perturbation on the disc of NGC 4254 due to a flyby encounter with another Virgo cluster member has been made possible by HI observations. VLA ob-servations first revealed the presence of HI blobs located along a diffuse feature starting at the south-west edge of the stellar disc and extending ∼ 30 kpc to the north-west (Phookun et al. 1993). The galaxy has been observed in HI also at Effelsberg (Vollmer
et al. 2005), Parkes (Wong et al. 2006), and with the VLA (Chung et al. 2009). More recent low angular resolution HI observations taken with the Arecibo radio telescope during the ALFALFA (Giovanelli et al. 2005) survey of the Virgo cluster indicate that this tail of HI gas is much more extended than previously thought (∼ 250 kpc, to be compared to the isophotal radius of the galaxy which is 13 kpc) and links NGC 4254 to the tidal debris Virgo HI21 (Davies et al. 2004; Minchin et al. 2005; Bekki et al. 2005). The total mass of HI gas in this tail is estimated at (4.8±0.6) × 108 M
and its column densityΣ(HI) ∼ 3 × 1018cm−2(Haynes et al. 2007), while the HI blobs in the tail detected at the VLA haveΣ(HI) ∼ 1019cm−2at a resolution of ' 30 arcsec. The asymmetric distribution of the gas over the disc of the galaxy, with the presence of a low surface brightness tail in the northern part (Phookun et al. 1993), and the presence of a radio continuum extended tail (Kantharia et al. 2008), suggest that the galaxy is also suffering ram pressure stripping.
NGC 4254 has been also observed in12CO(2-1) during the HERACLES survey of nearby galaxies using the IRAM 30m ra-dio telescope, with an angular resolution of 13 arcsec, a velocity resolution of 2.6 km s−1, and a typical RMS of 20-25 mK (TMB
scale; Leroy et al. 2009). Unfortunately the final map covers only ∼ 1/3 of the extraplanar H ii regions of NGC 4254, and does not detect any of them.
4. Extraplanar H
ii
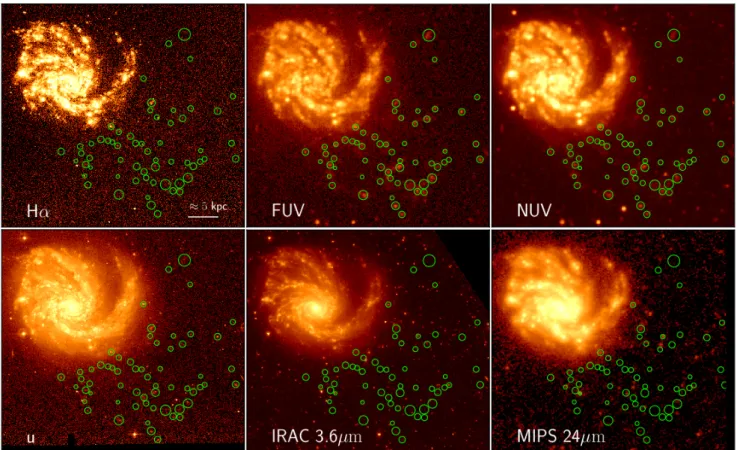
regionsFigure 2 shows the multifrequency images of NGC 4254. The FUV and NUV images indicate the presence of several blue compact objects in the south-west periphery of the galaxy ex-tending up to ∼ 20 kpc outside the optical disc. These star form-ing complexes have been already noticed by Thilker et al. (2007) who identified them as part of a standard extended UV disc. Among these we selected in the FUV GALEX image those lo-cated at the edge of the prominent south-west spiral arm or out-side the stellar disc of NGC 4254, with a compact morphology, and avoiding extended diffuse structures. We then rejected those with typical morphologies of background galaxies as seen in the higher quality optical images. We identify 60 of these compact regions as depicted in Fig. 3. These objects are all detected in the NUV image, 30 of them also in the VESTIGE Hα continuum-subtracted image, while 34, 26, 24, 21, and 16 in the ugriz im-ages, respectively. The VESTIGE and NGVS images indicate that these sources are very compact since only barely resolved in these subarcsecond resolution frames. Although this sample is not complete in any sense, we are confident that it is statistically representative of the extraplanar young stellar regions associated to NGC 4254.
The FUV GALEX image alone does not allow us to firmly state whether these blue compact regions are all associated to the galaxy or are foreground or background objects. However, their relative distribution with respect to NGC 4254 and to the HI tail of stripped gas detected either in the VLA (Chung et al. 2009) or in the ALFALFA HI data (Haynes et al. 2007), as shown in Fig. 4, strongly suggests that they are star forming regions formed within the stripped gas of the galaxy. Surprising is the fact that these star forming regions are only present within. 20 kpc from the edge of the stellar disc of the galaxy, while they are totally ab-sent in the rest of the HI tail. We can estimate the contamination of background objects using the FUV GALEX number counts derived by Xu et al. (2005). At the limiting magnitude of our detections (FUV ' 24 mag) the number of background sources is ∼ 1000 deg−2, thus ∼ 6-7 over the ∼ 6’ × 4’ region outside NGC 4254 analysed in this work (∼ 10%). We also measured the mean background source density down to a limiting magni-tude of FUV ≤ 24 mag and detected with a signal-to-noise of S N >5 within the whole GALEX FUV frame (0.5 deg radius) once the bright Virgo galaxies (NGC 4254, NGC 4262, NGC 4298) have been masked. This density is ∼ 2300 deg−2, thus the expected contamination is ∼ 15 objects in the studied re-gion. Since the background distribution slightly changes within the FUV frame, we also measured the density of FUV emitting sources with properties similar to those analysed in this work in a corona centered on NGC 4254 of inner radius 210 arcsec and outer radius 400 arcsec, where all the studied regions are located. Considering as reference the density within this corona, the number of expected contaminants is ∼ 10 objects.
The coordinate of these regions are given in Table 1. To study the stellar populations of these compact regions we extract their fluxes in the different photometric bands using the apertures shown in Fig. 3. All these apertures have a radius rap& 4 arcsec to encompass the total flux of the emitting region in the different photometric bands, including those diffraction limited
(FUV, NUV, 24 µm Spitzer/MIPS; see Table 12). At the same time they are sufficiently small (rap≤ 10 arcsec, where rapis the radius of the regions plotted in Figs. 2 and 3 encompassing all the FUV emission in the GALEX frame) to limit the contamina-tion of background or local point sources. We notice, however, that despite the small size of the aperture, in some cases the high resolution MegaCam images in Hα or in the broad bands reveal the presence of more than a single source unresolved by GALEX. None of these regions is detected at wavelengths longer than 24 µm. To have the most accurate estimate of the flux of each emitting region, or measure a stringent upper limit, the sky background is derived in the same apertures randomly displaced around the region itself once the other sources, and the diffuse emission of the galaxy is masked. This procedure is repeated 1000 times, minimising any uncertainty on the sky background determination. As in Fossati et al. (2018), the uncertainties on the fluxes are obtained as the quadratic sum of the uncertain-ties on the flux counts and the uncertainuncertain-ties on the background (rms of the bootstrap iterations). The uncertainties on the flux counts are derived assuming a Poissonian distribution for the source photons. We assume as detected those sources with S /N > 3. For the undetected sources, we estimate an upper limit to the flux. Flux densities, corrected for Galactic extinction follow-ing Schlafly & Finkbeiner (2011) (E(B − V)= 0.034) combined with the reddening law of Fitzpatrick (1999), with their uncer-tainty and 1σ upper limits, are listed in Table 1. For consistency with the other photometric bands, the Hα flux is given as LyC (in units of µJy), the flux in the Lyman continuum pseudo filter PS EU DOLyCderived as described in Boselli et al. (2016b):
LyC[mJy]=1.07 × 10
−37× L(Hα) [erg s−1]
D2[Mpc] (1)
5. Physical parameters
5.1. Hα luminosities
The narrow-band filter encompasses the Hα line at λ = 6563 Å and the two [NII] lines at λ= 6548 and λ = 6583 Å. To mea-sure the Hα luminosity of these extraplanar H ii regions shown in Fig. 3 we have first to remove the [NII] contribution. Since no spectroscopic data are available, we apply a mean standard correction. The typical [NII]λ6583/Hα ratio in extragalactic H ii region is [NII]λ6583/Hα . 0.3 (e.g. McCall et al. 1985; Kewley et al. 2001; Sanchez et al. 2015), with a ratio decreasing radi-ally from the nucleus to the outer disc (Kennicutt et al. 1989; Ho et al. 1997). H ii regions formed within the stripped gas of some perturbed galaxies have been observed in nearby clusters. Spectroscopic observations of these peculiar regions give quite different estimates of the [NII]λ6583/Hα line ratio, ranging from 0.1 to 1 in the tails of two galaxies in the Coma cluster (Yoshida et al. 2012), to ' 0.4 in ESO 137-001 (Fossati et al. 2016), and ' 0.2 in the perturbed galaxy JO206 recently observed with MUSE by Poggianti et al. (2017). Given that the extraplanar H ii regions of NGC 4254 have been formed after the collapse of the stripped gas which has been removed from the outer disc of the galaxy after a rapid encounter with another cluster member, we expect a low metallicity environment. Indeed, the mean metallicity of NGC 4254 is 12+log O/H = 8.73 (Hughes et al. 2013), but the galaxy has a steep metallicity gradient suggesting that the metal-licity in the outer disc is 12+log (O/H) ∼ 8.5 (Skillman et al.
2 An aperture correction has been applied to the only region detected
Fig. 2. Multifrequency images of the galaxy NGC 4254 (north is up, east is left). Upper panels, from left to right: continuum-subtracted Hα (VESTIGE), FUV (GALEX), NUV (GALEX); lower panels: u-band (NGVS), IRAC 3.6 µm (Spitzer), MIPS 24 µm (Spitzer). The extraplanar star forming regions, marked with green circles, are evident in FUV image at the south-west of the galaxy. The linear size of each single image corresponds 40×35 kpc2at the distance of the galaxy.
1996). This metallicity also corresponds to that observed in the outer discs of spiral galaxies (12+log (O/H) ∼ 8.45, Sanchez-Menguiano et al. 2016; Bresolin 2017). We thus assume for the correction [NII]λ6583/Hα = 0.2 (Pettini & Pagel 2004). We also assume a mean dust attenuation of A(Hα)= 0.7, a value con-sistent with those observed in the extraplanar H ii regions of the same perturbed galaxies (0. A(Hα). 1 mag - Fossati et al. 2016; Poggianti et al. 2017), in the outer discs of late-type galaxies (0. A(Hα). 2 mag - Kennicutt et al. 1989; Sanchez et al. 2015), or in UV extended discs (A(Hα) ' 0.7 mag - Bresolin et al. 2009, 2012).
Figure 5 shows the distribution of the Hα luminosity of the detected and undetected extraplanar H ii regions of NGC 4254. Figure 5 also shows how the distribution would shift assuming different corrections for dust attenuation (A(Hα) = 0.0 - 1.5) or [NII] contamination ([NII]λ6583/Hα = 0.0 - 0.5). The lumi-nosity of the H ii regions is in the range 1037 . L(Hα) . 1039 (erg s−1), and corresponds thus to the typical luminosity of giant or super-giant Galactic or extragalactic H ii regions (Lee et al. 2011).
5.2. Colour analysis
The blue colours of the H ii regions seen in Figures 2 and 3 indi-cate that they are dominated by very young stellar populations. The fact that they are all detected in the two UV bands, while only a few are in the Hα and u-band, and most undetected at longer wavelengths suggests that they have been formed by a
single coeval, short-lived burst of star formation. To estimate their typical age we first compare their observed (Hα - FUV) and (FUV - NUV) age-sensitive colours to the typical synthetic colours of H ii regions derived assuming a star formation history defined as:
S FR(t)= t × e−τt M yr−1 (2)
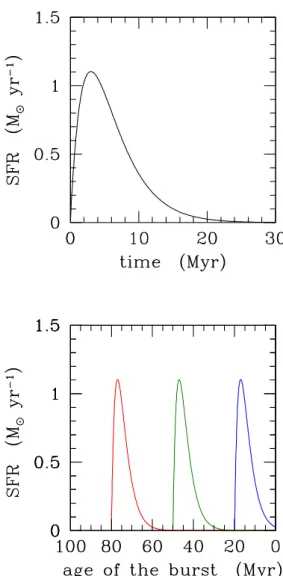
the form of which is shown in Fig. 6 (upper panel). The τ e-folding time is set to 3 Myr, consistent with the typical age of giant (L(Hα) ' 1037erg s−1) H ii regions in the Milky Way or in other nearby galaxies (Copetti et al. 1985; Tremblin et al. 2014). This approach is similar to the one adopted by Fumagalli et al. (2011a) for dating the H ii regions of IC3418 and Boquien et al. (2007) for the intergalactic star forming regions around NGC 5291. We then estimate the typical colour of the synthetic H ii regions assuming that the burst of star formation occurred at dif-ferent epochs (Fig. 6, lower panel). The synthetic colours are de-rived using the CIGALE SED fitting code (Noll et al. 2009), as-suming the Bruzual & Charlot (2003) population synthesis mod-els for the stellar emission with a Salpeter IMF and an updated version of the Draine & Li (2007) physical models of dust sion (see Boselli et al. 2016b for details). To use the Hα emis-sion as a constraint in the fit, we convert the extinction corrected Hα fluxes into number of ionising photons as in Boselli et al. (2016b). We assume an escape fraction of the ionising radiation equal to zero, and that the ionising radiation is not absorbed by dust before ionising the gas (e.g. Boselli et al. 2009). The models are determined assuming different values for the dust attenuation
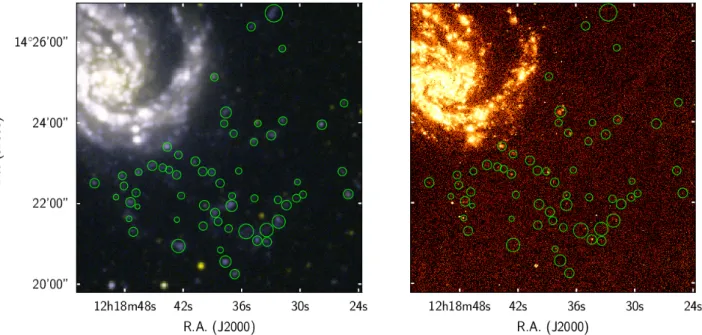
Fig. 3. FUV/NUV GALEX colour (left) and continuum-subtracted Hα (VESTIGE; right) magnified images of the extraplanar star forming regions (marked with green circles) in the south-west quadrant of NGC 4254. The UV colour image shows that these regions have very blue colours, and are thus dominated by young stellar populations (. 100 Myr). Half of them, however, are undetected in Hα, indicating that their typical age is 10 Myr. age . 100 Myr.
12h22m00s 20m00s 18m00s 15◦20’00” 00’00” 14◦40’00” 20’00” 00’00” R.A. (J2000) Dec (J2000) 2285 2260 2250 2220 2404 2270 2315 2240 2220 2220 12h19m00s 18m40s 20s 00s 14◦30’ 25’ 20’ R.A. (J2000)
Fig. 4. The VLA HI contours at a column densityΣ(HI) = 1019cm−2(from Chung et al. 2009; red) and the Arecibo HI contours at a column densityΣ(HI) = 1-2 × 1019cm−2(from Haynes et al. 2007; white) are superposed on the GALEX FUV/NUV colour image. The right panel is a magnified view of the boxed region marked in the left panel with a dashed line. The typical velocity of the different HI structures detected at the VLA are given. The yellow and cyan ellipses at the lower left corner of the two images show the beam sizes at Arecibo (3.30× 3.80) and at the VLA (30.8600× 28.0700).
of the stellar continuum (E(B − V)= 0.0, 0.1, 0.2), as expected if their metallicity and dust content change from region to re-gion. Geometrical effects on the stellar continuum related to the age of the stellar population are taken into account by using the Calzetti et al. (2000) attenuation law. To combine in a colour in-dex the Hα line flux emission to the broad-band monochromatic flux FUV (in units of mag) we define the Hα-FUV colour index as:
Hα − FUV= −2.5 × log(LyC) + 20 − FUV (3)
where LyC is the flux in the Lyman continuum pseudo filter PS EU DOLyC (in units of µJy) as defined in eq. (1). Figure 7 shows how the Hα-FUV and FUV-NUV colour indices vary as a function of the age of the burst. Clearly the two colour in-dices are sensitive to the age of the H ii regions, the Hα-FUV to ages. 150 Myr, the FUV-NUV to ages in the range 500 . age . 1000 Myr. Only the former can be used on the present set of data: the FUV-NUV colour index, indeed, gradually in-creases from FUV-NUV ' 0 mag at age= 0 Myr to FUV-NUV
Fig. 5. Upper panel: the Hα luminosity distribution of the extra-planar H ii regions of NGC 4254. The black shaded histogram indicates the Hα detected regions, the red histogram the distri-bution of the upper limits. The vertical dashed line shows the detection limit of VESTIGE, the vertical dotted line the median value for the Hα luminosity distribution of the detected sources. The error bars show how the median value of the distribution would shift assuming different corrections for dust attenuation (A(Hα= 0.0 -1.5) or [NII] contamination ([NII]λ6583/Hα = 0.0 - 0.5). Lower panel: the distribution of the inferred stellar mass. The black open histogram shows the distribution of all the H ii regions.
' 0.6 mag at age= 1000 Myr, a too limited variation compared to the observed distribution of the FUV-NUV colour index and its large uncertainty (' 0.2 mag). Figure 7 suggests that the age of the extraplanar H ii regions of NGC 4254 is . 100 Myr. This is also the case for the H ii regions undetected in Hα (age & 10 Myr) and in the u-band (age. 200 Myr).
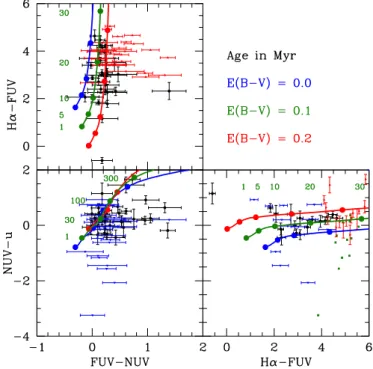
The observed colours of these H ii regions can also be com-pared to the evolutionary tracks derived by CIGALE in different photometric bands sensitive to young stellar populations, Hα, FUV, NUV, and u (Fig. 8). Again, despite the large photomet-ric uncertainties on the data, or the large number of undetected sources in some of the photometric bands, the colours of the
Fig. 6. Upper panel: the delayed star formation history with an e-folding time of 3 Myr assumed to fit the observed SED of the extraplanar H ii regions of NGC 4254. Lower panel: the typical age of their dominant stellar population is the age of the burst (80 Myr - red, 50 Myr - green, 20 Myr - blue).
H ii regions are all consistent with very young ages (0-50 Myr). Figure 8 also shows the presence of several outliers with colours significantly different than those predicted by the evolutionary tracks. A clear example are those with FUV − NUV > 0.4 in the upper panel. The visual inspection of those detected in Hα on the high resolution MegaCam images revealed the presence of mul-tiple sources unresolved in the GALEX frames. If these single H ii regions have different star formation histories, it is plausible that their UV colour in the unresolved GALEX images does not follow the proposed evolutionary tracks.
5.3. SED fitting
We estimate the age of each single H ii region using the CIGALE SED fitting code assuming the same configuration given above, i.e. the star formation history given in eq. (1), the Bruzual & Charlot (2003) population synthesis models derived for a Salpeter IMF, coupled with the Draine & Li (2007) dust mod-els. We fit all (11) photometric bands from the FUV to the Spitzer/MIPS 24 µm with the exception of the r-band where the
Fig. 7. Left panels: variations of the Hα-FUV (upper) and FUV − NUV (lower) age-sensitive colour indices as a func-tion of time derived for the star formafunc-tion history given in eq. 1. Different colours are used for three different dust attenuations: E(B − V)young= 0.0 (blue), 0.3 (green), and 0.6 (red). The black solid line shows the median of the observed colour distribution, the grey lines the 16% and the 84% quartiles of the distribu-tion. Right panels: distribution of the two colour indices for the detected (black) and undetected (red - lower limit) H ii regions. contamination of the emitting Hα line can be dominant com-bined with the Hα emission using the PS EU DOLyCpseudo fil-ter as in Boselli et al. (2016b), and treating upper limits as in Sawicki (2012). Upper limits in the far-infrared bands are used to constrain the dust attenuation in the star forming regions. The grid of models is created using the parameters listed in Table 2 (244620 models).
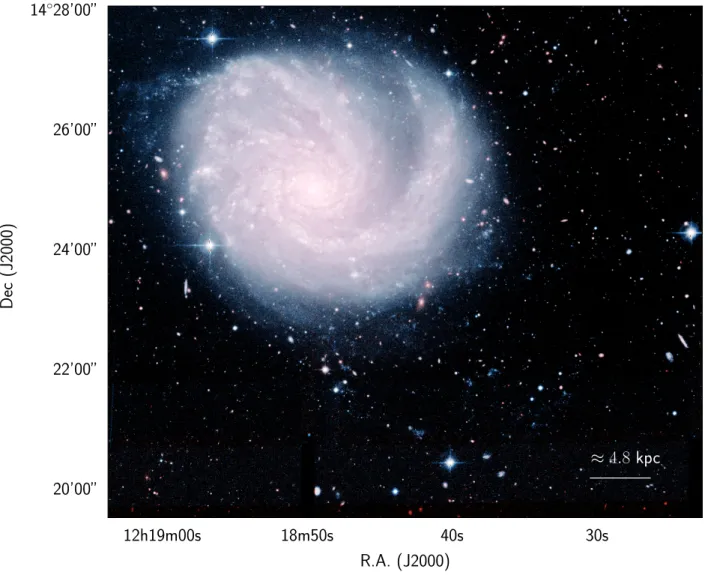
The output of the fit (star formation rates, stellar masses, ages, and their uncertainties, self-consistently determined as-suming the star formation history given in eq. 1) for each single H ii region are given in Table 3. To quantify how the ages of the regions depend on the assumed dust attenuation and [NII] con-tamination corrections on the Hα flux we compare in Fig. 9 two sets of values derived assuming in the first one [NII]λ6583/Hα = 0.1 and A(Hα)=0.0, in the second [NII]λ6583/Hα = 0.2 and A(Hα)=0.7. We also test the reliability of the output parame-ters and their uncertainties given in Table 3 by creating a pho-tometric mock catalogue introducing in the observed data some extra noise randomly distributed according to a Gaussian curve of standard deviation equal to the median error for each band, and re-fit the data using the same SED models (see Giovannoli et al. 2011, Boquien et al. 2012, and Ciesla et al. 2014 for de-tails). We follow this step twice, the first time keeping the quite uncertain [NII] contamination and Hα attenuation given in Sect. 5.1 ([NII]λ6583/Hα = 0.2, A(Hα) = 0.7), and the second time assuming more extreme values ([NII]λ6583/Hα = 0.1, A(Hα) = 0.0), and compare the output of the fit in Fig. 10. Figures 9 and 10 clearly show that, despite the number of parameters used to create the model SEDs, the large uncertainty on the photometric data and that on the corrections on the [NII] contamination and
Fig. 8. Age-sensitive colour-colour diagrams. Upper left: Hα-FUVvs. FUV − NUV, lower left: NUV − u vs. FUV − NUV, lower right: NUV − u vs. Hα-FUV. Black filled dots are for re-gions detected in all bands, red filled triangles are lower limits in Hα-FUV, blue filled triangles upper limits in NUV − u, and green open squares regions undetected in Hα and in the u-band. The blue, green, and red filled dots and solid lines indicate the expected colours at different ages (in Myr) for the assumed star formation history for an E(B − V)Y = 0.0, 0.3, and 0.6, respec-tively.
on the Hα attenuation, the stellar masses and the ages of the H ii regions derived by the SED fitting code do not vary significantly. The mean age of the stellar population is systematically under-estimated whenever A(Hα) is overunder-estimated. the opposite is true when [NII]/Hα is overestimated. Star formation rates are instead very uncertain once they are below 10−4M yr−1. The SED fit-ting analysis thus confirms the results obtained from the colour analysis done in the previous section, i.e. that these H ii regions have been formed with a few exception. 100 Myr ago. Some of these exception might be background galaxies.
5.4. Dynamical age
It has been shown that the size of the H ii regions is tightly re-lated to their dynamical age, defined as tdyn ∼ rHII/∆V, where rHII is the radius of the H ii region and ∆V its expansion veloc-ity (Ambrocio-Cruz et al. 2016). We do not have any dynamical data for these H ii regions, but thanks to the excellent quality of the Hα image we can measure their angular size and compare their stellar age-size relation to the dynamical age-size relation determined in the LMC by Ambrocio-Cruz et al. (2016). Doing that we make the assumption that the dynamical evolution of the extraplanar H ii regions of NGC 4254 is similar to that of typical disc H ii regions despite the conditions of the surround-ing medium (gas density and temperature) are probably signifi-cantly different than those generally encountered in the interstel-lar medium of late-type galaxies (Tonnesen & Bryan 2012). For
Fig. 9. Relationship between the age determined assuming [NII]λ6583/Hα = 0.2 and A(Hα) = 0.7 (X-axis) and that assum-ing [NII]λ6583/Hα = 0.1 and A(Hα) = 0.0 (Y-axis). Filled dots indicates the H ii regions where the SED fitting gives reduced χ2
r < 6, empty dots χ2r ≥ 6. The black solid lines show the 1:1 relations.
a fair comparison we need to measure the size of the H ii regions as consistently as possible with Ambrocio-Cruz et al. (2016).
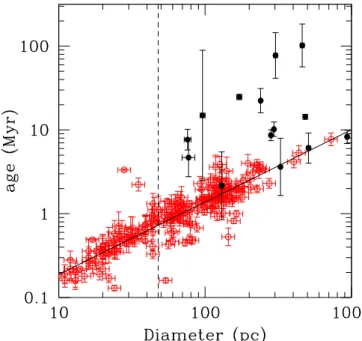
We measure the size of the few pointlike, symmetric H ii re-gions of the sample (14/60 objects) with a single counterpart within the selected UV region. This last condition is required to avoid H ii regions formed by distinct associations of newly formed stars, for which a measure of a diameter might be mean-ingless. This measurement is performed using the GALFIT code (Peng et al. 2002, 2010) run on the narrow-band Hα image by assuming a Gaussian profile for the H ii region and using an em-pirical PSF image derived from 138 non-saturated stars in the narrow-band image of NGC 4254. We adopt as diameter of the H ii region the diameter including 80% of the total flux. When σ is the width parameter of the GALFIT Gaussian model, the diameter including 80% of the total flux is Diameter = 1.3 × σ. The diameters of these H ii regions are given in Table 3. We then compare the age-size relation of the extraplanar H ii of NGC 4524 (where here the age is the one derived from SED fitting) to the dynamical age versus size relation of H ii regions in the LMC in Fig. 113. We also notice that none of these regions is an outlier in Fig. 8.
Despite a possible large uncertainty on the measure of the diameter of the H ii regions due to the size close to the seeing limit and to a possible blending of multiple star clusters, Figure 11 shows that the age derived from the SED fitting analysis is larger than the dynamical age expected for H ii regions of sim-ilar size. This suggests that the ages derived from CIGALE are probably upper limits, as indeed expected given the limits of the
3
The diameters of the H ii regions in the LMC are isophotal. Given the small size of the H ii region on the image, and the unknown surface brightness limit used in Ambrocio-Cruz et al. (2016), we decided to use the Diameter definition given above as a representative measure of the size of these extraplanar H ii regions. We caution that part of the systematic misalignment observed in Fig. 11 can be due to the different definition of the size used for the two sets of data.
stellar population synthesis codes to derive ages younger than a few million years.
6. Discussion
6.1. Detection of the stripped material
The first result of the present analysis is a further confirma-tion that the detecconfirma-tion of the material stripped from a perturbed galaxy in rich environments requires multifrequency observa-tions to trace the different gas, dust and stellar components. There are, indeed, several examples where the stripped mate-rial is mainly cold HI gas not associated with any process of star formation (Chung et al. 2007; Boissier et al. 2012; Scott et al. 2012). This gas can also be in the cold molecular phase when-ever giant molecular clouds associated with star forming regions are present (Verdugo et al. 2015; Jachym et al. 2017), although this gas phase is not always detected (Jachym et al. 2013), or in warm H2 (Sivanandam et al. 2014). Some of the tails are also detected as diffuse structures in Hα (ionised gas; Gavazzi et al. 2001; Yoshida et al. 2002; Cortese et al. 2006; Yagi et al. 2007, 2010, 2017; Sun et al. 2007; Kenney et al. 2008; Fumagalli et al. 2014; Fossati et al. 2012, 2016; Zhang et al. 2013; Boselli & Gavazzi 2014), in X-rays (Sun et al. 2006, 2007, 2010), or in radio continuum (Gavazzi & Jaffe 1985, 1987; Gavazzi et al. 1995). Others are detected mainly in UV and optical bands be-cause of the presence of compact stellar regions formed after the interaction, as observed in the wake of IC 3418 in Virgo (Hester et al. 2010; Fumagalli et al. 2011a; Kenney et al. 2014) or the jellyfish galaxies of Poggianti et al. (2017).
In the case of NGC 4254, the stripped material has been de-tected in HI (Phookun et al. 1993; Haynes et al. 2007), while the compact H ii regions are clearly visible only in the GALEX UV bands, or in the deep Hα image, but only within. 20 kpc from the edge of the galaxy disc, while they are totally absent in the outer HI tail. Because of their very young age, they are almost undetected in the deep NGVS optical bands. NGC 4254 would thus be absent in a selection of perturbed galaxies such as the one done in the optical B-band by Poggianti et al. (2017) (GASP survey).
6.2. Impact of a stochastic IMF on the dating of the H ii regions
The analysis indicates that the observed regions have Hα lumi-nosities of 1037. L(Hα) . 1039erg s−1, which is typical of giant H ii regions in the Milky Way or in nearby galaxies, and ages . 100 Myr. Given their luminosity and stellar mass (Mstar & 104 M ), these H ii regions straddle the boundary of mass at which stochastic sampling of the IMF starts to play a role (Fumagalli et al. 2011b; da Silva et al. 2012; Cervino et al. 2013). At this luminosity, the H ii regions should include ∼ 1000 stars (Lee et al. 2011) and quite a few ionising objects (Elmegreen 2000; Koda et al. 2012). Nevertheless, Mstar ' 104 M is close to the limit where the undersampling of the IMF starts to be impor-tant for the determination of the ionising stellar component us-ing population synthesis models (Cervino et al. 2003; Cervino & Luridiana 2004; da Silva et al. 2012; Cervino et al. 2013). If the IMF is undersampled, however, the observed Hα luminosity at constant age is on average less than what predicted by our fully-sampled population synthesis models. Thus, the ages of the H ii regions may be on average overestimated for the smallest H ii regions. This effect would not alter our main conclusion that the extraplanar H ii regions of NGC 4254 are young (. 100 Myr).
Fig. 10. Relationship between the stellar mass (left), the star formation rate (centre), and the mean age of the stellar population (right) derived with CIGALE on the observed data (abscissa) and that derived on the mock catalogue as described in Sect. 5.3 (ordinate). Black filled dots are for Hα fluxes corrected for [NII] contamination and dust attenuation assuming [NII]λ6583/Hα = 0.2 and A(Hα)= 0.7 (see Sect. 5.1), blue open circles assuming [NII]λ6583/Hα = 0.1 and A(Hα) = 0.0. The black solid lines show the 1:1 relations.
Fig. 11. The dynamical age versus size relation derived for H ii regions in the LMC (red symbols, Ambrocio-Cruz et al. 2016) is compared to the age versus size relation derived from SED fitting for the extraplanar H ii regions in NGC 4254 (black filled dots). The vertical dashed line indicates the limiting seeing of the r- and narrow-band images. The black solid line shows the best fit for H ii regions in the LMC: log(age) = 0.86(±0.03) × log(Diameter) - 1.58(±0.06), R2= 0.88
6.3. Star formation process within extraplanar H ii regions IFU observations of the stripped gas of cluster galaxies indicate that star formation occurs only whenever the velocity dispersion in the tail is sufficiently low (σ ∼ 25-50 km s−1; Fumagalli et
al. 2014; Fossati et al. 2016; Consolandi et al. 2017) to allow the formation of giant molecular clouds. These velocities dis-persions are comparable to those observed over the disc of the galaxy by Wilson et al. (2011). ALMA observations are neces-sary to detect the molecular gas in these compact regions and de-rive its typical column density and velocity dispersion. Indeed, none of the few H ii regions mapped with HERA are detected in the12CO(2-1) line (Leroy et al. 2009). This is not surprising if the extraplanar star forming regions of NGC 4254 have been formed within giant molecular clouds (GMC) having properties similar to those observed within the Milky Way or in nearby spi-ral galaxies, e.g. have masses in the range 5 × 10⁴. M
GMC . 5
× 106M
, sizes 5. RGMC . 30 pc, and thus gas column den-sitiesΣ(H2) ' 170 M pc−2and volume densities 50. n(H2). 500 cm−3(Solomon et al. 1987; Engargiola et al. 2003). At a dis-tance of 16.5 Mpc the filling factor of these typical giant molec-ular clouds is ' 10%, thus the total CO emission is sufficiently diluted not to be detected within a 13 arcsec beam. Furthermore, the CO emission should also be low because of the expected low metallicity of the gas.
At these column densities, the typical collapse time (free fall time) for a cloud with a spherically-symmetric distribution of mass is:
tf f = s
3π
32Gρ ' 5Myr (4)
where ρ is the mean density of the gas. This timescale can be compared with the time since the first interaction of the galaxy with a nearby companion, that dynamical simulations place be-tween 280 Myr (Vollmer et al. 2005) and 750 Myr ago (Duc & Bournaud 2008), and with the typical age of the stellar popula-tions of the H ii regions (. 100 Myr). The stripped gas must have reached the typical column density of GMC in . 40 Myr (see next section) to produce the observed extraplanar H ii regions. The densest regions detected at the VLA in the HI tail have col-umn densities ofΣ(HI) ' 1019 cm−2(Fig. 4; Chung et al. 2009)
and are unresolved at the ∼ 30 arcsec beam resolution. Assuming a filling factor of ∼ 10%, and a clumpy distribution, it is possible that the HI gas reaches column densities similar to those encoun-tered in the outer discs of late-type galaxies producing molecular clouds where star formation takes place. Indeed, star formation seems to follow the typical Schmidt-Kennicutt relation in tidal debries (Boquien et al. 2011). However, the physical conditions of the stripped gas within a hot intergalactic medium (gravita-tional potential, pressure, temperature, turbulence) change sig-nificantly with respect to the typical ISM in galactic discs, and it is still unclear why in these outer regions the gas collapses to form giant H ii regions while at further distances from the galaxy along the tail or in other similar objects within the same cluster it does not (e.g. NGC 4569, Boselli et al. 2016a). In particular, in these extraplanar H ii regions the lack of a dominant galac-tic potential well should reduce the hydrostagalac-tic pressure of the gas, and thus prevent the formation of molecular gas (Blitz & Rosolowsky 2006). However, turbulence and shock fronts pro-duced by the gravitational perturbation or by the ram pressure that the galaxy is suffering while entering into the cluster can compress the gas and lead to H2formation (Tonnesen & Bryan 2010, 2012). In NGC 4254 the stripping of the gas seems to oc-cur mostly edge-on. Simulations suggest that in this geometri-cal configuration the gas, located in a thin disc before the inter-action, gets less dispersed than in a face-on stripping process, thus favouring the formation of molecular clouds (Roediger & Br¨uggen 2006).
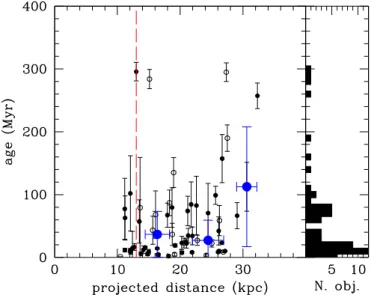
Figure 12 shows the relation between the age of the stellar population of the different H ii regions and their projected dis-tance from the nucleus of the galaxy. There is no obvious trend between the two quantities, implying that there is no strong dif-ferential evolution of these regions after the perturbation. We re-call, however, that all these regions are located within ' 35 kpc in projected distance from the galaxy nucleus, corresponding to ' 2 optical radii of the galaxy. This small distance range prob-ably corresponds to a small dynamic range in stellar age which is difficult to resolve with a simple SED fitting analysis, par-ticularly with a sample characterised by a low detection rate at several wavelengths.
6.4. Fate of the stripped material
Considering the line-of-sight motion of NGC 4254 within the cluster we can estimate the time necessary to travel ∼ 30 kpc, the mean projected distance of the H ii regions, from the galaxy. NGC 4254 is a member of the northern cloud of the Virgo clus-ter (Gavazzi et al. 1999) and has a relative velocity of ∼ 1400 km s−1with respect to the cluster centre. Assuming that the galaxy is moving on the plane of the sky with the typical velocity dis-persion of the cluster (' 800 km s−1; Boselli et al. 2014b), it would have traveled ∼ 30 kpc in ∼ 40 Myr. In the same time the galaxy would have crossed ∼ 55 kpc along the line of sight. This rough estimate suggests that the furthest H ii regions are at RHII ∼ 60 kpc from the nucleus of the galaxy. At these distance these H ii regions are still gravitationally bound to NGC 4254. Indeed, the truncation radius RT of the galaxy, which lies at a projected distance RM87 ∼ 1 Mpc from the core of the cluster (M87), is (Binney & Tremaine 2008):
RT = RM87×
MNGC4254,DM 3 × MVirgo,DM
!1/3
(5) where MNGC4254,DMis the total (dark matter) mass of NGC 4254 and MVirgo,DMthat of the Virgo cluster. Assuming MVirgo,DM= 4
Fig. 12. Left panel: relationship between the age of the different H ii regions as derived from CIGALE (in Myr) and their pro-jected distance from the nucleus of NGC 4254 (in kpc). Filled dots indicates the H ii regions where the SED fitting gives re-duced χ2
r < 6, empty dots χ2r ≥ 6. Blue big filled dots indi-cate the median values within different distance bins. The red long-dashed vertical line indicates the 23.5 mag arcsec−2i-band isophotal radius of the galaxy given in Cortese et al. (2012b). Right panel: age distribution of all the H ii regions.
× 1014 M
(McLaughlin 1999) and MNGC4254,DM= 1012 M as derived from Behroozi et al. (2010) for a stellar mass of NGC 4254 of MNGC4254,star= 2.4 × 10¹⁰M , the truncation radius of NGC 4254 is RT ' 95 kpc. These regions are within the trun-cation radius of the galaxy and might thus fall back on the disc. However, the HI observations of Phookun et al. (1993) suggest that the HI clouds associated with these regions have a ∼ 200 km s−1 lower recessional velocity along the line of sight than that of the galaxy (see Fig. 4), corresponding to ∼ 340 km s−1 in a 3-D space. This value is close to the escape velocity from a spherically symmetric solid body given by the relation:
ve= s
2GMNGC4254,DM
RHII
(6) that for the furthest H ii regions (RHII ∼ 60 kpc) is ∼ 390 km s−1. Furthermore, the galaxy moving towards the cluster cen-tre is undoubtly undergoing a strong ram pressure event as clearly seen in the asymmetric distribution of the radio contin-uum emission (Kantharia et al. 2008) and of the HI gas over its disc, with an extended tail in the northern direction (Phookun et al. 1993; Kantharia et al. 2008). This external pressure might have favoured the formation of giant molecular clouds (Blitz & Rosolowsky 2006), although some clouds might have been stripped from the wester spiral arm during the interaction. Here, indeed, ram pressure is made more efficient than elsewere in the disc because of the combined effect of the edge-on motion of the galaxy within the cluster and its clockwise rotation. The HI gas blobs associated to the extraplanar H ii regions are suffering the same ram pressure event affecting the galaxy, as indeed sug-gested by their lower recessional velocity with respect to NGC 4254 (' 200 km s−1, see Fig. 4), preventing them to fall back onto the stellar disc. Given these considerations, while keep-ing in mind the large uncertainties on all the rough calculations
made above, it is possible that some of the extraplanar H ii re-gions will become free-floating objects within the cluster, as in-deed indicated by the dynamical simulations of Duc & Bournaud (2008). In that case, these compact stellar objects can contribute to the diffuse intracluster light of Virgo (Mihos et al. 2005, 2009, 2017). Because of their compact nature and their single-age stel-lar populations, these regions can be the progenitors of globu-lar clusters, diffuse star clusters (DSC), and ultra compact dwarf galaxies (UCD), mainly observed around the dominant massive elliptical galaxies in nearby clusters (Peng et al. 2006; Liu et al. 2015, 2016). Their stellar masses (see Table 3 and Fig. 5) are less than those of typical UCDs and globular clusters, but these last have been formed several Gyr ago, when the typical gas con-tent of galaxies was significantly larger than in similar objects in the local universe. It is thus plausible that high-speed fly-by en-counters of gas-rich galaxies in forming clusters at high redshift might have produced more massive compact objects than those observed around NGC 4254, giving birth to globular clusters, DSCs, and UCDs such as those observed in the local universe. The properties of the extraplanar H ii regions of NGC 4254 in terms of stellar mass are comparable to those observed in other Virgo cluster compact sources formed after a gravitational per-turbation between galaxies (M 49 - VCC 1249; Arrigoni-Battaia et al. 2012) or by ram pressure stripping (IC 3418 - Hester et al. 2010; Fumagalli et al. 2011a; Kenney et al. 2014). They are remarkably similars to those of the ultra-compact high velocity cloud AGC 226067, a possible stripping remnant in the Virgo cluster, characterised by a single stellar population with an age of ' 7-50 Myr (Sand et al. 2017).
7. Conclusion
Very deep Hα images obtained during the VESTIGE survey of the Virgo cluster ( f (Hα) ∼ 4×10⁻¹⁷ erg s−1 cm−2 for point souces at 5σ andΣ(Hα) ∼ 2×10⁻¹⁸ erg s−1 cm−2 arcsec−2 for extended sources at 1σ), combined with UV GALEX and op-tical NGVS data, revealed the presence of 60 compact (70-500 pc) star forming regions outside the optical disc of the massive spiral galaxy NGC 4254 (M99). These regions are located along the tail of HI gas harassed from the galaxy after a gravitational interaction with another Virgo cluster member that simulations indicate occurred between 280 and 750 Myr ago (Vollmer et al. 2005; Duc & Bournaud 2008). The analysis of their stellar popu-lations, as well as their physical sizes, consistently indicate that these regions are young (. 100 Myr). These observations of-fer new observational constraints for models and simulations of star formation in the stripped gas of cluster galaxies. Consistent with other observations of perturbed galaxies, these data indicate that the process of star formation outside the disc of galaxies is very episodic, lasts for a few Myr, and occurs only in pact regions. The velocity dispersion of the gas in these com-pact regions is expected to be sufficiently low to allow matter to collapse and form giant molecular clouds able to shield the gas from the external heating due to the hot intracluster medium. A complete multiphase modelling of the star formation process within these extreme regions requires more observational con-straints on the different gas phases (HI, H2, X-rays), as well as high-resolution spectroscopy for the determination of their kine-matic and physical properties.
Acknowledgements. We thank the anonymous referee for useful comments on the manuscript. We are grateful to M. Haynes for providing us with the HI data of NGC 4254, to C. Spengler for the use of GALFIT, and to the whole CFHT team who assisted us in the preparation and in the execution of the ob-servations and in the calibration and data reduction: Todd Burdullis, Daniel
Devost, Bill Mahoney, Nadine Manset, Andreea Petric, Simon Prunet, Kanoa Withington. We acknowledge financial support from ”Programme National de Cosmologie and Galaxies” (PNCG) funded by CNRS/INSU-IN2P3-INP, CEA and CNES, France, and from ”Projet International de Coop´eration Scientifique” (PICS) with Canada funded by the CNRS, France. This research has made use of the NASA/IPAC Extragalactic Database (NED) which is operated by the Jet Propulsion Laboratory, California Institute of Technology, under contract with the National Aeronautics and Space Administration and of the GOLDMine database (http://goldmine.mib.infn.it/) (Gavazzi et al. 2003). MB was supported by MINEDUC-UA projects, code ANT 1655 and ANT 1656. MS acknowledges support from the NSF grant 1714764 and the Chandra Award GO6-17111X. MF acknowledges support by the science and technology facilities council [grant number ST/P000541/1].
References
Ambrocio-Cruz, P., Le Coarer, E., Rosado, M., et al. 2016, MNRAS, 457, 2048 Arrigoni Battaia, F., Gavazzi, G., Fumagalli, M., et al. 2012, A&A, 543, A112 Behroozi, P. S., Conroy, C., & Wechsler, R. H. 2010, ApJ, 717, 379
Bekki, K., Koribalski, B. S., & Kilborn, V. A. 2005, MNRAS, 363, L21 Bellhouse, C., Jaff´e, Y. L., Hau, G. K. T., et al. 2017, ApJ, 844, 49 Bendo, G. J., Galliano, F., & Madden, S. C. 2012, MNRAS, 423, 197
Binney, J., & Tremaine, S. 2008, Galactic Dynamics: Second Edition, by James Binney and Scott Tremaine. ISBN 978-0-691-13026-2 (HB). Published by Princeton University Press, Princeton, NJ USA, 2008.,
Blakeslee, J. P., Jord´an, A., Mei, S., et al. 2009, ApJ, 694, 556 Blitz, L., & Rosolowsky, E. 2006, ApJ, 650, 933
Boissier, S., Boselli, A., Duc, P.-A., et al. 2012, A&A, 545, A142 Boquien, M., Duc, P.-A., Braine, J., et al. 2007, A&A, 467, 93 Boquien, M., Duc, P.-A., Wu, Y., et al. 2009, AJ, 137, 4561 Boquien, M., Duc, P.-A., Galliano, F., et al. 2010, AJ, 140, 2124 Boquien, M., Lisenfeld, U., Duc, P.-A., et al. 2011, A&A, 533, A19 Boquien, M., Buat, V., Boselli, A., et al. 2012, A&A, 539, A145 Boquien, M., Buat, V., & Perret, V. 2014, A&A, 571, A72 Boselli, A., & Gavazzi, G. 2006, PASP, 118, 517 Boselli, A., & Gavazzi, G. 2014, A&A Rev., 22, 74
Boselli, A., Boissier, S., Cortese, L., et al. 2006, ApJ, 651, 811 Boselli, A., Boissier, S., Cortese, L., & Gavazzi, G. 2008a, ApJ, 674, 742 Boselli, A., Boissier, S., Cortese, L., & Gavazzi, G. 2008b, A&A, 489, 1015 Boselli, A., Boissier, S., Cortese, L., et al. 2009, ApJ, 706, 1527
Boselli, A., Eales, S., Cortese, L., et al. 2010, PASP, 122, 261 Boselli, A., Boissier, S., Heinis, S., et al. 2011, A&A, 528, A107 Boselli, A., Cortese, L., Boquien, M., et al. 2014a, A&A, 564, A67 Boselli, A., Voyer, E., Boissier, S., et al. 2014b, A&A, 570, AA69 Boselli, A., Cuillandre, J. C., Fossati, M., et al. 2016a, A&A, 587, A68 Boselli, A., Roehlly, Y., Fossati, M., et al. 2016b, A&A, 596, A11
Boselli, A., Fossati, M., Ferrarese, L., et al., 2018, A&A, in press (https://arxiv.org/abs/1802.02829) (paper I)
Bresolin, F. 2017, Outskirts of Galaxies, 434, 145
Bresolin, F., Ryan-Weber, E., Kennicutt, R. C., & Goddard, Q. 2009, ApJ, 695, 580
Bresolin, F., Kennicutt, R. C., & Ryan-Weber, E. 2012, ApJ, 750, 122 Bruzual, G., & Charlot, S. 2003, MNRAS, 344, 1000
Calzetti, D., Armus, L., Bohlin, R. C., et al. 2000, ApJ, 533, 682
Cayatte, V., van Gorkom, J. H., Balkowski, C., & Kotanyi, C. 1990, AJ, 100, 604 Cayatte, V., Kotanyi, C., Balkowski, C., & van Gorkom, J. H. 1994, AJ, 107,
1003
Cervi˜no, M., & Luridiana, V. 2004, A&A, 413, 145
Cervi˜no, M., Luridiana, V., P´erez, E., V´ılchez, J. M., & Valls-Gabaud, D. 2003, A&A, 407, 177
Cervi˜no, M., Rom´an-Z´u˜niga, C., Luridiana, V., et al. 2013, A&A, 553, A31 Chung, A., van Gorkom, J. H., Kenney, J. D. P., & Vollmer, B. 2007, ApJ, 659,
L115
Chung, A., van Gorkom, J. H., Kenney, J. D. P., Crowl, H., & Vollmer, B. 2009, AJ, 138, 1741
Ciesla, L., Boselli, A., Smith, M. W. L., et al. 2012, A&A, 543, A161 Ciesla, L., Boquien, M., Boselli, A., et al. 2014, A&A, 565, A128 Consolandi G., Gavazzi G., Fossati M., et al.: arXiv:1707.06241 Copetti, M. V. F., Pastoriza, M. G., & Dottori, H. A. 1985, A&A, 152, 427 Cortese, L., Gavazzi, G., Boselli, A., et al. 2006, A&A, 453, 847 Cortese, L., Davies, J. I., Pohlen, M., et al. 2010, A&A, 518, L49 Cortese, L., Ciesla, L., Boselli, A., et al. 2012a, A&A, 540, A52 Cortese, L., Boissier, S., Boselli, A., et al. 2012b, A&A, 544, A101 Cortese, L., Fritz, J., Bianchi, S., et al. 2014, MNRAS, 440, 942 Cowie, L. L., & Songaila, A. 1977, Nature, 266, 501
da Silva, R. L., Fumagalli, M., & Krumholz, M. 2012, ApJ, 745, 145 Davies, J., Minchin, R., Sabatini, S., et al. 2004, MNRAS, 349, 922
![Fig. 9. Relationship between the age determined assuming [NII]λ6583 / Hα = 0.2 and A(Hα) = 0.7 (X-axis) and that assum-ing [NII]λ6583 / Hα = 0.1 and A(Hα) = 0.0 (Y-axis)](https://thumb-eu.123doks.com/thumbv2/123doknet/14771659.591534/11.892.89.415.86.401/fig-relationship-determined-assuming-nii-hα-hα-assum.webp)