HAL Id: insu-02106107
https://hal-insu.archives-ouvertes.fr/insu-02106107
Submitted on 20 Nov 2020
HAL is a multi-disciplinary open access archive for the deposit and dissemination of sci-entific research documents, whether they are pub-lished or not. The documents may come from teaching and research institutions in France or abroad, or from public or private research centers.
L’archive ouverte pluridisciplinaire HAL, est destinée au dépôt et à la diffusion de documents scientifiques de niveau recherche, publiés ou non, émanant des établissements d’enseignement et de recherche français ou étrangers, des laboratoires publics ou privés.
Performance of the SAM gas chromatographic columns
under simulated flight operating conditions for the
analysis of chlorohydrocarbons on Mars
Maeva Millan, Cyril Szopa, Arnaud Buch, Michel Cabane, Samuel Teinturier,
Paul Mahaffy, S. S. Johnson
To cite this version:
Maeva Millan, Cyril Szopa, Arnaud Buch, Michel Cabane, Samuel Teinturier, et al.. Performance of the SAM gas chromatographic columns under simulated flight operating conditions for the analysis of chlorohydrocarbons on Mars. Journal of Chromatography A, Elsevier, 2019, 1598, pp.183-195. �10.1016/j.chroma.2019.03.064�. �insu-02106107�
Multi-column gas chromatography analysis of chlorohydrocarbons
1
with the SAM experiment onboard NASA’s Mars Curiosity rover
2 3 4 5
M. Millan1,2,3, C. Szopa3,4, A. Buch5, M. Cabane3, S. Teinturier2, 6
P. Mahaffy2, S. S. Johnson1
7 8
1Department of Biology, Georgetown University, Washington DC 20057, USA
9 10
2NASA Goddard Space Flight Center, Planetary Environments Laboratory, Greenbelt 20771,
11
MD, USA 12
3
Laboratoire Atmosphère, Milieux, Observations Spatiales (LATMOS), 13
Université Versailles St-Quentin, UPMC Univ. Paris 06, CNRS, LATMOS, 11 Blvd. 14
d’Alembert, 78280 Guyancourt, France 15
16
4
Institut Universitaire de France 17
18 5
Laboratoire de Génie des Procédés et Matériaux (LGPM), EA 4038, Ecole Centrale Paris, 8-10 19
rue Joliot Curie, Gif-Sur-Yvette, France 20 21 22 23 24 25 26 Journal of Chromatography A 27 Version #1 28 02-07-2019 29
26 Pages, 6 Figures, 6 Tables 30 31 32 33 34 35 36 37 38 39
All correspondence should be addressed to: 40
Maëva Millan, 41
Georgetown University, department of Biology 42
37th and O Street NW, Regents 514 43 Washington DC, 20057 44 Tel: +1 240-271-7312 45 E-mail: mm4385@georgetown.edu 46 *Manuscript
Abstract
47 48
The Sample Analysis at Mars (SAM) instrument is a gas chromatograph-mass 49
spectrometer onboard the NASA Curiosity rover, currently operating on the surface of Mars. 50
Organic compounds are of major importance with regard to questions of habitability and the 51
potential presence of life on Mars, and one of the mission’s main objectives is to analyze the 52
organic content of soil and rock samples. In SAM’s first chromatographic measurements, 53
however, unexpected chlorine-bearing organic molecules were detected. These molecules have 54
different origins but the presence of perchlorates and chlorates detected at the surface of Mars 55
suggests that reactivity between organic molecules and thermal decomposition products from 56
oxychlorines is one of the major sources of the chlorinated organic molecules. Here we perform 57
a comprehensive and systematic study of the separation of volatile chlorohydrocarbons with the 58
chromatographic columns used in the SAM instrument. Despite the constrained operating 59
conditions of the flight instrument, we demonstrate that SAM’s capillary chromatographic 60
columns allow for effective separation and identification of a wide range of chlorine-bearing 61
species. We also show that instrumental limitations prevent the detection of certain molecules, 62
obscuring our ability to make definitive conclusions about the origin of these organic materials. 63
Highlights
64
In situ analysis of organic molecules on Mars with GCMS
65
Chlorohydrocarbons unexpectedly produced during heating of solid samples on Mars
66
Multi-columns chromatograph for separation and identification of chlorohydrocarbons
67
Keywords
68
Sample Analysis at Mars, chlorinated hydrocarbons, gas chromatography, mass spectrometry, 69
efficiency, separation 70
1. Introduction
71 72
Since the successful landing of NASA’s Curiosity rover in Gale Crater, Mars, on August 6th,
73
2012 (1), the Sample Analysis at Mars (SAM) experiment (2) onboard the rover has analyzed the 74
molecular composition of surface samples collected with the rover robotic arm. Organic 75
molecules in rocks and soil are of particularly high interest because they may be related to an 76
ancient biological activity and/or prebiotic chemistry. Along with the presence of liquid water 77
and a source of energy, the presence of organic molecules is necessary to make an environment 78
habitable according to our current knowledge of life (3). It is now well accepted that liquid water 79
and energy were present in the past history of Mars, demonstrated in particular by the Mars 80
Exploration Rovers (4, 5). But no organic molecules had been detected on the surface of Mars 81
before the Mars Science Laboratory mission. Despite the fact that meteoritic infall at the surface 82
of Mars is a likely continuous source of organic material (6), the conclusion of the in situ 83
measurements performed with the Viking landing probes in the late 1970’s was organic 84
molecules were not present in the regolith. Chlorohydrocarbons were detected by Viking, but at 85
the time, the science team believed the chlorinated molecules were sourced from terrestrial 86
contamination (7). We have now discovered that the martian soil contains various oxychlorine 87
species (8, 9). Because these molecules are strong oxidants, capable of chlorinating organic 88
molecules under high temperature, this result has led to a reconsideration of the conclusions of 89
the Viking GCMS measurements. It is now believed that the chlorohydrocarbons detected could 90
have actually been produced in the pyrolytic process of extraction of the organic materials 91
present in the presence of oxychlorine (10). Moreover, the SAM experiment has shown, for the 92
first time, that organic matter is definitively present on Mars (11). This was accomplished 93
through the detection of chlorohydrocarbons mostly produced in the pyrolytic oven of the SAM 94
instrument as part of reactions occurring between indigenous organic molecules in the 95
mudstones collected in Gale crater and thermal decomposition products from oxychlorines also 96
present in the sample. Chlorobenzene, the most emblematic molecule of this discovery, has now 97
been retrieved in the chromatograms recorded by the Viking GCMS (12) whereas it was not 98
reported in the original data analyses suggesting the presence of organic materials indigenous to 99
the samples collected by Viking landers. 100
Even though the detection of chlorohydrocarbons from Mars sample analyzed with pyro-101
GC-MS is now understood, the SAM gas chromatograph was developed before oxychlorines 102
were discovered on Mars. At that time, the whole family of chlorohydrocarbons was not 103
considered as a major source of analytes. Thus, the instrument’s ability to separate and analyze 104
chlorohydrocarbons with the different chromatographic columns used for the SAM gas 105
chromatograph, under constrained flight operating conditions, was never characterized. Finally, 106
from our knowledge, only a limited number of studies dealing with the separation of a limited 107
variety of volatile chlorohydrocarbons was reported in the literature. For all these reasons, we 108
have undertaken a systematic study of the analysis of chlorohydrocarbons, including linear and 109
aromatic ones, with five of the six columns used in the SAM gas chromatograph specifically 110
dedicated to analyze organic compounds. This laboratory work is primarily dedicated to properly 111
process and interpret the data collected with the SAM instrument on Mars, but it could also be 112
used as a reference work for other applications. 113
2. Material and methods
114
2.1 Samples: the chlorohydrocarbons
115
26 chlorinated hydrocarbons, listed in Table 1, were selected for this study. Most of them 116
were detected in the first fifteen samples of sand and rocks analyzed with the SAM GC-MS 117
experiment (11, 13, 14). The others, belonging to similar chemical categories (aromatics, etc.), 118
were thought to be potentially present as well, or relevant to the search for organics in the future 119
Martian samples (13, 15). All the chlorohydrocarbons were supplied by Sigma Aldrich and were 120
of pure analytical grade (>99.9%). They were injected into the GC-MS both as separate 121
concentrated standards as well as mixed together in equimolar ratios. 122
2.2 GC columns and stationary phases
123
There are six columns on the SAM chromatograph. The PLOT Carbobond column 124
(Agilent), located in channel 3 (GC-3), was not included in this study because it is fully devoted 125
to the analysis of atmospheric and inorganic light molecules (< C2). Thus, GC-3 is not relevant
126
for the analysis of chlorohydrocarbons. Of the remaining five, three have been used on Mars: the 127
MXT-20 (GC-1), the Chirasil-β dex (GC-4) and the MXT-CLP (GC-5), located in channels 1, 4 128
and 5 respectively and the other two: the MXT-5 (GC-2) and PLOT MXT-Q (GC-6) columns 129
located in channels 2 and 6, have not been used so far. To perform the laboratory experiments, 130
five replicates of each SAM flight capillary column were purchased in 2007. The columns were 131
each tested and qualified in the laboratory under the same conditions and with the same analytes 132
as the columns used to build the SAM GC instrument. The best columns were selected to be 133
integrated into three different models of the SAM GC. The two columns remaining were kept at 134
Laboratoire Atmosphères Milieux Observations Spatiales (France) under controlled storage 135
conditions for running laboratory tests which could not be completed with the integrated models 136
of SAM. All the tested columns were 30 m long, with a 0.25 mm internal diameter, and were 137
supplied by Restek (Bellefonte, PA, USA). Their film thickness was 0.25 μm except for the 138
PLOT MXT-Q column, which has a 10 µm thick stationary phase. Their specifications are listed 139
in Table 2. 140
2.3 Gas chromatograph-mass spectrometer
141
Measurements were performed with two instruments: a GC Trace chromatograph coupled to 142
an ITQ MS, and a GC trace chromatograph coupled to an ISQ MS (both instruments from the 143
ThermoFisher company). A split/splitless injector was used in split mode with a 1:50 mean split 144
ratio. Low volume liquid and gas syringes (Hamilton), with 0.5 μL and 1 mL volumes 145
respectively, were used to inject the different samples in the injector. The temperature of the 146
injector, the GC-MS transfer line, and the ionization source were set at 250°C in order to prevent 147
condensation of tested molecules in the instrument, as all tested compounds except 148
pentachlorobenzene and hexachlorobenzene have lower boiling points. The MS was set to scan 149
all the ions produced from the electron impact ionization source (electron energy of 70 eV) in the 150
m/z 10 to 300 range that covers all the ions produced from the tested compounds according to 151
the NIST MS spectrum library. 152
The carrier gas was helium (purity ≥ 99.999%) to match the SAM GC-MS experiment on 153
Mars. The temperatures of the columns and carrier gas flow conditions used are given in the 154 following section. 155 2.4 Analytical approach 156 157
Reproducing the SAM-flight pressure in laboratory
158
The carrier gas pressure drop between the injector and the detector of the 159
chromatographic column is a key parameter of the chromatographic analysis. During the 160
development of the SAM flight instrument, a 1.3 bar inlet carrier gas pressure was originally 161
chosen as a good tradeoff between chromatographic efficiency and instrumental design 162
constraints, essentially driven by the requirement that the pressure of the MS chamber remain 163
low. However, during the last test campaign of the instrument before its integration into the 164
rover, the inlet pressure was decreased to 0.9 bar to limit the risk of failure of the MS instrument. 165
The carrier gas tank pressure was predicted to decrease with time over the course of the mission, 166
but this change had an immediate effect on retention times and column efficiency. 167
With our laboratory instruments, it was not possible to set the absolute inlet pressure to 168
0.9 bar as it is below ambient laboratory pressure (1 bar). For that reason, we altered the flight
169
carrier gas flow by using a deactivated fused silica capillary tube, 30 cm long and with a 50 μm 170
internal diameter connected between the split/splitless injector and the column, following the 171
method suggested by DeZeeuw et al. (16). The appropriate tube length (Ltube) was estimated
172
using the Poiseuille’s law, described by the following equation: 173
174
with η, the helium viscosity, at 1.96.10-5 Pa.s at 20°C, Lcol and Ltube as the respective lengths of
175
the column and the tube, r as their radius (0.125 mm for the column and 50 μm for the restrictor 176
tube), and Q as the helium flow rate calculated from the mean gas velocity of 16.28 cm.s-1 and
177
16.66 cm.s-1 observed in flight for the column from the GC-4 and GC-5 channels respectively.
178
These velocities were calculated from the deadtime measured in flight chromatograms (3.07 min 179
and 3.00 min respectively). For the GC-1 channel, the deadtime was difficult to determine 180
because of the absence of a precise injection system in the flight experiment. For this reason, we 181
used a 3.00 min estimate corresponding to a 16.66 cm.s-1 carrier gas mean velocity. The pressure
182
drop ΔP was set to 100 kPa for the calculation as this corresponds approximately to the pressure 183
drop in the SAM flight model instrument. 184
The restrictor tube length was calculated for four different internal diameters values varying 185
from 5 to 50 μm. The 50 μm diameter tube was chosen for its realistic and reasonable tube length 186
to cut and add to the column inside the GC oven. The tube length calculated was 30 cm. For the 187
following set of experiments to work under SAM-flight pressure, a 30 cm long and 50 μm 188
internal diameter restriction tube was used with each column replicate already used on Mars 189
(1, 4 and 5) in addition to the columns that have not yet been used (2 and GC-190
6). This method enabled us to mimic the inlet gas vector flow of the SAM instrument. 191
Once the flow restrictor was installed, we studied the efficiency of the columns as a function 192
of the inlet pressure by varying the inlet pressure from 1.1 bar, i.e. the minimum pressure that 193
can be set on the laboratory instrument, up to 5 bars. For the study of the analytical capabilities 194
of the column under SAM like operating conditions, the inlet pressure of the laboratory GC was 195 DP=8h p Lcol rcol4 + Ltube rtube4 é ë ê ù û úQ
set to the value allowing us to obtain the deadtime representative of the flight model (~1.3 bar, as 196
described in the results section). 197
Reproducing the SAM-flight temperatures of the GC columns in the laboratory
198
To study the efficiency of the columns as well as their thermodynamics, we chose 199
isothermal columns temperatures between 30°C and 200°C, the minimum and maximum 200
temperatures the columns can reach in flight. To study the separation efficiency of the 201
chlorohydrocarbons, we performed the laboratory experiments under SAM-like operating 202
conditions, as close as possible of the flight temperature profiles. We applied identical 203
temperature programs for the GC-1, GC-4 and GC-5 columns used on Mars to the columns we 204
tested in the laboratory. For the GC-2 and GC-6 columns, standard temperature programs were 205
applied considering their thermal constraints on SAM, so as to mimic the flight conditions for 206
future analyses on Mars. These conditions are detailed in Table 5. Depending on the nature of 207
the molecules analyzed and the column, the final temperature was held between 5 and 40 208
minutes. When the highest temperature possible is reached for the column considered in flight, it 209
immediately stops heating, as it is generally not possible to maintain a long plateau at the final 210
temperature because of thermal constraints. 211
While the temperature programs of the three columns already used on Mars were mostly 212
reproduced, some slight differences exist because the flight and laboratory set ups are not strictly 213
identical. A comparison between the flight and laboratory temperature programs applied to the 214
columns are presented in Figure 1. The slight difference observed between the flight and the 215
laboratory temperature profiles is primarily due to the fact that temperature regulation of the 216
columns is less accurate in the flight model because of the heating method used. However, the 217
profiles are sufficiently similar to consider that the laboratory method mimics the flight 218
temperature programs of the SAM-GC columns. 219
220
3. Analytical performances of the SAM-flight GC columns
The investigation proceeded in three steps: first, an efficiency study as a function of the 222
operating conditions to estimate the relevance of the conditions finally used in the flight model; 223
second, a thermodynamic study to estimate the possible evolution of the elution order of the 224
chlorohydrocarbons targeted within the temperature conditions; and third, the measurement of 225
the retention times and determination of the separation power of each column for the 226
chlorohydrocarbons studied. This last step was of critical importance in developing a reference 227
database for analyzing the flight data. 228
3.1 Efficiencies of the SAM-GC columns on chlorohydrocarbons
229
The column’s efficiencies were studied as a function of the temperature and the inlet 230
carrier gas pressure, as the outlet column pressure is constant in the SAM instrument (0 bar).
231
The main objective was to determine the optimal carrier gas flow rate conditions to analyze 232
chlorohydrocarbons. To perform these measurements, the carrier gas inlet pressure was varied 233
from 110 kPa, the minimum absolute pressure possible on a GC laboratory, to 500 kPa. These 234
pressures correspond to 7 to 39 cm.s-1 mean linear velocities. Two isothermal temperature
235
conditions were used, 35°C and 185°C. These temperatures were representative of the extreme 236
temperatures used in the SAM GC instrument, taking into account the environmental conditions 237
of the Mars surface and the instrumental constraints. Three light chlorohydrocarbons detected in 238
the martian samples were selected for the low column temperature: dichloromethane, 1,2-239
dichloropropane (chiral), and chlorobenzene. The Chirasil-β dex (GC-4) column was used for the 240
separation of the following chiral molecules: the 3-chloro-2-methyl-1-propene, also detected on 241
Mars and the 1-chlorobutane, that was selected to replace the chlorobenzene, this last not being 242
eluted at such low temperature. At high temperature, the same compounds were selected in 243
addition to 1,2,4-trichlorobenzene and 1-chlorooctane (these two compounds have not been 244
detected in the martian samples so far). 245
A previous study of the MXT-CLP (GC-5) column efficiency was performed (17) but the 246
organic molecules targeted (alcohols, alkanes and aromatic hydrocarbons) did not include 247
chlorohydrocarbons. For this study, the GC-5 column efficiency was evaluated on a variety of 248
organic compounds including the major molecules detected by SAM at that time. The 249
chlorohydrocarbons studied have different physical and chemical properties (molecular weight, 250
boiling point, etc., see Table 1) and thus different retention time properties. The columns 251
efficiency, estimated with the number of theoretical plates value N, was evaluated using the 252
retention times and peak widths derived from the Total Ion Current (TIC) given by the 253
laboratory MS, using the formula N=5.54(tR/wh)2 with tR being the retention time and wh the 254
peak width at half height. The Height Equivalent to a Theoritical Plate (HETP or H in mm) was 255
calculated using the formula H=L/N with L the column length and N the efficiency. The 256
deadtime, required to calculate the mean carrier gas velocity, was measured using the elution 257
time of air (essentially composed of N2, O2 et CO2 which are not retained on the studied
258
columns), injected separately from the other compounds under the same operating conditions. 259
Finally, from the experimental points, the experimental evolution of H as a function of 260
the mean linear velocity (cm.s-1
) was fitted with the Van-Deemter Golay theoretical equation 261
given as follows: 262
A polynomial function was used to fit the efficiency of the GC-6 columns because the conditions 263
of the Van-Deemter Golay equation were not met. This can be explained by its stationary phase, 264
mostly dedicated to separate light organic molecules (<C5 or <100 g.mol-1). This is the case for
265
dichloromethane (M = 84 g.mol-1) but not the two other molecules (M ~112 g.mol-1). These
266
heavier molecules have higher retention times compared to the analytical capabilities of the GC-267
6 column inducing broader tailing peaks from a longer time spent into the column. For this 268
reason, the best fit was obtained with a second-degree polynomial function for this column. 269
Generally, HETP were optimal to few millimeters depending on the compounds, but the 270
range of optimal velocities were similar for all the compounds when looking at a given column. 271
Laboratory efficiencies were compared, when possible, to the flight efficiencies currently 272
measured on the SAM-flight instrument of the chlorohydrocarbons detected which was the case 273
for the MXT-CLP (GC-5), MXT-20 (GC-1), and Chirasil-β Dex (GC-4) columns. 274
275
For dichloromethane, the HETP minimum value was 1.7 mm for =12.5 cm.s-1
. In the 9-276
15 cm.s-1 velocity range, the HETP value did not increase more than 10. For chlorobenzene
277
and 1,2-dichloropropane, the HETP minimum values were 2.8 and 3.1 mm respectively at 9 278
cm.s-1 and 10 cm.s-1 carrier gas speeds. HETP values did not increase more than 10% of the
279
minimum in the 7 to 12 cm.s-1 velocity range.
280
No analyses of a Mars sample have been performed on the SAM flight model with the 281
GC-6 column so far. However, a calibration test was performed on Mars with the GC-6 channel 282
and the deadtime measured was 3.5 min at 40°C. This corresponds to a 14.3 cm.s-1 mean carrier
283
gas velocity. However, no measurement of the deadtime was available on flight at 185°C 284
temperature column to calculate the carrier gas velocity at this temperature. But, the inlet column 285
pressure is known (0.9 bar), as well as the deadtime measured on the columns that have been 286
used in flight, and equal to about 3.9 min at 185°C. Knowing these values, we calculated the 287
supposed average velocity of the carrier gas that would be equal to 12.82 cm.s-1 at 185°C for the
288
current inlet column pressure, called “ SAM theoretical” (Figure 2), value compatible with the
289
carrier gas velocity of He in flight measured at 40°C column temperature. 290
From these measurements, we concluded that the optimal efficiency of the GC-6 column 291
decreased with the retention times of the analyzed compounds, likely because of the increase of 292
the peaks tailing with their retention due to the nature of the stationary phase. Moreover, when 293
comparing the optimal velocity range of the column with the actual mean linear velocity 294
measured in the flight model, we noticed that the flight operating carrier gas flow was near 295
optimal for this column and the tested compounds. However, the decrease of carrier gas velocity 296
during the mission should not significantly influence the efficiency down to 9 cm.s-1.
297
Figure 3 shows the evolution of the HETP as a function of the mean carrier gas velocity 298
for all the SAM GC columns bonded with liquid stationary phases, for the two extreme 299
temperatures used in the SAM GC flight model. Most curves show the usual behavior of the 300
evolution of HETP with , yet we observed one phenomenon that we are unsure how to explain:
301
that those obtained with the MXT-CLP columns at 185°C were rather flat for higher mean 302
carrier gas velocities. All the values used to discuss the efficiencies of the columns bonded with 303
liquid stationary phases are summarize in Table 3. 304
305
The MXT-20 column (GC-1) plot was consistent with the theoretical evolution of the 306
Van-Deemter-Golay equation at high temperature for each molecule. The minimum H values 307
were between 0.5 mm for dichloromethane and 1 mm for the other compounds at low 308
temperature. The optimal velocity range was 15-20 cm.s-1 for dichloromethane and stayed
309
optimal for the other compounds even at high carried gas speeds. At high temperature, plots had 310
a minimum of 0.8 mm for the more retained compounds, to 1.4 mm for the less retained. The 311
optimal velocity range was the same for each molecule and between 15 and 20 cm.s-1.
312
In conclusion, the optimal velocity range for the GC-1 column did not depend on the 313
temperature. The efficiency did not improve when the temperature increases and was slightly 314
degraded (of ~0.4 mm), meaning the exchange between the mobile and stationary phases was 315
more difficult at high temperature. At both temperatures, GC-1 was convenient and efficient for 316
the analysis of low and high molecular weights chlorinated compounds and on a wide range of 317
velocities with a slight better efficiency at low temperature. 318
The GC-1 column has since been used on Mars on the Windjana sample and in parallel 319
with the GC-4 column on the Ogunquit Beach (OG) sample. However, the lack of efficient inlet 320
injection system did not allow an ideal chromatographic analysis with symmetric and Gaussian 321
peaks. In addition, without the injection time given by the thermal desorption for other columns 322
used in SAM, it is impossible to precisely determine its deadtime. If the carrier gas velocity is 323
estimated using the estimated deadtime, it equals 3.0 and 3.9 minutes at 35 and 185°C 324
respectively. This corresponds to flight linear velocities of 16.66 and 12.82 cm.s-1. Compared to
325
laboratory efficiencies, the flight efficiency was slightly degraded of 15% at high temperature. 326
At low temperature, the efficiency was not degraded at SAM-flight pressure. At high 327
temperature, it will have to be considered that GC peaks shape can be degraded, possibly 328
resulting in a limitation of the separation power. This confirms that the GC-1 column has better 329
analysis capabilities at low temperature regarding its efficiency and use at the in situ flight-330
pressure. 331
The MXT-5 (GC-2) column had experimental data close to the theoretical fit of the Golay 332
equation. At low temperature, efficiencies values were similar for all compounds and between 1 333
and 1.3 mm, corresponding to optimal carrier gas velocities between 15 and 20 cm.s-1. At high
334
temperature, efficiencies were degraded and H values increase from 1.8 to 3 mm depending on 335
the compounds. The limitation of experimental data at high pressure made the fitting of the plots 336
difficult. The optimal velocity ranges varied from one compound to another of a few centimeters 337
per second. For light compounds (dichloromethane, dichloropropane, and chlorobenzene), the 338
optimal velocities ranged between 13 and 17 cm.s-1. The optimal velocities of
1,2,4-339
trichlorobenzene and 1-chlorooctane were between 13 and 19 cm.s-1 and 10 and 15 cm.s-1
340
respectively. In conclusion, this column was shown to be more efficient for the analyses of high 341
molecular weight aliphatic chlorohydrocarbons (no loss of efficiency). Its efficiency decreased to 342
25% for aromatics. 343
The MXT-5 (GC-2) column has not yet been used in flight. However, we were able to 344
theoretically estimate its efficiency degradation under SAM-flight conditions. As for GC-1, the 345
efficiency of GC-2 was optimal at low temperature, even at SAM-flight pressure. At high 346
temperature, the efficiency was degraded for most compounds, except for chlorooctane. The 347
current carries gas velocity is thus ideal for the analysis of aliphatic high molecular weight 348
compounds at high temperature. For low molecular weight organo-chlorinated or aromatic 349
compounds, the flight-pressure was 20% weaker than the optimal one. As GC-1, GC-2 had better 350
analysis capabilities at low temperature but was globally less efficient for the analysis of the 351
targeted compounds, thus using GC-1 under these circumstances will be preferable. 352
The Chirasil-β Dex (GC-4) column is dedicated to the analysis and separation of chiral 353
molecules. From all selected compounds, 1,2-dichloropropane is the only chiral one. Both 354
isomers of dichloropropane are partially co-eluted at low temperature and totally at high 355
temperature. 356
At low temperature, efficiencies follow the theoretical evolution of Golay, except for 357
dichloromethane. For this last, except at low velocities, points are irregular and do not present a 358
minimum. Those results are difficult to interpret since all the analyses were performed in the 359
same conditions for all molecules. For 1,2 dichloropane, despite it includes enantiomers, its 360
efficiency evolves as the other compounds. However, a higher HETP of 2.8 mm (compared to 361
1.2 mm for chlorobutane and 3-chloro-2-methyl-1-propene) is obtained. These observations 362
result from the likely slight separation of the enantiomers achieved on the column, broadening 363
the peak observed on the chromatogram and resulting from the coelution of the peaks of the 364
enantiomers. The results obtained for this compound should therefore be taken as indicative of 365
the efficiency trend. The optimal gas velocities are between 13 and 18 cm.s-1 compared to 15-20
366
cm.s-1 for dichloropropane. At high temperature, plots are atypical since even with the Golay’s
367
fits, they tend to parabolic equations implying steep slopes at high velocities. Consequently, the 368
optimal carrier gas velocities range is reduced compared to the other columns at the same 369
temperature. Efficiencies improve with the temperature increase with H values between 0.9 and 370
3.5 mm. In conclusion, the GC-4 column is more efficient for the highest molecular weight 371
chlorohydrocarbons. However, the optimal gas velocities range is the same for all compounds 372
and between 10 and 13 cm.s-1, which is significantly reduced compared to the optimal range of
373
the other columns. 374
The GC-4 column is now the privileged column for flight-GC analyses and was recently 375
used in parallel of GC-1 to analyze the OG samples. Using the chromatogram from the Green 376
Horn (GH) sample, the column deadtime was evaluated at 3.07 minutes. At both temperatures, 377
the velocity range is optimal for the chlorinated compounds analyzed in the laboratory. At high 378
temperature, the flight-mean carrier velocity is below the limit to which the loss of efficiency 379
would be significant. At low temperature, Figure 3 shows that, despite the current flight-380
operating conditions, the efficiency is not degraded and consistent with the flight one. To 381
confirm this hypothesis, the efficiency observed for dichloromethane, detected in GH, was 382
measured and equals 1.5 mm. This value is consistent with the H value of chlorobutane and 3-383
chloro-2-methyl-1-propene, indicating that the laboratory conditions are representative of the 384
flight ones. Moreover, when we compare the flight H value (1.5 mm) to the laboratory one for 385
the dichloromethane (2.1 mm), we see that GC-4 is even more efficient in flight compared to the 386
laboratory. In conclusion, the flight operating conditions of GC-4 are optimal at low temperature 387
and correspond to the maximal column efficiency. The efficiency loss is negligible at high 388
temperature. Despite the instrumental constraints, GC-4 allows analyses in optimal conditions, at 389
both temperatures considered in flight. 390
The MXT-CLP (GC-5) column allowed the analyses and detection of all the 391
chlorohydrocarbons detected in the martian samples so far. The efficiency of this column was 392
previously studied for non-chlorinated compounds (17), but it was not clear how the column 393
efficiency behaves in the presence of chlorinated molecules. At 35°C, we found that 1,2-394
dichloropropane and chlorobenzene had the same behavior, and that the theoretical Golay curves 395
fit correctly with the experimental data. However, dichloromethane efficiency is almost linear 396
with no increase at the highest carrier gas velocities. Thus, dichloromethane is not well retained 397
by the column and has a retention time close to the deadtime. The H values measured were: 2.3 398
mm for dichloromethane and 1.6 mm for the other molecules. The optimal range of velocity for 399
all three compounds was between 13 and 19 cm.s-1. Efficiencies were much improved at 185°C.
400
Minimal H values were between 0.5 mm for the more retained chlorohydrocarbons to 0.8 mm 401
for the less retained. The best efficiency was obtained for a carrier gas velocity of 24 cm.s-1 and
402
stayed mostly constant at high velocities, is consistent with previous studies (17) and also 403
indicating that GC-5 appears to have the same behavior regarding all types of molecules. 404
A comparison between the flight and optimal laboratory efficiencies showed that the 405
analysis conditions were quite optimal at low temperature but degraded at high temperature. The 406
efficiency loss was evaluated at 4% at low temperature and 46% at high temperature (Table 3). 407
The consequence is a degradation of the flight chromatograms compared to the optimal, through 408
broader peaks and a more limited separation power of the column. To confirm that efficiencies 409
are representative of SAM-flight operating conditions, we calculated the column efficiency for 410
the dichloromethane detected in the Cumberland (CB) sample. At the SAM carrier gas velocity 411
of 16.66 cm.s-1, the H value for dichloromethane is 2.65 mm, corresponding exactly to the
412
laboratory efficiency for this compound. For chlorinated compounds, laboratory operating 413
conditions are perfectly consistent with the flight ones and analyses were performed in analytical 414
conditions close to the optimal, especially at low temperature. 415
A previous study demonstrated that the lowest carrier gas speed on SAM does not have a 416
great influence on the GC-5 flight column efficiency regarding alcohols and alkanes (17) at low 417
temperature, even with an efficiency loss of ~33%. This study demonstrated that the efficiency 418
loss in the case of chlorohydrocarbons was even lower (4%) and that GC-5 was best adapted for 419
their analysis at low temperature. At high temperature, efficiency losses did not depend on the 420
nature of the compound and were about 47% for all the compounds considered in both studies. 421
In conclusion, all five columns tested had similar ranges of optimal carrier gas velocities 422
at low temperature. The obtained H minimum values (1-3 mm) show that, within the optimal 423
carrier gas speed, all columns had high efficiencies and representative to the flight ones 424
(measured with the dichloromethane for GC-4 and GC-5). The most efficient columns are GC-1 425
and GC-2 both bonded with polydimethylsiloxane (80 and 95% respectively) and phenyl (20 et 426
5%), followed by GC-4 and GC-5 (Table 3). Even if the GC-5 column is dedicated to the 427
analysis of compounds with the same molecular weights as GC-1 and GC-2, the presence of 428
cyanopropyle seemed to slightly limit its efficiency compared to the others. At high temperature, 429
the optimal carrier gas velocity range is reduced for all columns (except GC-2), especially for the 430
GC-4 and GC-5 columns. But within their optimal velocity range, their efficiencies are 431
improved, with a broader dispersion for GC-4 (Table 3). The efficiency and optimal carrier gas 432
velocity range of the GC-2 column depend on the nature of the chlorinated compounds 433
considered. GC-2 seems indeed less efficient for the analysis of aromatic chlorohydrocarbons 434
(e.g. chlorobenzene and 1,2,4-trichlorobenzene) and if used on SAM, this constraint will have to 435
be considered. 436
The study of the SAM-GC columns efficiencies demonstrated that flight operating 437
conditions were within or close to the optimal velocities range for the analysis and separation of 438
aromatic and aliphatic chlorinated organics, and has a minor influence on the SAM analyses 439
(Table 3). However, we note that columns efficiency would have been improved by using a 440
higher carrier gas flow rate as initially planned. Moreover, the slight decrease of pressure in the 441
SAM helium gas tank throughout the mission should not significantly influence the columns’ 442
efficiencies. Uopt was equivalent to uSAM at low temperature, lower at high temperature for the 443
GC-1 and GC-5 columns and slightly higher for GC-4. The current flight carrier gas velocity 444
works within the optimal carrier gas velocities at low temperature since efficiency losses are 445
below 10% for all the SAM-GC columns. This is not the case at the highest temperature and 446
degradations are observed: ~15, 25, 14 and 46% for GC-1, GC-2, GC-4 and GC-5 respectively. 447
Thus, it is globally preferable to use the columns from the GC-1, 2 or 4 channels for the analysis 448
of the chlorohydrocarbons, with GC-1 being the most efficient of all for each 449
chlorohydrocarbons and at both SAM extreme temperatures. With time and the general decrease 450
of the SAM mean carrier gas speed, efficiencies might significantly decrease except for the GC-451
4 column which should even have a better efficiency (Figure 3) and that should be the favorable 452
column to use in future SAM analyses. 453
3.2 Thermodynamic study
454
Retention time, as mass spectrum, is a key parameter used for identifying the compounds 455
detected with the SAM instrument. As the temperature of the columns changes during an 456
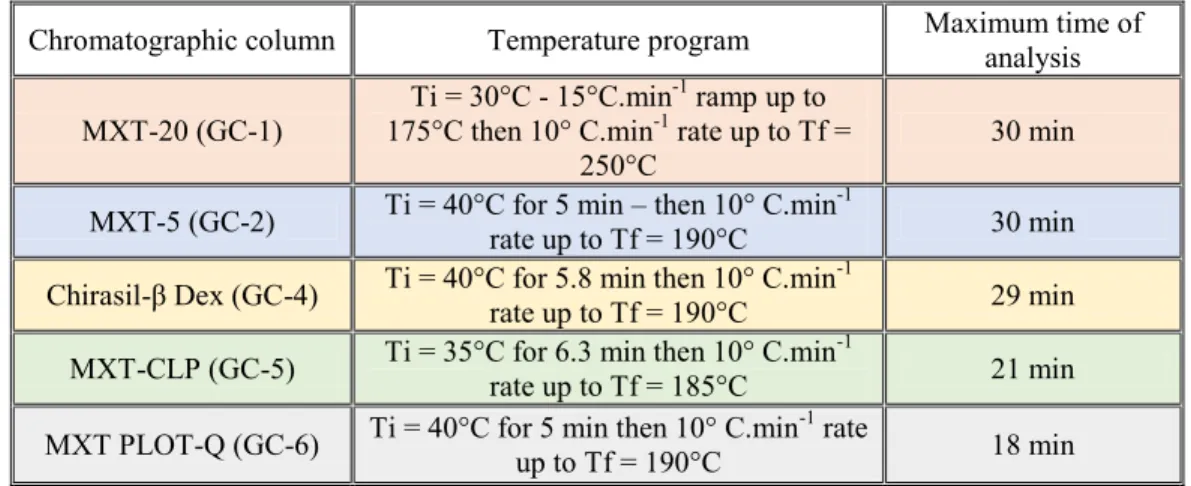
analysis, it is of interest to follow the evolution of the retention times with the column 457
temperature. This allows an assessment of the extent of evolution of the retention times as well 458
as the possible modification of the elution order of the analytes. With this aim, we analyzed a 459
few of the studied chlorohydrocarbons and measured their retention times obtained at different 460
isothermal temperature programs in the 30-200°C range. Measuring the dead time for each 461
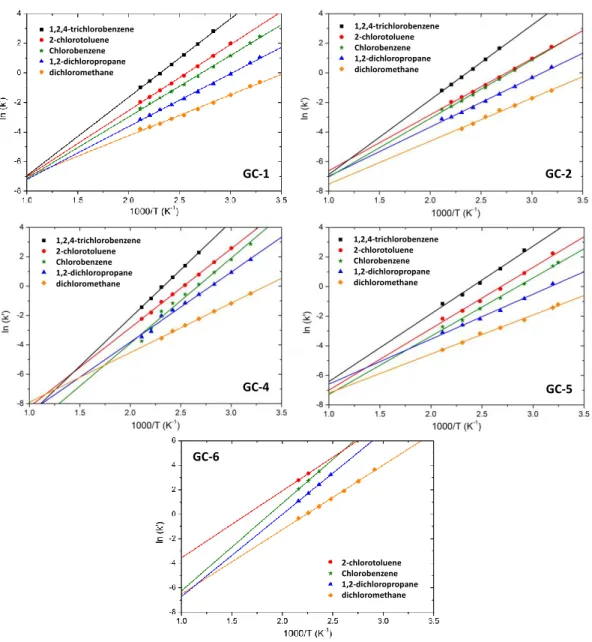
analysis allowed us to calculate the capacity factor k’, with ln(k’)H/T, with H the enthalpy
462
of exchange of the solute between the mobile and the stationary phase. We observe that the plots 463
are linear as expected, allowing us to calculate the values of H for all the compounds. Figure 4
464
demonstrates the linear fits, and Table 4 summarizes the values of k’ and H obtained with this
465
study. 466
In Figure 4, we observe that the k’ values are similar for all the WCOT columns, whereas the 467
PLOT column gives higher k’ values, representative of a higher retention power. We also 468
observe that for WCOT columns, the curves do not cross except possibly at high temperature. 469
However, the technical constraints of the SAM chromatograph do not allow to reach such high 470
temperatures. Therefore, a change in the order of elution of chlorohydrocarbons for these four 471
columns is unlikely, regardless of the temperature of the columns in the SAM-GC. This property 472
is of interest, as it makes the identification of the chlorohydrocarbons easier. For the GC-6 473
channel, some inversion of elution order can occur at the lowest temperatures. But for these 474
temperatures, the retention of the tested species was too high for their analysis with SAM within 475
the operating conditions of the instrument. Therefore, once again, the order of elution should 476
remain constant within the SAM operating conditions. 477
3.3. Analytical ability of the SAM-GC to detect chlorohydrocarbons evaluated in
478
laboratory under simulated flight operating conditions
479
3.3.1. Goal and experimental strategy
480
The SAM-GCMS instrument has enabled the separation, detection and identification of 481
organo-chlorinated compounds in different samples collected by Curiosity on Mars (11, 13, 14, 482
17). To support ongoing work, and to better anticipate flight data and their interpretation, an 483
additional objective of this study was to build a database of retention times of the chlorinated 484
compounds detected or potentially present in the chromatograms obtained with SAM on Mars, or 485
those which could potentially outgas from samples in future analyses. Although SAM analyses 486
are constrained by various parameters that influence the analytical conditions, we were able to 487
reproduce the constraints related to the GC columns operation. The two major constraints in 488
reproducing flight conditions in the laboratory were a limited time of analysis related to the 489
thermal constraints of the SAM instrument components, and the carrier gas pressure 490
mechanically and permanently set at 0.9 bar. 491
For this part of the study, spare SAM GC columns were used (Table 2) in SAM-like 492
operating conditions. To mimic the best SAM-flight carrier gas flow conditions, the flow 493
restriction method described in Section 2.4 was used. The temperature programs used for each 494
column and their maximum time of analysis allowed (measured in flight or induced by the 495
constraints of the analytical channel considered) are presentedTable 5.
496 497
3.3.2 Range of chlorohydrocarbons detectable under SAM flight operating conditions
498
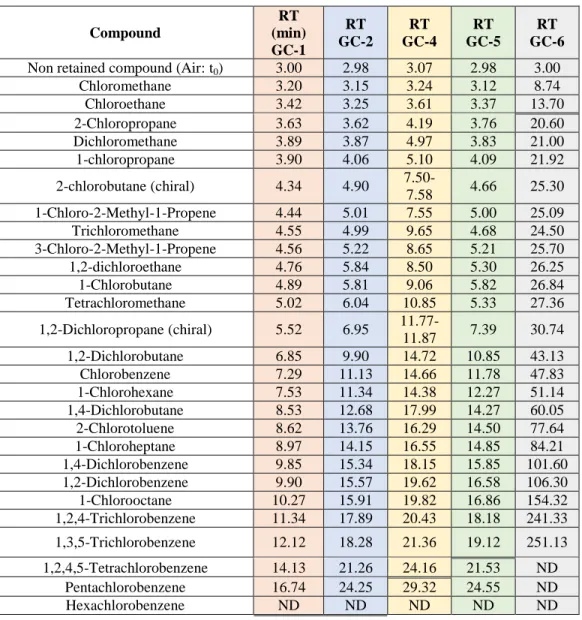
To evaluate the elution properties of the SAM-GC columns and help the attribution 499
of peaks observed in SAM chromatograms, the retention times of 26 organo-chlorinated 500
compounds (Table 1) were measured in the laboratory using both GCMS described in 501
Section 2.3. The retention times measured are presented in Table 6. Figure 5 shows 502
chromatograms obtained after analyzing the same set of chlorohydrocarbons on all four 503
WCOT columns studied. Figure 6 presents the analytical capabilities of the PLOT column 504
used for the GC-6 channel of the SAM instrument. 505
The maximal times of analysis of each column (Table 5) are represented by a double line 506
in Table 6 and by a dash-line of the color corresponding to each column in the chromatograms 507
(Figure 5 and Figure 6). All the chlorohydrocarbons with retention times lower or equal to these 508
maximum time of analyses are detectable by the SAM-GC if they are present in the gases 509
released by the solid samples collected by Curiosity and submitted to thermal or chemical 510
treatment in SAM. The compounds eluted beyond these limits are not detectable within the 511
current flight operating conditions. These results show that the columns bonded with liquid 512
stationary phases are able to elute most of the tested chlorohydrocarbons within the limited time 513
of analysis of the instrument for the columns considered. Only Hexachlorobenzene cannot elute 514
on time for any of the SAM-GC WCOT columns, and Pentachlorobenzene would only be eluted 515
on time with the GC-1 and GC-2 columns, in the flight conditions simulated in laboratory. With 516
the PLOT column used in the GC-6 channel, only a limited number of compounds, among those 517
selected for this study, elutes within the given maximum time of analysis, chloroethane being the 518
heavier one. Despite we were able to elute the 1,3,5-trichlorobenzene with a retention time of 519
251.10 minutes in the laboratory, such a high retention time combined to the thermal limitations 520
of the GC-6 column makes this molecule non detectable with the SAM instrument on Mars. 521
By the end of the Curiosity mission on Mars, some margins could be used to push the 522
instrument to its limit, or develop new strategies to analyze a sample could be imagined (e.g. two 523
successive chromatograms of the same sample to elute the compounds remaining in the column 524
after a first run) to increase the maximum time of analysis on critical chromatographic channels 525
(GC-5 for instance). However, the operating constraints are so tight that it is not expected to 526
significantly increase this time without damaging the chromatograph. The consequence of these 527
limitations is that the columns MXT-20 (GC-1), MXT-5 (GC-2), and Chirasil-β Dex (GC-4) can 528
elute and detect all the chlorohydrocarbons from chloromethane to pentachlorobenzene within 529
the SAM instrument analytical conditions, and the MXT-CLP (GC-5) column is limited to the 530
trichlorobenzene isomers. The Q-PLOT column (GC-6) is limited to the lightest gaseous 531
chlorinated compounds such as the chloromethane and the chloroethane. However, its high 532
retention power could be useful in the future to attempt quantifying the lightest 533
chlorohydrocarbons which can be coeluted on the other columns. 534
To conclude, even if the limitation of the maximal time of analysis of the SAM-GC could 535
result in the non-detection of chlorohydrocarbons because of their too late elution (e.g. 536
tetrachlorobenzene on the GC-5 channel (14) the instrument is capable to elute and detect a wide 537
range of alkyl and monoaromatic chlorohydrocarbons that can be formed during the pyrolysis or 538
the derivatization of a sample of Mars rocks. This capability is sufficient to give an overview of 539
the main chlorohydrocarbons released by the sample preparation process from which 540
information about the nature of the sample compounds and reactivity can be deduced. 541
3.3.3 Separation power of the SAM-GC columns under the flight operating
543
conditions
544
Under the nominal SAM-flight operating conditions which are similar for all the 545
columns, we observe that the order of elution of the chlorohydrocarbons selected for the study is 546
quite comparable. For GC-1 and GC-2, this is true for almost all the compounds. This could be 547
expected as the stationary phases of the corresponding columns are very similar 548
(polydimethylsiloxane partly (PDMS) substituted by phenyl), with only a difference in the 549
concentration in phenyl (20% and 5% respectively). This means that the modification in polarity 550
of the stationary phase induced by the variation of phenyl concentration is not sufficient to 551
significantly change the retention mechanisms of the chlorohydrocarbons analyzed. With both 552
columns, the number of coelution observed is limited (<2) and the peaks shape is quite nominal. 553
For GC-4, more co-elutions are observed (>3) compared to GC-1 and GC-2. This difference is 554
mainly due to a peak broadening generally observed with this type of stationary phase, and a 555
modification in the retention of the compounds that lead to longer retention times for all the 556
analytes, as it was previously described. In term of selectivity, even if not systematically, it 557
seems that the multi-chlorinated alkyl chlorohydrocarbons are rather more retained with GC-4, 558
leading to significant elution order changes, such as for 1,4-dichlorobutane. The source for this 559
change of selectivity is difficult to determine as it can be due to the absence of phenyl in the 560
stationary phase of the column, to the presence of cyclodextrin diluted in the PDMS, or both 561
effects. Regarding GC-5, we notice that the separation pattern is very similar to the GC-2 one. 562
The only exceptions are the multi-chlorinated methanes which are much less retained with GC5. 563
This means that the stationary phases used in these columns are quite similar in term of polarity, 564
at least for chlorohydrocarbons. Even if we have no details about the composition of the GC-5 565
stationary phase, our result show that it should be made of PDMS contain phenyl substituents at 566
concentrations equivalent to the GC-2 stationary phase, and an additional substituent (CNPP) 567
explaining the few differences in retention observed. It is possible that the difference in 568
selectivity between those two columns would be more important for other chemical families and 569
would be a key parameter to select either GC-2 or GC-5 for an analysis. 570
Depending on the objective given for the analysis of a sample, it is possible to select the 571
more appropriate column among the five ones integrated in the SAM-GC for analysing organic 572
molecules. This is obvious that for a broad screening of chlorohydrocarbons, the four WCOT 573
columns are more appropriate to be used, but we showed that GC-1, GC-2 and GC-5 channels 574
are preferable as they achieve a reasonable separation of all the tested compounds, regardless of 575
their mass. The last WCOT column, GC-4, shows a better separation of the lightest 576
chlorohydrocarbons but more heavier compounds are coeluted. For this reason, GC-4 should be 577
preferred to enhance the separation of the lightest chlorohydrocarbons if necessary. Finally, the 578
PLOT column should be used to specifically resolve chloromethane from chloroethane, for 579
quantification requirements for instance. It is interesting to underline that SAM-GC can work 580
with two columns working in parallel. Also, if the separation of both light and heavier 581
chlorohydrocarbons is required in one unique run, an analytical strategy can consist in selecting 582
the appropriate complementary columns to meet this objective, e.g. GC-5 and GC-6. Finally, we 583
must keep in mind that the chlorohydrocarbons analysed with the SAM instrument on Mars are 584
not the only chemical compounds released by the sample. Also, even if the detection benefits 585
from the mass spectrometric measurement, additional coelution with non chlorohydrocarbons 586
organic compounds should be limited to prevent any ambiguity in the compounds identification 587
(2, 17). 588
To conclude, the study of the separation achieved with the SAM chromatograph under 589
flight-like conditions shows that the combination of columns selected are able to separate all the 590
alkylated and mono-aromatic compounds tested within the limit of time imposed by the flight 591
instrument technical constraints, even if the instrument design did not originally consider the 592
presence of these compounds among the chemical species released by the soil and rock samples. 593
4. Conclusion
594
Whereas the detection of chlorohydrocarbons was not originally planned in the 595
development of the SAM instrument, we showed that the set of five columns selected for 596
achieving the chromatographic analysis of organic compounds is suited for the separation and 597
detection of a wide range of aliphatic and monoaromatic chlorinated organics within the 598
constrained operating conditions used on Mars. These operating conditions should allow a high 599
level of efficiency of all the columns to be maintained throughout the duration of the mission. 600
While the qualitative study of the columns used in the GC-5 channel already allowed to identify 601
and quantify several chlorine bearing organic molecules (11, 14, 17), the work presented in this 602
paper demonstrates the complementarity of the chromatographic columns bonded with different 603
stationary phases and selected for the SAM instrument to achieve the separation and 604
identification of alkyl chlorohydrocarbons up to 1-Chlrooctane, and monoaromatic 605
chlorohydrocarbons up to Pentachlorobenzene. The conservation of the order of elution of the 606
chlorohydrocarbons for all the columns regardless of the operating temperature used will also 607
simplify the identification of the detected molecules throughout the Curiosity mission. This 608
analytical capability will be precious in order to extract the most interesting information about 609
the composition and reactivity of the Mars samples collected by the rover and analyzed with 610
SAM, thus allowing to make great progress in the characterization of the Gale crater 611
environment and its potential for past habitability. 612
613
Acknowledgments
614
The authors acknowledge the financial support of the French national space agency, the 615
Centre National d’Etudes Spatiales (CNES) (SAM-GC grant). 616
References
617
1. Grotzinger JP, Crisp J, Vasavada AR, Anderson RC, Baker CJ, Barry R, et al. Mars Science Laboratory
618
Mission and Science Investigation. Space Science Reviews. 2012;170(1-4):5-56. 619
2. Mahaffy P, Webster C, Cabane M, Conrad P, Coll P, Atreya S, et al. The Sample Analysis at Mars
620
Investigation and Instrument Suite. Space Science Reviews. 2012;170(1-4):401-78. 621
3. Westall F, Brack A. The Importance of Water for Life. Space Science Reviews. 2018;214(2):50.
622
4. Bibring J-P, Langevin Y, Mustard JF, Poulet F, Arvidson R, Gendrin A, et al. Global Mineralogical and
623
Aqueous Mars History Derived from OMEGA/Mars Express Data 624
10.1126/science.1122659. Science. 2006;312(5772):400-4. 625
5. Carter J, Loizeau D, Mangold N, Poulet F, Bibring JP. Widespread surface weathering on early Mars: A
626
case for a warmer and wetter climate. Icarus. 2015;248:373-82. 627
6. Flynn GJ. The delivery of organic matter from asteroids and comets to the early surface of Mars. Earth
628
Moon and Planets. 1996;72:469-74. 629
7. Biemann K, Oro J, Toulmin P, Orgel LE, Nier AO, Anderson DM, et al. The search for organic substances
630
and inorganic volatile compounds in the surface of Mars. Journal of Geophysical Research. 1977;82(28):4641-58. 631
8. Hecht MH, Kounaves SP, Quinn RC, West SJ, Young SMM, Ming DW, et al. Detection of Perchlorate and
632
the Soluble Chemistry of Martian Soil at the Phoenix Lander Site. Science. 2009;325(5936):64-7. 633
9. Sutter B, McAdam AC, Mahaffy PR, Ming DW, Edgett KS, Rampe EB, et al. Evolved gas analyses of
634
sedimentary rocks and eolian sediment in Gale Crater, Mars: Results of the Curiosity rover's sample analysis at 635
Mars instrument from Yellowknife Bay to the Namib Dune. Journal of Geophysical Research: Planets. 636
2017;122(12):2574-609. 637
10. Navarro-Gonzalez R, Vargas E, de la Rosa J, Raga AC, McKay CP. Reanalysis of the Viking results
638
suggests perchlorate and organics at midlatitudes on Mars. Journal of Geophysical Research-Planets. 2010;115. 639
11. Freissinet C, Glavin DP, Mahaffy PR, Miller KE, Eigenbrode JL, Summons RE, et al. Organic molecules in
640
the Sheepbed Mudstone, Gale Crater, Mars. Journal of Geophysical Research-Planets. 2015;120(3):495-514. 641
12. Guzman M, McKay CP, Quinn RC, Szopa C, Davila AF, Navarro-González R, et al. Identification of
642
Chlorobenzene in the Viking Gas Chromatograph-Mass Spectrometer Data Sets: Reanalysis of Viking Mission Data 643
Consistent With Aromatic Organic Compounds on Mars. Journal of Geophysical Research: Planets. 644
2018;123(7):1674-83. 645
13. Glavin DP, Freissinet C, Miller KE, Eigenbrode JL, Brunner AE, Buch A, et al. Evidence for perchlorates
646
and the origin of chlorinated hydrocarbons detected by SAM at the Rocknest aeolian deposit in Gale Crater. Journal 647
of Geophysical Research: Planets. 2013;118:1-18. 648
14. Szopa C, Freissinet C, Glavin DP, Millan M, Buch A, Franz HB, et al. Detection of indigenous organic
649
matter at the surface of Mars by the SAM instrument onboard Curiosity. Astrobiology. Under Review. 650
15. Leshin LA, Mahaffy PR, Webster CR, Cabane M, Coll P, Conrad PG, et al. Volatile, Isotope, and Organic
651
Analysis of Martian Fines with the Mars Curiosity Rover. Science. 2013;341(6153):9. 652
16. DeZeeuw J, Peene J, Jansen H-G, Lou X. A simple way to speed up separation by GC-MS using short 0.53
653
mm columns and vacuum outlet conditions. Journal of High Resolution Chromatography. 2000;23(12):677-80. 654
17. Millan M, Szopa C, Buch A, Coll P, Glavin DP, Freissinet C, et al. In situ analysis of martian regolith with
655
the SAM experiment during the first mars year of the MSL mission: Identification of organic molecules by gas 656
chromatography from laboratory measurements. Planetary and Space Science. 2016;129:88-102. 657
Figure captions:
659
Figure 1. Comparison of the temperature programs applied to the three GC columns that have been used in flight so
660
far. The measured flight temperature program is plotted in blue and the temperature programs applied in the 661
laboratory are represented with a red dash-line. The times to which the injection traps of the GC-4 and GC-5 662
channels are activated are represented on the abscissa axis by black stars and are called « IT flash ». As the GC-1 663
channel is not equipped with an injection trap, no black star is present in the graph. 664
665
Figure 2. Evolution of the HEPT (mm) as a function of the mean linear carrier gas velocity (cm.s-1) for the GC-6
666
column doted of a solid stationary phase. Points correspond to the experimental data and the lines to the fits from the 667
Van-Deemter-Golay equation. The black line, represented at 12.82 cm.s-1, corresponds to the mean linear carrier gas
668
velocity with the inlet column theoretical pressure on the SAM-flight instrument. 669
670
Figure 3. Evolution of the HEPT (mm) as a function of the mean linear carrier gas velocity (cm.s-1) for the
SAM-671
GC columns doted of liquid stationary phases. H (mm) is plotted in function of in cm.s-1. Points correspond to the
672
experimental data and the lines to the fits plotted from the Van-Deemter Golay equation. The carrier gas velocities, 673
corresponding to pressures measured in flight, were represented, when possible, by a black line, or theoretically 674
evaluated. Crosses correspond to the H calculated from the flight data of dichloromethane, a chlorohydrocarbon 675
systematically detected and present in all flight chromatograms. 676
677
Figure 4. Evolution of ln (k’) in function of 1000/T for the chlorinated compounds on the SAM-GC columns from
678
channels GC-1, GC-2, GC-4, GC-5 and GC-6. Experimental data were obtained for a temperature range between 40 679
and 200°C corresponding to the extreme temperatures used for SAM. A linear regression has been fitted to the 680
experimental data points on the range of the figure. 681
682
Figure 5. Chromatograms of the chlorohydrocarbons obtained for the channels GC-1 (MXT-20), GC-2 (MXT-5),
683
GC-4 (Chirasil-β Dex) and GC-5 (MXT-CLP) in SAM-flight operating conditions listed in Table 4. Compounds: 1: 684
2-chloropropane, 2: dichloromethane, 3: 1-chloro-2-methyl-1-propene, 4: trichloromethane, 5: 3-chloro-2-methyl-1-685
propene, 6: 1-chlorobutane, 7: tetrachloromethane, 8: 1,2-dichloropropane, 9: 1,2-dichlorobutane, 10 : 686
chlorobenzene, 11: chlorohexane, 12: 1,4-dichlorobutane, 13: 2-chlorotoluene, 14: 1,2-dichlorobenzene, 15: 1-687
chlorooctane, 16: 1,2,4-trichlorobenzene, 17: 1,3,5-trichlorobenzene, 18: 1,2,4,5-tétrachlorobenzene, 19: 688
pentachlorobenzene, 20: 1-chloroheptane. Compounds marked with a star * are co-eluted. 689
690
Figure 6. Chromatogram of the chlorohydrocarbons obtained for the channel GC-6 (Q-Plot) in SAM-flight
691
operating conditions listed in Table 4. Compounds: 1: Non-retained compound (Air), 2: chloromethane, 3: 692
chloroethane, 4: dichloromethane, 5: 2-chloropropane, 6: trichloromethane, 7: 1-chloro-2-methyl-1-propene, 8: 3-693
chloro-2-methyl-1-propene, 9: 1-chlorobutane, 10: tetrachloromethane, 11: dichloropropane, 12: 1,2-694
dichlorobutane, 13: Chlorobenzene, 14: 1-chlorohexane, 15: 1,4-dichlorobutane, 16: 2-chlorotoluene.
695
Figure 1. Comparison of the temperature programs applied to the three GC columns that have been used in flight so
far. The measured flight temperature program is plotted in blue and the temperature programs applied in the laboratory are represented with a red dash-line. The times to which the injection traps of the GC-4 and GC-5 channels are activated are represented on the abscissa axis by black stars and are called « IT flash ». As the GC-1 channel is not equipped with an injection trap, no black star is present in the graph.
Figure 2. Evolution of the HEPT (mm) as a function of the mean linear carrier gas velocity (cm.s-1
) for the GC-6 column bonded with a solid stationary phase. Points correspond to the experimental data and the lines to the fits from
the Van-Deemter-Golay equation. The black line, represented at 12.82 cm.s-1, corresponds to the mean linear carrier
gas velocity with the inlet column theoretical pressure on the SAM-flight instrument.
Figure 3. Evolution of the HEPT (mm) as a function of the mean linear carrier gas velocity u" (cm.s-1) for the
SAM-GC columns doted of liquid stationary phases. H (mm) is plotted in function of u" in cm.s-1. Points correspond to the
experimental data and the lines to the fits plotted from the Van-Deemter Golay equation. The carrier gas velocities, corresponding to pressures measured in flight, were represented, when possible, by a black line, or theoretically evaluated. Crosses correspond to the H calculated from the flight data of dichloromethane, a chlorohydrocarbon
!"
SAM MXT-20 GC-1 (35°C) MXT-5 GC-2 (185°C) MXT-20 GC-1 (185°C) MXT-5 GC-2 (35°C)!"
SAM Chirasil-β Dex GC-4 (35°C) Chirasil-β DexGC-4 (185°C) MXT-CLP GC-5 (35°C) MXT-CLP GC-5 (185°C)!"
SAM!"
SAM!"
SAM #u(cm/s) #u(cm/s) #u(cm/s) #u(cm/s) #u(cm/s) #u(cm/s) #u(cm/s) #u(cm/s) H (m m ) H (m m ) H (m m ) H (m m ) H (m m ) H (m m ) H (m m ) H (m m ) dichloromethane 1,2-dichloropropane chlorobenzene dichloromethane 1,2-dichloropropane chlorobenzene dichloromethane 1,2-dichloropropane chlorobenzene 1-chlorobutane 3-chloro-2-methyl-1-propene 1,2-dichloropropane dichloromethane dichloromethane 1,2-dichloropropane Chlorobenzene 1,2,4-trichlorobenzene 1-chlorooctane dichloromethane 1,2-dichloropropane Chlorobenzene 1,2,4-trichlorobenzene 1-chlorooctane dichloromethane 1,2-dichloropropane Chlorobenzene 1,2,4-trichlorobenzene 1-chlorooctane dichloromethane 1,2-dichloropropane Chlorobenzene 1,2,4-trichlorobenzene 1-chlorooctane!"
SAM (theoritical)!"
SAM (theoritical)!"
SAMFigure 4. Evolution of ln (k’) in function of 1000/T for the chlorinated compounds on the SAM-GC columns from
channels GC-1, GC-2, GC-4, GC-5 and GC-6. Experimental data were obtained for a temperature range between 30 and 200°C corresponding to the extreme temperatures used for SAM. A linear regression has been fitted to the experimental data points on the range of the figure.
GC-1 GC-2 GC-5 GC-4 GC-6 1,2,4-trichlorobenzene 2-chlorotoluene Chlorobenzene 1,2-dichloropropane dichloromethane 1,2,4-trichlorobenzene 2-chlorotoluene Chlorobenzene 1,2-dichloropropane dichloromethane 1,2,4-trichlorobenzene 2-chlorotoluene Chlorobenzene 1,2-dichloropropane dichloromethane 1,2,4-trichlorobenzene 2-chlorotoluene Chlorobenzene 1,2-dichloropropane dichloromethane 2-chlorotoluene Chlorobenzene 1,2-dichloropropane dichloromethane Figure 4