HD28
0i3
WORKING
PAPER
ALFRED
P.SLOAN
SCHOOL
OF
MANAGEMENT
Decompostion
Algorithms
for
Analyzing
Transient
Phenomena
inMulti-class
Queuing
Networks
in
Air Transportation
Dimitris Bertsimas,
Amedeo
Odoni
and
Michael
D.
Peterson
WP#
-3540-93
MSA
January, 1993
MASSACHUSETTS
INSTITUTE
OF
TECHNOLOGY
50
MEMORIAL
DRIVE
CAMBRIDGE,
MASSACHUSETTS
02139
\
M.LT.
UBRARIES
Decompostion
Algorithms
for
Analyzing
Transient
Phenomena
inMulti-class
Queuing
Networks
inAir Transportation
Dimitris Bertsimas,
Amedeo
Odoni
and
Michael
D.
Peterson
ft^AR2.5
1993
Decomposition Algorithms
for
Analyzing
Transient
Phenomena
in
Multi-class
Queuing
Networks
in
Air
Transportation
Michael D. Peterson*
Dimitris
J.Bertsimas^
Amedeo
R.
Odoni^
January
8,1993
Abstract
In a previous paper (Peterson, Bertsimas, and Odoni 1992),
we
studied thephe-nomenon
oftransientcongestioninlandingsatahub
airportand developed arecursiveapproach for computing
moments
ofqueue lengths and waiting times. In this paper we extend our approach to a network, developing two approximations based on themethod
used for thesingle hub.We
presentcomputational results fora simple 2-hub network and indicate the usefulness ofthe approach in analyzing the interactionbe-tween hubs. Although our motivation is
drawn
from air transportation, ourmethod
is applicable to all multi-class queuing networks where service capacity at a station
may
be modeled as aMarkov
orsemi-Markov process.Our method
represents anew
approach for analyzing transient congestionphenomena
insuch networks.Airi^ort congestion
and
delay iiavcgrown
significantly over the last decade.By
1986ground
delaysatdomestic air])ortsaveraged2000
iiours per day, the equivalent ofgrounding
the entire fleet of Delta Airlines at that time (2oO aircraft) for
one
day
(Donoghue
1986).In 1990, 21 airports in the U.S.
exceeded
20,000 hours ofdelay, with 12more
projected toexceedthis total
by
1997 (National Transi)orlation FiesearchBoard
1991). Thisamounts
to'SchoolofPublicand Environmental Affairs, Indiana University, Blooniington, Indiana
^.Sloan .SchoolofManagement, Massachusetts InstituteofTechnology, Cambridge, Massachusetts '[)epartiiient of Aeronautics and Astronautics. Mas.sachusetls Institute of Technology, Cambridge, Massachusetts
multi-class
queuing
networks.Our
model
provides important qualitative insighton
the interactionbetween
hubs
and
improves
our understanding ofhub-and-spoke
syste:ns.With
ourmodel
we
can
address anumber
of interesting questions, such as:•
To what
degreedo network
effects altertheresults obtainedfrom
thestudyofasinglehub?
• Wliat
network
effects areproduced
by
delay propagation?•
What
effectdoes thedegreeofconnectivitybetween hubs
haveon system
congestion?•
Wiat
are the effectsofhub
isolation strategies—
strategiesinwhich
a hub'sconnec-tivity to othersis reduced
—
on
schedule reliability?The
paper is organized as follows, in Section 1we
review briefly themethodology
ofthe algorithm for a single
queue
and
describe thequeuing
network
context of the present problem. In Sections 2and
3we
outlinetwo
decomposition approacheswhich
exploit thisalgorithm. Section 2 describes a relatively simple
method
inwhich
downstream
arrivals are adjusted according to expectedupstream
waiting times. Section 3 describes amore
involved
approach
which usessecondmoment
infonnationabout
delays to giveastochastic description ofdownstream
arrivalrates In Section 4we
employ
theseapproximation
meth-ods together with a simple simulation jirocedureon
a2-hub
network.We
find thatunder
moderate
traffic conditions, the interactionsbetween hubs do
not alterdemand
patternssignificantly, so that the j^redictions ofwaiting times i^roduced
by
the different approachesare very close.
Under
heavy
traffic conditions with closely spaced banks, higher waitingtimes act to
smooth
thedemand
]>attern significantly overthe day. In this lattersituation, thetwo
recursivealgorithms deviate further from simulation than in the fonner case.We
also find that isolation of a ]iroi)lein
hub
]irolects otherhubs
from schedule disruption atthe cost of further disruption at the source of the delays.
We
provide concluding remfirksin Section 5.
1
The
Basic
Model
Incoming
aircraft at an airiiort require service at three stations: a landing runway, a gate,p„{m)=
Pr{(t,m)^(i,m+1))
=
Pr[T.>
m+1
| T.
>
m|
.
(1)
We
next define the followingrandom
variables:Qk
=
Queue
length atend
ofinterval k,Wk
=
Waiting
time atend
ofinterval fc,Ck
=
Capacitystate atend
of interval k,Ak
=
Age
ofcurrent capacitystate atend
ofinterval k,T,
=
Random
lifetime ofcapacitystate i.For
mean
queue
lengthwe
introduce the notationQk(l,I,
m,
q)=
E
\Qk\Qi=q,Ci
=
i,Ai=
m]
(2)A-=: 1,. .
.,A', i
=
I,...,S,m
=
1,...,A/,
where
qmax(A"ii) is themaximum
attainablequeue
length at theend
ofperiodk, given that at that time thecapacity stateis i. This obeys the recursion9max(A".0
=
|<?max(''"-l)+
>^k-
Mt]^ (3)where
qmax(A")=
maXj
(jmaxC^,«)andx^ —
max(x,0). Similarly, forwaitingtimeswe
employ
the notation
WkiL
2,m,
q)=
E\Wk
IQ,=
9,C,=
z,Ai
=
m\.
(4)We
write the secondmoment
analogs of (2)and
(4) as Ql{l,i,in,q)and Wl{l,i,m,q),
resjieotiveiy.
Let (x
A
y) denote niiii(x,y).The
quantitiesQk{Li,m,q),
Q^(l,i,rn,q),Wk(l,i,m,q),
and
W^(/,I.m,
q) can becalculated recursively, (Peterson, Bertsimas,and Odoni
1992).We
rejjeat here the basic equations:
Qk{l.t.m,q)
=
^p,,(»»)Q,
(/+!,J. !,((?+ A,+, -//,)+)+
P„{m)Qk
(/+l.!,m+l,(q+
A,+i-
(i,)'^), (5)where
i^
=
mth
stopon
itinerary ofaircraft v,t"^
=
scheduledarrival time atmth
stop for aircraft v,s^
=
siaclc timebetween
stopsm
—
1and
»n for aircraft v.Aircraft slack
between
stopsm
—
1and
m
is theamount
of time available to the aircraft at stop rn-
1beyond
theminimal
time necessary to tuni the aircraft around. In thenetwork
schedulesareno
longerexogenous
and
deterministic, asdelaysatone
airportaffectthe schedules at others. In the terminology of
queuing
theory, thesystem
is a multi-classqueuing
network, with theclassesbeingthedifferent aircraftwiththeirindividualitineraries.Service capacityat each airportisan autocorrelatedstocliasticprocess described
by
asemi-Markov
process orMarkov
chain.Thus
our task is to describe the transient behavior ofa multi-class
queuing network
with autocorrelated service rates at each node. This high degree ofcomplexity suggests thatapproximation
methods
are necessary.2
A
Simple
Decomposition
Approach
A
first ap]5roximationapproach
is based on the following idea.Suppose
that at the start of the day,one
knows
the schedules for all aircraft operating in the network.Under
theassumption
that delays arezero at the outset of the day, the schedule for the initial periodofthe
day
is fixed.Hence
the first ])erioddemands
are fixed,and
mean
queue
lengthsand
waiting timesforeach airjiortduring this jieriod
may
bedetermined
by
applying equations(5) - (14) toeach air]iort.
The
resultingexjiected waitingtimes forperiod 1 areestimates ofthe delay encountered by all aircraft scheduled to land in this j^eriod.
Taking
intoaccountthe slack wliich these aircraft have in their .sclie<kile,s
and
ujidating future arrival streamsaccordingly, one thenfixes
demand
forthe next i>erio(l,calculates the resultingnew
expected waiting times,and
so forth.More
formally, let d^ rei>resent the current cumulative delay for aircraft v—
i.e. asaircraft r jjroceeds through its itinerary, ff is the current
amount
bywhich
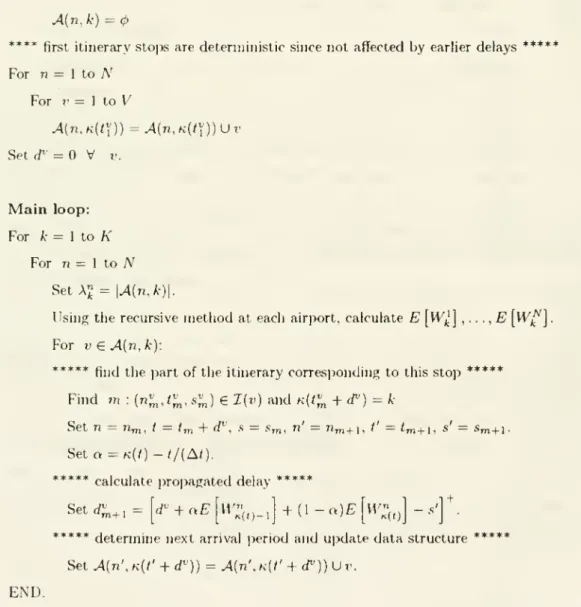
it is behindschedule. Furtherdefine the terms
Ain.k)
=
setof aircraft scheduletl to land at r? ni period k,First
Decomposition
Algorithmfor AirNetwork
CongestionInitialize:
For k
=
\ toK
For
n
=
1 toN
A(n,k)
=
<p**** first itinerary sto])s are deteniiinistic sincenot affected
by
earlierdelays ***** For 77
=
1 toN
For V=
] toV
A(n,K{t\))=A{n,K(i\))Uv
Set d'=0
V
V.Main
loop: For k=
\ toK
For r?=
1 toN
Set A;J
=
\A{n,k)\.Using
the recursivemethod
at eacli airport, calculateE
[^k]
i•••i
^
l^k']For V
€ A(n,
k):***** find the ])art ofthe itinerary corresjionding to
this stop *****
Find
m
; (n^^J^^,s'^)€
I(v)and
K{t^^+
<f)=
A"Set n
=
rim, '=
'm+
d", S=
Sm, ri'=
n^+i,
''=
tm+l, «'=
Sm+l-Set
a
=
k(0
-t/{At).
*****calculate
propagated
delay *****Set d;„+ , d'
+
aE
M'",,, "(<) 1++
(1-a)£
***** detemiine next arrival period
and
ui>date data structure *****Set A{n',K{t'
+
d''))=
A(n\K{l'
+
d"))Uv.
END.
where
U
is the complexity of the singlehub
recursive algorithm for waiting timemoments
withdeterministic input.
Proof:
Tlie choice ofdata structure
means
that tlieinnerupdating
loop (the disaggregationproce-dure) requires only
0{V)
time.Hence
the bottleneckofthe algorithm consists ofrepeatedcalls to asubroutine for
computing expected
waiting times.Because
for each time periodk the algorithm
must
recalculate all ofthe preceding expected waiting times, overallcom-plexity is
0{KNII).
D
In Peterson, Bertsimas,and Odoni
(1992) itwas
shown
that for aMarkov
model
of capacity, thecomplexity ofthe recursive algoritlim for a singlehub
is OiS"^K'^Q^ax)
Thus
iftheMarkov
capacitymodel
is specified with
5
capacity states, overall complexity forAlgorithm
1 is0(NS^K^Qmi^^).
The
presenceof the additional factorK
arisesfrom
thefactthat the recursion ateachhub
isrestarted
from
time ateachnew
]>eriod.Thus
in thefirst global iterationthealgorithmfinds
EI^Vl
. . .E\W^^], in the second it finds E|IV/|.. .E\Wl^] and
E\Wj]
.. .E\nfl
and
so forth. This duplication ofeffort could be avoided if it were possible to store within the
single
hub
algorithm theend
conditionsof iteration kasinitialconditions foriteration k+l.However,
even for the simplerMarkov
cajmcity model, thiswould
mean
storing the jointl^robabilities for
queue
lengthand
cai^acity. Since comi^uting these probabilities requires0((5max) times as
much
effort as for the exjiectatioii alone (see Peterson, Bertsimas,and
Odoni
1992), there isno
benefit to doing so unless the probabilitiesthemselves are desired forsome
other reason.A
more
jjractical imiirovement is to have the recursion restart only everym
periods,where
m
is theminimum
number
of jieriods any aircraft hasbetween
scheduled stops.Under
thisscheme, the aigorithniisrun forthefirstm
periods, arrivalsareupdated, then thealgorithmisrun for the first 2in jienods.
and
so on.Whereas
in the original implementation,the
number
of iterations iierformed witlnn the recursive algorithm is1 -^24- ...+ /\'
-
K{K+\)/2,
under
thisnew
scheme
it ism
+
2m
+
:\m -\-Cm
+
A"
=
C.(C,+
1)7n/2+
A"
n.k<2
Fig^ure 3;
The
traffic splittingphenomenon:
alternative future aircraft pathsdepend
upon
delay encountered.
The numbers
{p,;} indicateprobabilities.In order tocomjjlete the
updating
scheme, the algorithmmust
translate the probabilis-tic infoniiationon
individual aircraft into informationon
future arrival rates. Define the stochastic arrival quantitiesA(n,k)
-
number
ofarrivals at airjjortn
in period k.The
goal ofthisstejjoftheprocedure isto specify an api)roximate probability law for theserandom
variables. Forsome
user-sjiecifiednumber
R
(representing thenumber
of possiblevalues taken by the
random
variables) the algorithm estimatesnumbers
7"(1), . ..,7^(fl)and
A"(l),.. .,A"(ft) whichobey
the relationships\>r{Mn.k)
=
Xl(\)}=
-rrO).F'r{A(7,,A-)
=
A'/(2)}=
^."(S).\>r{Mv.k)
=
y^{R))
=
-yr(ff). (18)where
^7r(o
=
i (19)2. Translatio!) of these density functions into probabilistic descriptions offuture arrival
periodsforeachaircraft, asgiveninthe
parameters
p„(0),...,Pv{C)and/c„(0), .. .,/c„(C).3. Translationofthe individual aircraft
parameters
p„(0),. ..,PviC)and
A:„(0),...,kv(C)
into simple discretedistributions forthe
random
variables A(n,/c).4.
Updating
ofaircraft itinerariesand
airport arrival lists.The
fourth of these procedureswas
described in Section 2.The
first three aredescribed infurtherdetail in
what
follows,and
asununary
of the algorithm is given in Figure8.3.1
Obtaining
waiting
time
densities
Estimation of the densities
f{w) cannot
bedone on
the basis of the recursive algorithmalone,since this procedure gives only the first
two
moments
ofthe distribution.Knowledge
ofthe third
moment
would
giveenough
information todetermine a unique 2-point discrete distribution by solving the nonlinearsystem
P\W]+P2W2
=
E\W]
p,u-^+p2u>2
=
E[W^]
p,u,^,+P2wl
-
E[W^]
Pi
+
P2=
1Pi,p2,u'l,tti2
>
0. (22)for the values pi, p2, u'l.
and
w-j- However, thissystem
is not guaranteed to haveany
solution because of the])ositivity requirement.
An
alternativemetiiod issuggested liyMonte
C'arlomethods
(see e.g.Hammersley
and
Handscomb,
1964).. Consider a simjile simulation for a single airport inwhich
capacity,period by jieriod, is
determined
inMonte
Carlo fashion from theMarkov
chain orsemi-Markov
process.Prom
thesimulationwe
obtain thematrix ofobservationswhere
W"'
is the waiting time at theend
of jieriod k for themth
simulation. Orderingthe observations,
we
obtain histograms for the waiting times for each period, like theone
illustrated in Figure 4 for a constant arrival rate (p
%
0.85, A=
60 per hour).Note
the1.0
T
0.8••
6••
0.4
0.2..
ExponentialPlotfor PositiveObservationsof
WaitTimeatPeriod50(12.5Hours)
lOOORealiulioas
150 300 450 60(1
J=(ordered)observationnumber
Figure 5: Test forexponential distribution of positive waiting timerealizations
//
must
bedetermined
by solving the pair ofequations (omittingsubscripts) /•CXI^tL'n„n
+
(1-
(!)) / wiyc-'^"'-'^'-"Uw=
E\W\
6{w^,r,f
+
{]-
6)f
t/-2,/f-"(''-"'-")du,=
£[iy2] (24)*^U
mm
111 terms of the
mean
w
and
variance a-^we
obtain the solution (omittingsubscripts)(25)
(26)
g^
-
(»^-
Wmin)^2{w
-
Wm,n)Note
that 6 is always less than 1and
will be jionnegativeprovided that>
1.111 the tj^iicai case
where
Wm,n ^^zero, thisisequivalent to the condition that thecoefficientof variation forwaiting times exceeds 1
Only
in rare instances ofthe testspresentedshortlywas
this condition found not to hold. In tiiose c.uses, thejmrameter
6was
set toand
theentire distribution
was assumed
to be exi)onential.For practical reasons, it is necessary to choose
some
upper
bound
C
on
thenumber
ofperiods ofdelay to allow.
Hence
Xn'l.nkiv)
=
v(C-i)
Together withthe
numbers
{/.-^(c)}, the probabilities {pv(c)} thenconstituteaprobabilistic description ofthe next period inwhich
aircraft v willdemand
to land.3.3
Characterizing
arrivals
In order to translate the
numbers
{p^.ic)] into a probabilistic description of the futuredemand
rules A{n.k), define therandom
variable1 ifr
e
A{n',1} is delayed such that itsnext sto]) will be n at period k otherwise
This
random
variable denotes the "contribution" of an arrival at one placeand
time tothearrival rate at a future place
and
time.Note
that if the next stopofv€ A{n'
,I) is n, thenPr{A-„.,.„,(r)=
\}=p,(k-l).
In words, for aircraft i'
£ A(n'J),
the jirobability that it will contribute to the landingdemand
at airjiortn duringjieriodk (as,sumingthat n isitsnext scheduledstop) ispv{k—
l).The random
variables X„'i.nk('^') l>rovide the necessary connectionbetween
aircraftand
arrival rates.
Then
A(rK/.-)=
^^^A-„.,,„,(r).
(30)n'=I /<;,1=1
In words, thissaysthat thearrival rate at(ri,k) isthe
sum
ofall contributionsfrom previous pointsin theitineraries (see Figurefi).Thus
therandom
variables{A}
aresums
of Bernoullirandom
variables. DefiningNL{v.k)
=
next destination Ofaircraft i' after periodA-theexpectation is easilyobtained ius
E\Mn.k)]
=^^^E|A',..,,„,(")1-11'=I (<*. t.=1
=
EE
E
^^'(^--'^ (31) n'=l l<k v:NL(v.l)=no
o E 200+
150 100 •• 50 10Histogram
ofA
(1>22) (1000Realizations)n
15 20ArrivalsinPeriod22atHubI
25
Fiffure 7: Histo^aiiiofA(1,22) obtained
from
simulation.Unusual skewness
patternssucha^ tills
one
may
occur in the early part of theday
when
tiie contributingprior arrivals arestill largely deterministic.
considerable degreeof insensitivity tothe
demand
rate distribution.We
retain thenormalityassumption
whileacknowledging
its im])erfections.Although Algorithm
2 involvesconsiderablymore
modeling
work
thanAlgorithm
1, itscomjiutational complexity is not significantly higher, asour next result indicates.
Theorem
2The
coviplexity of Algontlmt 2 is0(RK
NU),
whereR
is the user-specifiednumber
of values used ni the approximate distributtoit for the arrival ratesand
U
is thecomplexity ofthe single hub recursive algorithmforwaiting time
moments
withdeterministicinput. Iftlie
Markov
capacitymodel
is specified untilS
capacity states, overallcomplexityisProof:
Within
the principal ioo]), the bottleneck ojieration remains that of calculating the waitingtime
moments
in the recursion.Because
the arrival stream is specified probabilisticallyrather than deterministically, there is an additional factor
R
equal to thenumber
ofvalues specified foreach arrival rate distribution.The
result follows.D
Both Algorithms
1and
2 are suitable forany
kindofnetwork.Without
the streamliningsuggested at the
end
of Section 2, running times aresomewhat
high. For example,on
asimple 2-airport
network
with A'=
80 periods ateach airport,Algorithm
1 takesabout one
hour on
aDEC-3100
workstation whileAlgorithm
2 takesabout
three hours (with /?=
3).With
the reduction in calls to the recursion achievedby
the streamlining procedure, thereis roughly tenfold
improvement
in these figures.Even
with thisimprovement, modeling
afull-size
network
of a large airline{400+
nodes) is adaunting
problem.On
the other hand,the
problem
is well suited to parallel computation, with different processors handling the individualnodes
and
a central processor controlling thebookkeeping
of aggregationand
disaggregationIn the])resentcontext, furthersiin])lification ispossible. Consider asingle carriertrying
to
understand
congestionin itsown
hul>and-spoke
network.Prom
this carrier'sperspective,delays at its hubs have fargreater implications fordisru])tion ofits schedule than delays at its spokes. This observation suggests a simplification: reduce the
hub-and-spoke network
to a
network
of hubs.That
is, keep track only of aircraft belonging to thehub
carrier,treat other arrivals as fixed,
and
treat all congestion delays other than thoseemanating
from
tiiehubs
as negligible. In the resulting network,we
incorjiorate spoke information insetting aircraft itineraries
As
before, these consist of ordered triples {(irm ^mi«„)}, butnow
each im refers to ahub
airjiortand
each .s„, reflects the total slack available to anaircraft
between
successive visits to hubs, including the slack available atan
interveningsjjoke. External aircraft
add
todemand
and
congestion in the system, but their arrivalschedules are considered fixed All mternal flights in the collaj>sed
network
appear
to takeplace
between
hubs, butfiiglil time,svary widelytoreflectthefact thatinreality, theaircrafthave intermediate si^oke stoi)s.
By
ignoringcongestion at the sjioke.s ofthesystem
and
concentrating onlyon
the hubs,we
can reducethesizeofa largeairline'snetwork
from400+
nodes
toperhaps
5 or6.These
changes reducethemodel'srealism. Init tiiereduced
model
should captureessentialbehavior.Since one of the
main
goals is to imjirove our understanding ofinteractionsbetween
hubs(e.g. the issue of isolating C'hicago), this sim|iliHcalion seenus to be furtiierjustified.
The
testing
and
analysis jjresented in tiie next section isconducted on
a simple2-hub network
isolation, by considering an instance in whicli the
two hubs have no
aircraft incommon
(p
=
0, the disconnected case)and an
instance in whicli they have all aircraft incommon
(p=
1, tiie fullyconnectedcase). In case 5we
examine
four instancesinwhich
aircraft slackis varied.
4.2
Results
and
Discussion
Considering cases 1-5 together,
we
note thatmodel parameters
should have a noticeableeffect
on
themechanics
of the network. For example, in theDFW
case (#1), waiting timesare of the
same
order as aircraft slack,and
there is substantial separationbetween major
traffic ])eaks. For these reasons,we
expect delaypropagation to be relatively lowand
have
a less disru]itive effect on the schedule. Incase 2,
on
theotherhand,major peaks
aremuch
closer together, traffic intensity is shar]>ly higher,
and
delay propagation should bemore
important.
Using
aDEC-3100
workstationwe
])erfonnedcomputations
fortest cases 1-5,usingboth
ofour recursion-based
approximations
aswell the thesimple simulation procedure discussed above.Our
investigation is primarilymotivated
by the desire todevelop qualitative insight into the transient ])heiiomena of the network. Accordingly, the following set ofquestionswill guideour discussion of the results:
•
To what
degreedo network
effectsalter the resultsobtained fromthestudyofasinglehub-?
•
What
are thenetwork
effectsproduced
by delayi^ropagationand under
what
circum-stancesdo
theybecome
important?
•
How
closelydo
thenetwork
a]>]iroximation resultsmatch
tiiose ofsimulation?Where
do
they differ?•
What
is theeffect ofcongestion atone
hub on
demand
and
congestion at the other?•
How
is this effect altered by theamount
ofslack in aircraftschedules?•
What
is the effect of isolating a congestedhub
by not allowing its flights toconnectwith the other
hub?
preservation of tlie
peaked
delay pattern, botli ofwhich
indicate that the effects inducedby
delay propagation (the "network effects") are relatively minor.Because
there isample
space
between
major banks
and
slack values are close tothemean
waitingtimes, the general ])eakedpattern ispreserved.The
resultsuggeststhatwhen
space between banksis adequateto ensure a
moderate
traffic intensityand
when
mean
waiting times are not substantially greater than aircraft slack,network
effects are outweighed by the "deterministic" congestioneffects resulting
from
tlie banked structure of arrivals at hubs.Behavior
Under
Heavier
Trafficand
Closer
Spacing
The
relativeweakness
of thenetwork
effect in the precedingexample
obscures differencesbetween
thenetwork
approximationsand
the simulation.A
more
revealing picture ispro-vided by case 2a (Figure 12).
Here
expected waiting times (30-40 minutes) are quite highrelative to aircraft slack (5 minutes),
and
there is only a 15-minutegap between
successivebanks.
While
the early part of theday shows
a close fitbetween
the simulationand
thealgorithms, there is a noticeable disparity in the
middle
part of the day,when
alterationsin the arrival stream
become
significant. Relative to simulation,both
algorithms tend tooverestimate delay during the
middle
]iartoftheday, with the differenceashigh as30%
forcertain periods. This
same
effect is jireseiit in case 1 to amuch
lesserdegree.For a given
hub and
algorithmwe
define a standard error in the predictionsrelative to simulation. Let A'/^ denote the waiting time value predictedby
algorithm for period kand
Yh denote the corresponding value for the simulation.Then
thestandarderror s isgivenby
This
]jrovides ameasure
ofhow
far ajiart the simulationand
algorithm results are. ForAlgorithm
1. these values are4.5and
2fiminutes
at thetwo
hubs, while the correspondingnumbers
forAlgorithm
2 are 4.oand
2.3The numbers
rei^resentan averageerrorof10-20%,with worse fits in the
middle
])artof the day.Case
3, inwhich
demand
is allowedto hecontinuousover theday
(no banks), alsoshows
adiscrepancybetween
the a])i)roximationsand
thesimulation during themiddle
partoftheday, as Figure 13 indicates.
The
traffic intensity for thiscase ishigherthan case 1 but lowerthan case 2.
The
differencebetween
the algorithmsand
simulation exceeds20%
for a largepart ofthe
day
athub
2,and
the standard errors are approximately15%
ofthe delays: 2.2minutes
athub
1 (for bothalgoritiinis)and
2.4and
2.6minutes
(Algorithm 1and Algorithm
2) at
hub
2.Thus
in all cases, thesimulation produces lower waiting time estimates duringthe
middle
part oftheday
than both of theapproximation
algorithms.We
next considerthe likely explanation for thediscrepancy.
The Network
Effect:Demand
Smoothing
Considerthe waitingtimeprofiles forcases 1
and
2a (Figures 11and
12). Evidently,waiting time jjrofiles aremuch
smoother
in the latter than in the former.With
only a 15-minutesejiaration
between
banks, tiie relativelyhigh waitingtimescombine
with low aircraftslack tooverwhelm
thebank
structure.Thus we
see thatwhen
traffic intensity is very highand
aircraft slack is low, theorder of the network's schedule breaks
down.
Further evidence ofthis effect isgiven in the to]) halfof Figure 14,
where
we
have plotted theoriginaldemand
profiles at
Hub
#1
together with thosewhich
areproduced
as a result ofdelayed arrivalsunder
scenario 2a.The
original schedule is labeled "slack=
500", corresponding to theartificial situation
where
aircraftslack is largeenough
toeliminate propagation completely.We
seeby comparison
with the situation "slack=
5" thatpropagated
delayssmooth
thedemand
pattern substantially, with largenumbers
of aircraft shifted to late periods.The
sharj)
peak
structure of the originaldemand
is considerably altered.This
smoothing
phenomenon
exi>laniswhy
Algorithms 1and
2 overestimatedelayscon-sistently in the
middle
part of theday
In the actual jirocess,an
aircraft scheduled at agiven jieriod
may
exjierience a delay ranging from zero ui> to 3 hours or more. In cases of high waiting times, the aircraft's next arrival time will be considerably later thanwas
scheduled,and
its contribution to laterdemand
is ])ushed backby
asignificantnumber
of]>eriods.
Thus
over a largenumber
ofsimulations withheavy
traffic, a noticeable fractionofarrivals are ])ushed back to the later ))arl of the day.
when
there isno
scheduled traffic.Because
cajiacity ismore
than a(le(|uatc liieii, the result of this traffic shift is to reduceoverall waiting times. Ideally, the <()iii|)uiatioiia! algorithmsshould reflectthisshifting
and
smoothing
ofdemand
However. ;us w;ls reiiKirke<l earlier, todo
athorough
job theywould
have to kee]i track of the
thousands
ofpotential ))alhs which aircraftmay
follow asa resultofdelay, a seemingly im]>ossii)le coiMimtaiional
burden
To
limit the state space toman-ageablesize, both algorithms u])tlatc ainraft srlirduli-s according to
one
number,
expected waiting time.The
result is that i)otli algorithms tend not to shift aircraft to the very latepart of the
day
sufficiently but ratlier toconcentratedemand
more
in tlie middle, resultingin hiffherpredicted waits.
The
Effectof
Demand
Smoothing on Waiting
Times
The phenomenon
ofdemand
shiftingand smoothing
explains certain observationswhich
seem
counter-intuitive at first.An
example
ofsuch a result is the fact that higher aircraftslackcan inc.remteexpected queuingtiviesat the hubs.
Cases
2aand 2b
illustratethis.Both
haveheavy
traffic organized into narrowly separated banks.The
difference is that in case2b. artificially high slack prevents the
network
effect ofdemand
smoothing,whereas
case 2aallows the
demand
tobecome
smoother
overtime asaircraft arepushed
back to theend
of the day. in the highslack case, thehigher concentrationofdemand
produces
higherqnemng
delays, as
we
see in thebottom
halfofFigure 14.Because
slack preserves the schedule, italso preserves the
peaked
pattern in that schedule,which
produces queues.Note
that incase
2b
there is a closer fitbetween
the algorithmsand
the simulation, because the highslack
means
that the schedulebecomes
essentially deterministic.Assessing the
Network
Approximations
The
results ofcases 1-3 suggest the circumstancesunder
whichnetwork
effectsbecome
im-portant,
and
theyalso indicate thatunder
thesecircumstances, thenetwork
approximations developed in thispaper
tend to overestimate waiting times during thebusy
period oftheday.
Case
1 suggests that for networksofair])orts likeDFW,
waiting timeson
average arejjrobably not high
enough
on. average tocreatesignificantnetwork
effects: the deterministic ]>art of theschedule (i.e. thebank
structure) j^redominates. However,as cases 2and
3illus-trate, the situation changas
when
trafficbecomes
heavierand
s])acingbetween
major banks
is decreased. This situation
may
only describe a few airi>orts at present in thiscountry(e.g.O'Hare), but it rejjresents a futurescenario
which
isquite possible, hi the cases of heavier traffic, lower slack,and
lesssejmration, the ])erformance ofthe algorithms worsens asthey tend not to capture the true sj^reading ofdemand
which is themajor network
effect.Slack,
Connectivity,
and
Hub
IsolationWe
consider next theeffect ofnetwork
coiinectimtyand
aircraft slackon
cumulative aircraftdelay.
We
distinguishbetween
tliis lattermeiisureand
that oftiie waiting timesatthe hubs.Tlie lattercorrespond tothe waitingtimes ofaircraft at thevarious stations in thenetwork, while the former is really the
sum
of such waiting times with aircraft slack subtracted.We
measure network
connectivity in tenns of the percentage of flights having operationsat both
hubs
in the network.Case
4 illustratestwo opposing extremes
of connectivity: afullydisconnected
network
(case 4a),where
eachhub
has itsown
set ofaircraft;and
a fullyconnected network
(case 4b),where
all flights alternatebetween
thetwo hubs
inbetween
visits to spokes.
Case
4amodels
the idea ofhub
isolation referred to earlier.Because
thenetwork
is com]>letely disconnected (p=
0), scheduledbank
times atone
hub
cannot
be disruptedby
late arrivals fromthe other. Incontrast, case
4b
ensures that aircraftencounteringdelays atone
hub
have themaximum
chance
todisrupt thescheduleatthesecond, sincethat is theirnextdestination after the intervenings))oke.
Case
4'sscenariothusallows us toexplore thenetwork
effectsoflow cajjacity at a single location.To
do
tliis, in both case 4aand
case4b
we
takethe initialstate ofthe firsthub
to be 1 (lowest capacity)and
thatofthesecondhub
to be3 (highest capacity).
The phenomenon
ofinterest is thepropagationofdelayscreatedat the first to the
banks
ofthe second.Our
results are sunnnarized in Figure 1.5,which
plots average cumulative delay perarnmng
aircraft.The
earlybanks
show
zero delay, while laterbanks
reflect delay carriedoverfrom ])reviouspoints in theitnierary.
The
figureindicates adegradationinperformance
at hui)
#
1 whe7i it is isolated, as well as tiie rorres)ionding benefits ofisolation athub
#2.
Conversely, the fully connected case benefitshub
#
1 at the exjjense of #2.Upon
furtherexamination, these resultsmake
intuitivesense. Clearlywe
expecthub
#2's
schedule tobecome more
reliablewhen
it isdisconnected from the disrui^tionsproduced by
#1.
But
we
also see thathub
#
Is
schedule i^erfonnance im])roveswhen
itmoves
in theopijosite direction
—
from disoomiected to fully connected.Examining
the situation athub
#1
more
closely,we
notice that the delays in the connected caseseem
to lag behind thedelays ni thedisconnected c;ise by about 2
banks
(2 hours) This isno
coincidence: in the connected case, the inininium timebetween any
aircraft'ssuccessive visitsto thesame
hub
is 4 iiours (4 banks), while in the disconnected case it is only 2.
Thus
the schedule delaysproduced
by the congestion athub
^
! are felt 2 hours later at thathub
in the connectedcase, jiroducing the 2-liour lag. However, this lagdoes not fullyex]>lain the difference in tlie
heights of the
two
curves in tlie toj) half ofFigure \^>. In the comiected case, late aircraftleaving
hub
#1
have the opportunity ofrecoveringsome
ofthe delay tlirough slack at theirnext stop (uncongested
hub
#2). This oi)portunityisnotavailablein thedisconnectedcase,since thenext stopis(congested)
hub
#
1, a factwhich
explainswhy
thecorresponding delayis higher even after
we
take accountof the lag.These
results have interesting implications fora strategy ofhub
isolation. In thecase of ahub
which isbelieved tobethesourceofalargeamount
ofcongestion,such astrategy willindeedprotect other
hubs
inthesystem from
the uncertaintiesand
disruptionsproduced
bythe
problem
hub.On
theother hand, disruption at thathub
itselfmay
worsen
sincemany
of its later arrivals will have
had
an earlier scheduled stop there already.Cases
5a, Hb, be,and bd
illustratetheeffectof slackon aircraftlateness.We
notedearlierthat higher slack preserves
demand
jieakingand
may
actually increasequeuing
delays at the hubs.On
tlie other hand, slack reduces each aircraft's cumulative delay. Figure 16illustrates that this second effect
predominates
in this relatively hght traffic. For varyingslack values, the figureplotsthe average cumulative delayper aircraftarriving at each
bank
of the day, not including
any
waiting at the current stop. Certainly the figure does not containany
surprises.We
include it in order toillustratethe kindofplanning forwhich
themodels
are well suited.Finally,
we
note tliat in a situation ofmajor
capacityshortfalls, airlinesdo
notpassivelyacce])t long delays
which
disrujjt the schedule. Instead, schedulersrespond
in "real time"by canceling
and
rerouting flights.The
jireceding discussion is intended to provide insight into the])henomena
of interestand
to the strategic issues that airlinesmust
plan for inconnection witli schedule disrujJtions
due
to congestion at their hubs.At
the tacticaland
oi>erational level, airline behavior is in actuality
more
dynamic.
5
Conclusion
In tins i)a])er
we
iiave develojiedtwo
related ai)]iroximation a])])roaches to the difficultl^robleni of
modeling
transient queiiiim behavior in a liul)-and-s))oke network.We
would
summarize
ourmajor
findings as follows:1. Iviporiance oftraffic fpltttivq plininmnimi. High uncertainty in levels ofdelay
en-countered by aircraft is a iiroiniiieiil feature of the network i^roblem. Unfortunately,
accuracy in keeping track ofaircraft
amid
this uncertainty is limitedby
highcompu-tational complexity.
2. Importance of deterministic effect.
The
peaked
pattern ofdemand
athub
aiirportsremains a strongly determining factor in predicting waiting times, particularly
when
major banks
areseparatedby ample
lengths of time.3. Delay
and
smoothing.On
theother hand, in caseswhere banks
are narrowly spaced, delay propagation exerts a strongsmoothing
effecton
thedemand
and
waiting timeprofiles.
4. Effects of
hub
isolation.A
policy of isolatingacongestion-pronehub
clearlydoes havethe effect of
improving
perfonnance
at others.On
the other hand,under
this policythe isolated
hub
produces
congestion delayswhich
disrupt itsown
future schedule.We
conclude withsome
remarks
about
runningtimes.As
we
reportedearlier, therunning times for Algorithms 1and
2 arehigii even forthesmall2-hub
test network: approximatelyone
hourforAlgorithm
1and
threehours forAlgorithm
2on
aDEC-3100
workstation.These
times are particularly
poor
considering that the running time for the simulationprogram
(5000 sami)les) is significantly shorteT—
about
10 minutes. In the absence ofimprove-ments
in the algorithms, this observation favors simulation. However, theimplementation
ofAlgorithms I
and
2 used in our tests is a rather inefficient one. Incorporating the earliersuggestion thattherecursionberestartedevery
m
jieriodsratherthanatevery periodwould
reduce running times by at least a factor ofA-
+
1~
in(h/m)+
IA
valuem
=
10 (2 1/2 hours), which is api>roxinialely theminimum
time a typical aircraftwould
havebetween
successive vi.sjtsto hub.s,would
reduce running times by afactorof 9(for A'=
80 periods). Thisimprovement
alonewould
iiring therunning
timesofthe algorithmsinto the
same
range as simulation.The
reduction is nni^ortant for the generalproblem
because thenumber
of simulations necessary cannot beknown
in advance.However,
atleast in this testcase, the smiulation jirocedures themselves, based on the
same
ideas of theoriginal
Markov
and semi-Markov
cajwcity models, offer a thirdapproach
tounderstandingnetwork
effects.Roth,
Emily.
1981.An
Investigation of the TransientBehavior ofStationaryQueuing
Systems.Ph.D.
dissertation. Operations Research Center, Massacusetts Institute ofTechnology,
Cambridge,
MA.
Whitt,
W.
1983.The
Queuing Network
Analyzer. BellSystem
TechnicalJoumaZ
62:9,2779-2815.
National Transportation Research Board.
1991.Winds
ofChange:
Domestic
Air Transport Since Deregulation. Transportation Research
Board
National Research Council SpecialReport
230.Washington, D.C.
Date
Due
MIT LIBRARIES DUPl