The Effect of Carburetor Refurbishing on
Emissions, Performance, and Fuel Economy in a Classic Pickup Tested Using Real-World Tests
by
Jacklyn Holmes
Submitted to the Department of Mechanical Engineering in Partial
Fulfillment of the Requirements for the Degree of
Bachelor of Science at the
Massachusetts Institute of Technology June 2010
© 2010 Jacklyn Holmes
All rights reserved
ARCHIVES
MASSACHUSETTS INSff lTE OF TECHNOLOGY
JUN 3 0 2010
LIBRARIES
The author hereby grants to MIT permission to reproduce and to
distribute publicly paper and electronic copies of this thesis document in whole or in part in any medium now known or hereafter created.
Signature of A uthor ...
epartmit of Mechanical Engineering May 8, 2010
Certified by...
JAn B. Heywood Sun Jae Professor of Mechanical Engineering Thesis Supervisor
Accepted by...
John H. Lienhard V o1ins Professor of Mechanical Engineering
THE EFFECT OF CARBURETOR REFURBISHING ON
EMISSIONS, PERFORMANCE, AND FUEL ECONOMY IN A CLASSIC
PICKUP
TESTED USING REAL-WORLD TESTS
byJacklyn Holmes
Submitted to the Department of Mechanical Engineering on May 7, 2010 in partial fulfillment of the requirements for the Degree of Bachelors of Science in
Mechanical Engineering
ABSTRACT
This project investigated how refurbishing the carburetor of a 1952 Chevrolet Pickup would affect emissions, performance, and fuel economy. The test used were real-world tests that anyone, with or without access to a laboratory, can perform. The design of the real-world tests is important for ascertaining good results. Thought should go into how to perform the tests safely while still eliminating as many variables as possible.
The emissions at idle improved by reducing the carbon monoxide percentage from 4-6% to
2-3%. The hydrocarbon levels were reduced from 800-1000 ppm to 500-600 ppm. The results of
the emissions test were unclear at cruise.
The performance data showed that the vehicle had a slower acceleration after the refurbishing. The time to go from stopped to 100 feet in first gear was 5.46 s before refurbishing, and 6.48 s after refurbishing. It is possible that the vehicle was running lean at wide-open throttle after refurbishing.
The fuel economy improved with the refurbished carburetor. The initial fuel economy was 10.7 mpg and the final fuel economy was 15.2 mpg.
Once the results from the tests are collected, they need to be scrutinized to see if they are plausible using empirical data.
Even with extreme care it is difficult to get precise measurements using real-world tests. The emissions data at cruise was not consistent with idle and could not be used. The fuel economy tests and emissions tests at idle show that the engine was running less fuel rich after refurbishing.
Thesis Supervisor: John B. Heywood
Author Biography
Jacklyn Holmes was born in 1988 to parents John Holmes Jr. and Julie Holmes. She was raised on a cattle ranch in the west-central mountains of Idaho. It was during her upbringing on the ranch that she became interested in machines and decided to major in Mechanical
Engineering. She graduated top of her high school class in 2006 before coming to MIT. She is expecting to get her Bachelors in Mechanical Engineering in June of 2010.
Acknowledgements
The author would like to thank Professor John B. Heywood for his guidance through this project. The author also thanks John Holmes Jr. for his assistance with running the tests and refurbishing the carburetor, and John at Tune Tech in Ontario Oregon for running the Emissions Testing. The author would also like to thank Ed Pollard for loaning the author a fan so she could continue with the tests.
Table of Content Title Page 1 Abstract 2 Author Biography 3 Acknowledgements 3 Table of Content 4 Introduction 5 Refurbishing 6 Safety 12
Tests & Results
Emissions 14 Performance 15 Fuel Economy 19 Discussion 21 Conclusions 27 References 28 Appendixes A-Engine Specifications 30 B-Carburetor Layout 32 C-Instruction Sheet 33
Introduction
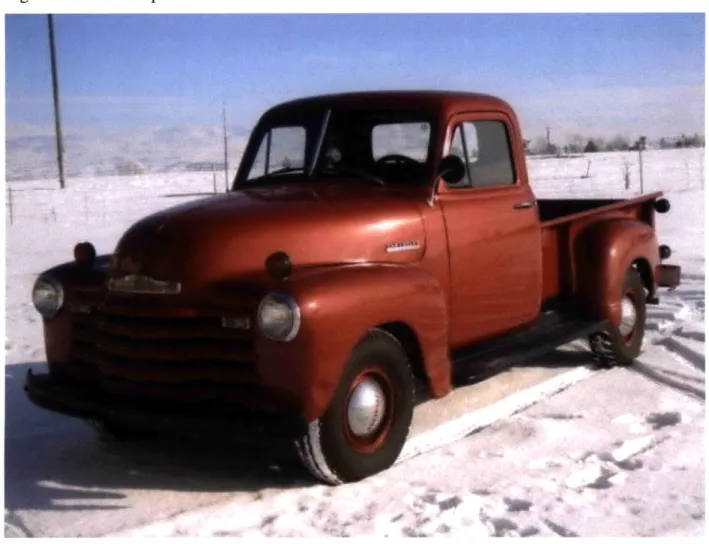
My car is a 1952 Chevy pickup. I chose to do this project to improve how my pickup
runs and preserve its quality. It would have been easy to refurbish the carburetor without running the tests, but I wanted to quantify the affect the refurbishing had on my vehicle. I wanted to use this experience to improve my problem solving skills by working on a full system in the "real world." The validity of real-world tests was also examined during the project to see
if good results were possible.
Figure 1: The 1952 Chevy Pickup used for the testing
Most individuals that have classic vehicles do not have access to sophisticated lab
equipment to test how their work is improving their vehicle. The real-world tests are used to get a general understanding of how things are working. They are run in the environment where the vehicle is being used, and with many uncontrollable variables.
Appendix A is information about the vehicle and engine from the Chevrolet Truck Shop
Manual: 1948 to 1953 Models. (1950). The pickup has the 216 cu. in. straight-6 engine.
The 216 engine has the model B downdraft carburetor. The carburetor is used to control the fuel flow into the engine. It is also used to mix the fuel with air to obtain proper combustion. The air flows through a venturi, which is a converging-diverging nozzle. The pressure difference caused by the air flowing through the nozzle is used to control the appropriate fuel flow rate into the engine (Heywood, 1988, p. 282). Appendix B is from the Chevrolet Truck Shop Manual:
1948 to 1953 Models. (1950), and it shows the components of the model B downdraft carburetor.
Refurbishing
The refurbishing of the carburetor involved removing the carburetor, cleaning surfaces, and replacing certain components that were included in a refurbishing kit. The following is a list of components that were replaced:
e Power valve spring and ball e Pump plunger
" Pump discharge-guide, spring, and ball
e Bowl cover gasket
" Body flange gasket " Float and lever assembly
e Needle, seat, and gasket assembly
Appendix C a portion of the Instruction Sheet: Rochester Carburetor - Models -"B",
-"BC, - "BV" (1982) from the carburetor refurbishing kit. The Instruction sheet shows an
exploded view of all of the components of the carburetor, and all of the adjustments done during the refurbishing process. The Operator's Manual: For 1952 Chevrolet Light Medium and Heavy
Duty Trucks and Chevrolet Truck Shop Manual: 1948 to 1953 Models were referenced if any
questions arose during the refurbishing process.
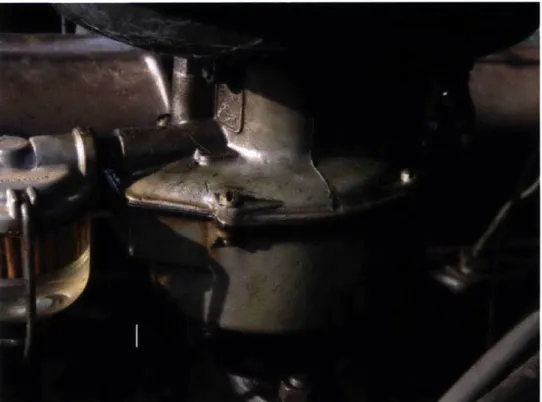
Figure 2: Carburetor installed on the engine before refurbishing. The outer surface had a shine that could have been caused by fuel leakage.
Figure 3: Carburetor installed on the engine after refurbishing.
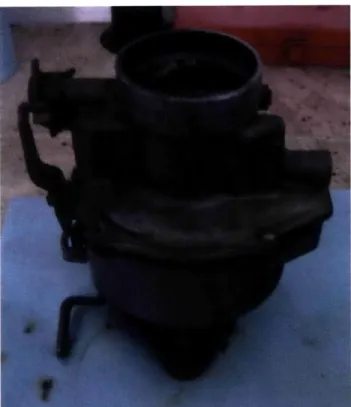
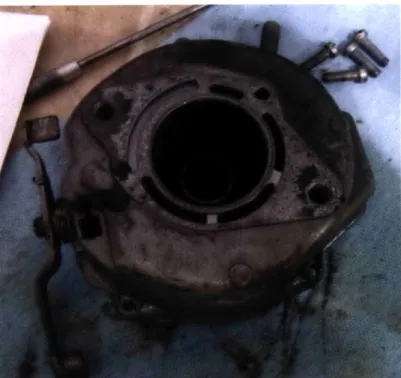
Figure 4: Carburetor removed from the engine before refurbishing. There is noticeable buildup on the surfaces of the carburetor.
Figure 5: Carburetor after refurbishing.
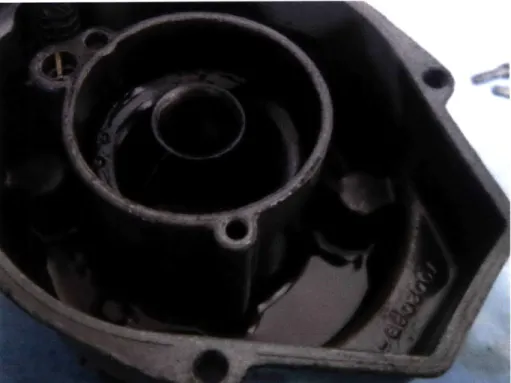
Figure 6: Carburetor bowl before refurbishing. Notice sediment left in the bottom after fuel was poured out.
Figure 7: Carburetor bowl with sediment removed.
Figure 8: Bottom of carburetor before refurbishing. Notice gasket had stuck to the surface.
Figure 9: Bottom of carburetor after refurbishing. Old gasket removed, and surface cleaned.
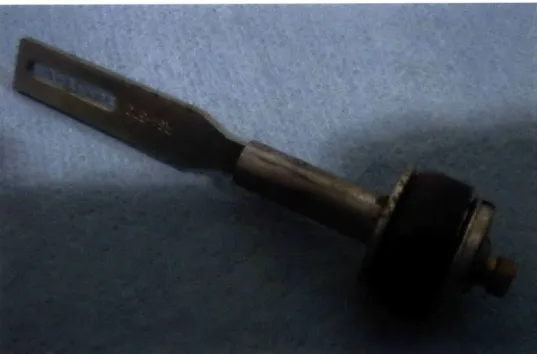
Figure 10: Old pump plunger with signs of wear.
Figure 11: New pump plunger.
... ... ... ... .. .. .... .. .. ... - - -... . .. .... .... ...
-Figure 12: Exploded view of old power valve assembly. Notice spring tailure.
The carburetor was found to have been put together using Teflon tape on the threads. This was difficult to remove, and possibly could have sent particles of the tape through the carburetor which would then end up in the engine.
Safety
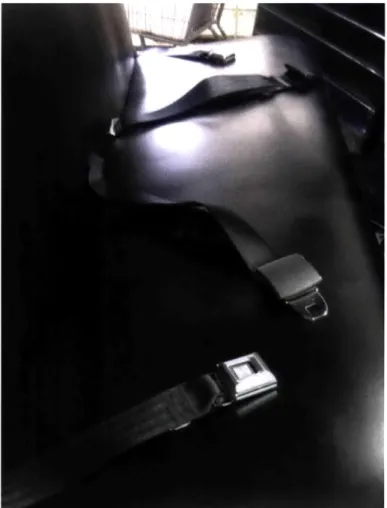
Safety is critical for every experiment. The classic pickup presented additional safety concerns such as the lack of seat belts and turn signals. These vehicles were not designed to operate at the speeds that new cars travel on interstate roads. Therefore, the choice of roads was critical.
I installed seatbelts for the driver and passenger. And the flasher was replaced to fix the
turn signals that a previous owner had installed.
... ... ... .. ... .... ... ... ... .... ... .. .... .. . ...
Figure 13: Seatbelts installed.
Figure 14: New flasher used to fix the turn signals.
.. .. .. .. .. .... ... : ... . .... ... .OW ... ... - - - - - v . ... .... ...
ff
Other safety measures involved doing the testing on rural roads where the speeds were lower and there was very little traffic. All of the roads were paved and dry. The tests were performed in good weather when there was no snow or rain.
The engine, excluding the carburetor, was in a fair condition prior to any testing. All engine fluid levels and tire pressures were checked and maintained in the proper range.
Tests & Results
For this project, three types of tests were used to evaluate how the carburetor refurbishing affected the pickup. The three tests quantified emissions, fuel economy, and performance. The results were then examined to see if they agreed with other experimental results obtained in a more controlled environment.
Emissions
The first test was is the emission test. This test is more of a "lab test" than any of the others. A trained technician, John, at Tune Tech in Ontario Oregon, performed it. The
equipment measured the amount of hydrocarbons and carbon monoxide in the emissions. This test did a very good job of eliminating variables from outside sources, but the equipment could only measure up to 10% on the carbon monoxide.
This test shows what the emissions are for the vehicle at idle and at cruise. Hydrocarbon
(H-C) and carbon monoxide (CO) were measured and analyzed. Hydrocarbon emissions occur
when there is incomplete fuel combustion. Hydrocarbon is measured in parts per million (ppm) but the measurement is dependent on what gas was used to calibrate the instrument. The instrument used for this test was calibrated using Hexane (contains six carbons per molecule). The reading is inversely proportional to the number of carbons in the calibration gas. For example, a C1 reading could say 1800 ppm , the C3 reading gives 600 ppm, and the C6 reading gives 300 ppm. Carbon monoxide occurs when the emissions do not form the proper compounds during combustion. It is measured as a percentage of the emissions.
Before the test could be run, the vehicle needed to be warmed up. This was accomplished
by the drive from Weiser to Ontario (approximately 15 miles). The following table contains the
Table 1
Emissions test results
Idle Cruise
Before After Before After
H-C (ppm) 800-1000 500-600 1200 1200
CO 4-6% 2-3% Off Scale Off Scale
RPM -1000 -750
Performance
This test was used to see how the vehicle responded by accelerating from a stopped position. Accelerating quickly to meet the flow of traffic can be important factor while driving
because driving slowly impedes the flow of traffic.
The performance test was done on a straight stretch of paved road with excellent
visibility. 100 feet of road was marked off to be the test path. In order to perform this test safely, my father drove the vehicle while I timed the runs. We kept our roles the same throughout the testing to insure that we didn't add an additional variable.
Steps were taken to eliminate as many variables as possible. The tests were performed with a set distance of 100 feet. The test was run at wide-open throttle (floored the gas pedal).
All of the tests were performed in first gear. This eliminated shifting as a variable. The roads
were dry. The vehicle had been sufficiently warmed up before the testing occurred. Finally, the same people performed the driver and timer rolls.
However, not all variables could be eliminated. It is possible that human error could have come from the person driving, my father, and the person timing, the author. During the first set of tests, a breakdown occurred that possibly could have made us more cautious for the testing after the carburetor work. The results from the testing are listed below.
Table 2
Average time & standard deviation including all of the runs
Average Time Standard
(s) Deviation (s) Before 5.27 0.49
Table 3
Times for each run of the
Test Time (s) Before-1 5.3 Before-2 5.6 Before-3 4.3 Before-4 5.5 Before-5 5.3 Before-6 5.6 After-1 6.9 After-2 6.5 After-3 6.2 After-4 6.6 After-5 6.5 After-6 6.2 performance test.
After the data was collected, the Before-3 test seemed to be unreasonable. Removing this data point gives a new average and standard deviation shown in the following table along with the coefficient of variation, and acceleration. Acceleration was calculated making a
simplification that it was constant during the test. The acceleration calculated will be referred to as an average acceleration.
Table 4
Average time, standard deviation, coefficient of variation, performance tests without the outlying data point.
Average Time (S) Standard Deviation Coefficient of Variation
and average acceleration for the
Average Acceleration (m/s2)
Before 5.46 0.15 0.0278 2.05
After 6.48 0.26 0.0407 1.45
The change in acceleration may not seem like a lot, but using the acceleration to estimate an approximate 0-60 miles per hour (mph) time more clearly shows the difference. Initially the pickup was showing a 0-60 mph time of 13.1 s. After the refurbishing the 0-60 mph time was
18.5 s. That is an increase of 5.4 s from before to after the refurbishing. These 0-60 mph times
are only to show how much of a difference there is in the results. The vehicle does not easily go to 60 mph.
This test was designed to show how the vehicle responded to the driver accelerating from a stopped position. There were some difficulties with the test that could explain the behavior that was seen.
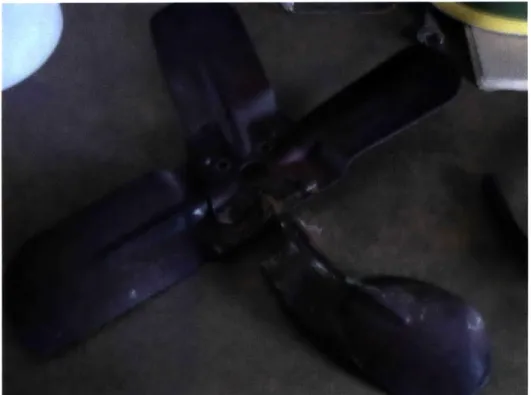
This test proved to be very difficult. While running the "before tests" the fan broke and severed the fan belt. The heating coil then was leaking an excessive amount. This occurred on the seventh run of the initial testing, and caused the engine to heat up. The broken fan was discovered to be from a 1955 model engine. It was replaced with the correct 1952 version from
Ed Pollard. The heating coil was bypassed for the "after tests."
On the following page are pictures of the fan that broke during testing and the fan that was used in the tests after refurbishing.
Figure 15: 1955 model fan that broke during testing.
Figure 16: 1952 model fan obtained from Ed Pollard .
Fuel Economy
Recently with the spike in the price of gasoline, fuel economy has become very important. Car owners often perform this test in order to know how their vehicle is running. Those tests are performed in "every day" driving, and the results can vary a great deal from what is tested in a laboratory.
For this project, the most accurate result possible was desired without access to a laboratory. Much thought went into the selection of the road, and how to eliminate as many variables as possible. The test conditions used to eliminate variables are:
- Same driver - Same passenger m Same road - Same fuel pump
m Good weather conditions
- Vehicle warmed up prior to testing
- Tire Pressure checked and adjusted to meet specifications - Fluid Levels checked and kept in the correct range
It is impossible to eliminate all variables in real world testing. The variables that remained for the tests run are listed below.
- The refurbished carburetor (The variable desired) - Other drivers- slowing the test down
- Fuel pump variation (at the gas station) - Time (49 minutes to 54 minutes) - Weather (Temperature & Humidity)
- Different fan- from Ed Pollard. (used the fan that was supposed to be on this 216 engine, the first tests had a fan from a 1955 model)
- No Heating coil in the after tests - Running hotter during after tests
The results of the fuel economy test were surprising. There seemed to be a significant increase in the miles-per-gallon after the refurbishing of the carburetor. Calculating the average fuel economy was done by using the total miles driven during the set of tests divided by the total
distance driven in that set of tests. During the before tests the vehicle ran about 10.7 miles per gallon. The after tests showed about 15.2 mpg. This translates to a reduction of fuel
consumption of 30 percent.
Table 5
Data
from
all test runs. Shows the time variation and whatfuelpmp
sued.Test
Pump
Time (min) MPG
Miles traveled Gallons used
Fuel Economy
*Before TestsEAfter Tests 18 17~ - - - -- - --16 -15 14 13 12 11 10 9 8 0 1 2 3 4 5 6 Tests
Figure 17: Graphical representation of the MPGs calculated for each test run. This shows the variation in the tests runs.
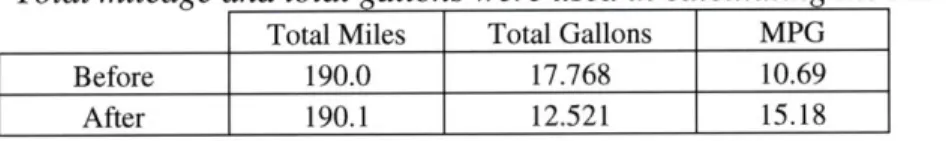
Table 6
Total mileage and total gallons were used in calculating the MPG.
Before 31.7 2.831 11.20 52 3 BI Before 31.6 3.098 10.20 51 3 B2 Before 31.7 2.85 11.12 51 3 B3 Before 31.7 2.32 13.66 50 4 B4 Before 31.6 3.192 9.90 51 4 B5 Before 31.7 3.477 9.12 49 4 B6 After 31.7 1.881 16.85 54 3 Al After 31.7 2.308 13.74 52 3 A2 After 31.7 1.857 17.07 54 3 A3 After 31.7 2.071 15.31 51 3 A4 After 31.6 2.064 15.31 50 3 A5 After 31.7 2.34 13.55 49 3 A6
Total Miles Total Gallons MPG
Before 190.0 17.768 10.69
After 190.1 12.521 15.18
Discussion
These emissions results give a great deal of information. The vehicle improved at idle. Unfortunately it is impossible to tell the effect the refurbishing had at cruise. The revolutions per minute of the engine at idle was reduced by 250 by refurbishing the carburetor and adjusting the settings. It is unclear why the H-C values were so large and stayed the same at cruise.
The acceleration results show that the vehicle was slower after the carburetor work. This result can possibly come from running the engine much leaner. It is possible that after the
carburetor work was performed the engine was running lean of stoichiometric for wide-open throttle. The result may also be skewed by the cautiousness of the driver and timer during the tests after the carburetor was refurbished.
With the fuel economy results, a substantial improvement was measured. The tests show that there is significant variation with real-world testing, and multiple tests are needed to attempt to average out some random errors. The unexpected changed to the engine operation could have also had an affect on the fuel economy tests.
The smaller replacement fan and removing the heating coil in the cab caused the engine to run warmer during the after tests. The engine was running about 15 degrees warmer. This would heat the oil making it less viscous which would reduce the friction in the engine. The smaller fan would also cause less friction when it is running. The older engine will have higher friction than new engines by about 30-50 %. Figure 18, shows how friction mep (kPa) changes with varying oil temperatures. During the before tests the vehicle was running about 68 C and after was about 76 C, this corresponds to a mechanical friction reduction of about 8% from Figure 18. Multiplying 8% by 1.4 (in order to scale to an older engine) gives a reduction of mechanical friction of 11%. The reduced friction helped improve fuel economy.
--- TW Mecdhical Rcip nogas I -Redpgas -200.0 180.0 10.0 140.0 120.0 *~100.0 0.0 40.0 20.0 20 30 40 50 60 70 80 90 100 15W40 i TuMprature (C)
Figure 18: Friction mep (kPa) for varying oil temperatures. This is Figure 11 in An
Improved Friction Modelfor Spark-Ignition Engines Sandoval and Heywood (2003).
This real-world tests were designed to be run easily, but difficulties were still faced. These difficulties came from uncontrollable variables. Even though the road was rural and lightly trafficked, there were a few runs that had a slow vehicle increase the time for a fuel economy test. The weather was also a huge factor as to when the tests could be run. All of the testing dates were in good weather with dry roads. The fan breaking during the initial
performance test made it impractical to run more tests before refurbishing the carburetor. It was also discovered that the gas station had been having problems with the pumps being accurate. It is impossible to determine whether these difficulties affected the results for this set of tests because of the limited time and resources.
The results obtained can give insight into the system and how the vehicle is performing. Starting with the CO emissions data at idle an air fuel ratio can be estimated using Figure 17.
Table 7
The relative air/fuel ratio found given the carbon monoxide % using Figure 18.
Idle Before Refurbishing Idle After Refurbishing
CO 4-6% 2-3%
X (from Figure 17) 0.86 0.93
-7~ 43 as T6~ 6 7 A/F 9g 5 *10 0
0.7
0.8
0.9
1.0
1.1
1.2
Reatne air/fel ratio A
Figure 19: Graph used to take a CO percentage and find the corresponding relative air/fuel ratio (X). This is Figure 11.20 (b) in John B. Heywood's book Internal Combustion Engine
Fundamentals (1988, p. 592).
Now that we have a relative air/fuel ratio, an air/fuel ratio (A/F) can be found by using the following equation:
- = A* 14.6(
F
The relative air/fuel ratio (X) is multiplied by 14.6 because 14.6 is the air/fuel ratio when an engine is running stoichiometric (stoichiometric is when there is
just
enough ai and fuel during the combustion for the fuel to be fully oxidized to CO2 and H20.)Table 8
Air fuel ratios found using equation
Now that we have an A/F ratio, Figure 19 can be used to find the break specific heat consumption (bsHC). However, the vehicle was running on the rich side of the graph, so the curve was extended out to give an estimate for the bsHC.
5.0L V8 HC Emissions v& A/F Ratio
1500 RPM 2.62 BAR BMEP, Ignition Thing 30 Degrees
A/F Ratio
B-Oaww
Figure 20: BSHC vs A/F Ratio. Note. Graph from Effects of A/F, EGR, and Spark on HC from John B. Heywood's course 2.61 at MIT (2009).
The bsHC estimated with Figure 19 came out to be: Table 9 Estimates for bsHC bsHC (g/kW-h) Before Refurbishing 7.3 After Refurbishing 5.4
All of this analysis gives us a lot of information about how the engine behaves at idle, but
what is happening at cruise is also important. Because the CO readings at cruise were off-scale,
this same analysis can be used in reverse along with the H-C reading to estimate what the CO reading could have been.
From Table 1 the average H-C at idle (including before and after) was 725 ppm. At cruise the H-C was 1200 ppm. The ratio of cruise to idle was 1.66. Using the average bsHC at idle of 6.4 g/kW-h and the ratio of 1.66, a bsHC at cruise of 10.6 g/kW-h is found. Following the analysis in reverse gives the following values at cruise:
Table 10
Values for cruise using analysis.
Cruise H-C (ppm) 1200 bshc (g/kW-h) 6.4 A/F 11.6 0.79 CO 7.5%
Using this kind of analysis, a CO percentage of 7.5 was obtained. This is too low, because the measured value was off the scale (>10%).
Another approach was used to try to make sense of the results using plausible numbers for how fuel rich the vehicle was running. The first assumption was with the refurbished carburetor the engine was operating at 10% fuel rich. This gives a fuel to air ratio (<) of 1.1. Older vehicles were designed to run slightly fuel rich. Using the following figure, the indicated specific fuel consumption (isfc) should be about 253 g/kW-h.
3900 38 *800- 36 700-a1 orr e A2 30- 30 20 Casner 28 26D ilk26 240-0.6 0.8 1.0 1.2 1.4 Padir M raO
Figure 21: This is Figure 15.4 in John B. Heywood's book Internal Combustion Engine
Fundamentals (1988, p 831). Use this graph to find the indicated specific fuel
consumption (isfc) from a given fuel/air ratio ($).
To determine what the isfc we would have seen before the refurbishing process, we used a ratio of the fuel economy. The "after" mpg was divided by the "before" mpg to get a mpg ratio of
1.42. The mpg ratio multiplied by the "after" isfc to give the "before" isfc. The isfc we expect before the refurbishing should be around 360 g/kW-h by estimating using figure 20. This isfc translates to a $ of 1.4-1.5. This is very rich, but could be valid. The air/fuel ratio (1/$) is approximately 0.7. Using figure 18, that gives CO estimation of 10.4% which would be off the scale. At 10% fuel rich the CO should have dropped to 3.5% after the refurbishing. This was not what was seen in the test.
. .... ...
Conclusions
Many interesting conclusions can be drawn from these tests and analysis. When measuring fuel economy or fuel consumption, even with extreme care, it can be difficult to get precise measurements using real-world tests. The before fuel economy tests varied by 4.6 mpg, and the after tests varied by 3.5 mpg.
The emission data for cruise are not constant with the before tests being more fuel rich than after. The cruise condition was not well defined because we don't know how much the rpm was increased for the cruise test or how that would affect the results. Using the emissions data at idle to scale the results to cruise shows that the CO percentage should have been 7.5%. Using the change in fuel economy and isfc predicted a drop of CO to 3.5%. The measured cruise emissions data cannot be used because it is inconsistent that the after condition of the engine would be running that extremely fuel rich.
From the fuel economy tests showing an increase of about 40% in the average mpg, the engine must be running significantly "less rich" after rebuilding. Plausible numbers that would explain this were developed in the discussion. The increase in temperatures of 15 C from the changes made after the breakdown decreased the mechanical friction by 11%. The carburetor refurbishing was not the only change that would affect fuel economy.
The emissions data show that at idle the engine was running richer during the before test than the after test. The engine wasn't running absurdly richer before. But the relationship at cruise between A/F, k, < do not scale as they did at idle. Values like A/F = 11.6, 2 = 0.79, and
References
Chevrolet Truck Shop Manual: 1948 to 1953 Models. (1950). USA. General Motors Corporation.
Heywood, J. B. (2009). Effects of A/F, EGR, and Spark on HC. Course: MIT 2.61 notes. Cambridge, MA.
Heywood, J. B. (1988). Internal Combustion Engine Fundamentals. New York, NY: McGraw-Hill.
Instruction Sheet: Rochester Carburetor - Models -"B", -"BC", -"By". (1982). USA.
Operator's Manual: For 1952 Chevrolet Light, Medium and Heavy Duty Trucks. (n.d.). USA.
General Motors Corporation.
Sandoval, D., & Heywood, J. B. (2003, March 3). An Improved Friction Model for Spark-Ignition Engines. SAE Technical Paper Series, 2003-01-0725, 10.
Appendixes
A- Engine Specifications
B- Carburetor Layout
Appendix A ENGW4 ASEMBY 6-4 ENGINE SPECIFICATIONS Type Valve-in-Head Number of Cylinders... .. 6 Piston Dlsplacement-216 Enn...218.5 u. in. 235 ... .285.5 en in. Bore-216 Eng ne...8 235 Egn...aS Stroke-216 Engine...8%Y' 285 Engine...89{ Compression Ratio-216 Engine...6.6:1 235 Engine. ... 6.7:1 Horsepower (S.AR)-216 Egine...29.4 285 Engine...0.4 Firing Order...1-5--6-2-4 Cylinder Block Bore Size-216 En...4995'-8.5015' 285 En ... 8.5620'.5640' Cranirshat Number of Bearinp...4 Bearing Journal
Diameter-Front ... .... 2.6885'-2.6845' Front-Intermediate...2.7145'-2155' Rear-Intermediate...2.7455'-2.7465'
Rear. ... 21765'-23775"
Thrust Taken...Rpar
Inter-End Clearane...00'- 009' Connecting Rod Journal
Diamete...2.1'.12
Jou Out-fRound...001' Ma.
Ruot-At Intemediate
Journal...002' Mar.
Crankehaft ManBaig
Bearing Clearanee...Selective Fit Underase Bearings
Available... 002'-.010-Connecting
Rod-Centr to Center Length....
.o...n
Loer...Cast bit
Bearing Bore ... 2818 -2.4W
BtiiClearance .v i
Clearance Rod to Crankpin checked at uppergalf of
bearing ... 004'-.012
Clearance Rod to Piston
Pi Bors ... 025' Minimum
Pisten-Diameter Clearance at
Skirt-Pass on...0015' Feeler Hold on-...008' Feel& Oversize Pistons Available.. .005'-.010'--020'-Piston
Pin-Diameter...865 0 Oversize.'. ... 008'-.005'-.010'
Piston Pin Fit...Thumb Push Fit
Compresion1mug-Q a tity.. ...2 : 21- Engine...Both Taper-Face (1948-49) 285 Eine.Both T Oer-Face 1950-51) 235 Engme.Upper, wit Lower Tape-Face Width: Taper-Face ... 128-1240' Twist-Type...098'-.0985' Ga ...00 O5'-0 5 RM and Groove Cearance...0015'-.008' Oil Ring-Quan.Ity...1 .. e...Wide-Blot .... h...1860'-.1865' Gap ... 005'-.015' E' -and Groovev enc= .e. ... 002-.0085'
Ring Gap Spacing...120*
cean1.ma-Number of Bearings.4..4
Bearing Journal Diameter
Front...2.02'. -2.0892' F -Inte .... 1.657*1.96t7' Rear-Intermediate..1.9082'-1.9042' Rear .. ... 1.84 ?-8417' Runout at Intermediate Bearing... . ... 002fM.
Thrust Taken...By Thrstplate Cams-aft-End Cleaan.. ..001- to .005' Camshaft Bearings Type...SteelBacked Babbitt Tned Front...2.0807'46017' Front--Intermediate.L96821.9692' Rear-Itermediate. .1.905"-1.067' Rear... ... ~. .8482'-1.8449' Bearing Clearance...002'-.0044 Camshaft End Plug
Assemble in Crankcase ... .Flush to W Deep Istake
Valve-
Lash-Hot-Normal Operation... -.008
Heavy Duty Operation. 010'
Seat Angle...80
Diameter-Head 218 nne...
(1949) 235 Engine .... (1950-51) 285 Engin...1
ENGINE ASSEMBLY 6-46 -Length-Overal-216 Engine...6-6.90 (1948-49) 28 ngine .. 6.260'-.290' (1950-51) 285 Engine.6.864-6.894' Diameter-Stem...10'-.8417' Guide Ream ... 8427'-.87'
Stem-to Guide Clearance...001-008'
Intake...1* A..D.C.
lntake .89* A.LD.C.W... Iatake Period.... ... 218
Width of Seat (in head). Exhaust
Valve-
.Lash-Hot-Normal Operation...018'-.015'
Heavy Duty .020'
Seat Angle: (1 Engines. .80
Diameter-Head: (1948-49) Engines . ... % Length-O : (1948-49) Engines...4.889'-4.869" (1950-51) Engines'...4.902'-4.982' Diameter-Stem...8400'-8407' Guide Ream ... 8427'-.8487'
Stem to Guide Clearance...002' tA .004'
Exhaust pe ... 42* B.LD.C.
Ekhaust Closes ... 9* AU.D.C.
Exhaust Period...2810
Width of Seat (in head).... .'M
Valve
Guide-Exterid Above
Head-2 IV ... , (1805) 23 nie. Intake 1' Eaust 5;"i Valve Utiir-Diameter ... 989
Clearane Block to Lifter... .. Selective Fit
1a e ..-... :.2%' Lbs. Pressure at 1' ... 1.2-140 lbs.
Vafve
Roeter-Rocker Shaft Diameter...7910'-.7917' Rocker Arm Bore... .. 7922'-.798'
Sfning Gears- Baekleh--6 Engine (Bakelite). , ,008'-.005' 286 Engin (Aluminum). .004'6' Crnkanaft Gear-Material. ... Steel Teeth... .27 Runout... 00' Camshaft Gear-Material: 216 Engine...Bakelite and Fabric with Steel Hub (1948-50) 285 Engine...Aluminum with Steel Hub (1951) 285 Engine... Aluminum Teeth... .. ... 54 Runout... 004"
Oi-Pump-Type and Dri ve. ... Dre by Taug on Distiibuto Lbs. Pressure at 2000 RPM..14 1hs. Spark Plugs-Make, M odeyie 948)... .AC, 104,.10"Tm. 14 mm. Gap: (I ) ngine ...040'
Front Engine Mounng-Support Clearance .4.../-(
Distributor-Point
Gap-Readjust...
Adjust New Points .. .02
Point Spring Tension ... 17-21 Ounm
Idlig Speed ... 450-500 RPM
Vacuum Reading at Iding
Speed- ... 17-21 i nT h
Fan Belt Adjustment-Deflection Midway Between
Pulleys... ... %
.Clutch Housing Pilot
Hale-Runout...008' Max, Runout...008N Ma.
TORQUE WRENCH SPECIFCATIONS
ENGINE BOLTS AND NUTS Cylinder Head Bolts...70-80 ft.lbs.
Valve Rocker Shbft Support
Bolts and Stud Nuts. ... 25-80 ft lbs. Ma*ifold Center Clam Bo1t..15-20 1.bs.
Manfold End Clamp ... 2580ft. The.
Co Robd Nuts
(with threads)...40-0 ft T.
Main Bearing Cap Bolts
(with .e -heas -:... -t -f-1 & ba-Crankena Front EdPlate
Screws ... 15-20 ft.
Ib.-Timing Gear cover Serws...643 ftL Ibs
Clutch Houing Attahing ft. The.
F1whee1 Moun Bolt ... 0654 Ibs.
Oil Pan CornIer Bolts...12 ft. lbs. Clutch cover to Fywheel Balts.' ft b.
Push Rod Cover Screws... 6-7 ft. lb.
Oil Distributor Co Sei...67 :ft. Ilbs.
Water Pump Attsufh Bolts... ft. Ibs.
Fuel.Pump Attnwh -.. 1-20 L Ibs.
Spark Plugs: (1948) ' ... 12-15 ft.
(1949-51) .20-25 ft. Tb.
Note. Appendix A is pages 6-47 and 6-48 from Chevrolet Truck Shop Manual: 1948 to 1953
Appendix B
ENGINE ASSEMRLY 6-63
Fig. 83-Carbwreatr-u.aet
1. Screw-Cover Attaching 12.
2. Air Horn 13.
3. Fuel Inlet Fitting 14.
4. Gasket-Air Horn 15.
5. Float 16.
6. Float Needle, Seat, Gasket 17.
Assy. LB.
7. Power Spring 19.
8. Float Hinge Pin 20.
9. Power Piston 21.
10. Main Well Support 22.
11. Power Valve Assembly 23.
Main Metering Jet Screw-Attaching Retainer-Pump Screen
Pump Screen
Float Bowl
Gasket-Throttle Body Throttle Body Assembly
Idle Adjusting Needle
Spring-Idle Needle Screw-Throtte Body Choke Valve Choke Shaft Screw-Choke Valve Screw-Choke Laver Retainer-Choke Lk~er Choke Lever Screw-Bracket Nut-Bracket Spring-Choke Shaft Choke Bracket Guide--Pump Discharge Spring-Pump Discharge Ball-Pump Discharge-3/16 Steel
Pump Plunger Assy.
Spring-Pump Return Bail-ump Check-5/32 Aluminum Screw-Throttle Kicker Washer-Throttle Kick Throttle Kicker Spring--Throttle Kicker Screw-Throttle Valve Throttle Shaft
Note. Appendix B is Figure 83 (p. 6-63) from the Chevrolet Truck Shop Manual: 1948 to 1953
S
-o
IMP
Y0
--41b tM Cj.~ ~ .'CD 3 NjBIi
4JI7aj~P~4VPJ?I
pill,
I
1 I: IgrtItIII
ell
1
Ih
W
Big
1:1
b.
'Ho
j
!!
111
00
I
0I
eseo All*g
! I,~,,
1-l
1qI
1i
]M I MW IL WT *PJD
W CAR AD.FSUMM.
COKz -NJOM ADUSWNT
Fig. 7
1961-63 FCTIAC 19N4ST 4 CYL. WI M CSATIC 20OS0ISSIO0
rig, 10
Note. Appendix C contains select pages from Instruction Sheet: Rochester Carburetor - Models
-"B", -"BC", -"BV". (1982). USA.