Osteoporos Int (2006) 17: 616–626 DOI 10.1007/s00198-005-0025-6
O R I G I N A L A RT I C L E
Age-related changes in trabecular bone microstructures:
global and local morphometry
M. Stauber . R. Müller
Received: 6 April 2005 / Accepted: 29 September 2005 / Published online: 31 December 2005
# International Osteoporosis Foundation and National Osteoporosis Foundation 2005 Abstract Introduction: A recently developed method allows
investigating trabecular bone on an elemental (rod/plate) level. With this method, it is possible to measure local morphometric parameters such as thickness or orientation directly on the extracted rods and plates. Age-related changes of trabecular microarchitecture can thus be inves-tigated on an elemental level, which may help to improve the understanding of age-related bone failure mechanism as well as the effect of pharmaceutical intervention in the prevention of such fractures. Methods: Autopsies from femoral heads (FH) and lumbar spine (LS) were analyzed by global morphometry. Additionally, the trabecular struc-tures were decomposed into rods and plates for the analysis with local morphometry. These morphometric indices were related to age using an analysis of covariance to test for gender differences and linearity with age. Results: In this study, age-related changes showed no gender but site differences. In LS, rods were thinned in aging and finally vanish from the structure, causing a transformation of the trabecular bone structure to longer and, on average, thicker rods. In FH, changes were expressed by a simultaneous thinning and loss of interconnecting trabeculae and perfo-ration of plates leading to new plates and rods. Results were mostly in agreement with earlier findings using descriptive analysis of the aging process. Conclusion: Here we pres-ent for the first time preliminary quantitative evidence of changes in the local microstructure, i.e., individual rods and plates. Nevertheless, the number of samples was too small to make for ready conclusions. We conclude that the com-bination of local and global morphometry is a useful method for a detailed and quantitative description of age-related changes in bone microstructure.
Keywords Age-related changes . Local morphometry . Osteoporosis . Trabecular bone . Trabecular plates . Trabecular rods
Introduction
The definition of osteoporosis changed over the years with increasing knowledge of this disease. Where earlier, os-teoporosis was defined as an absolute decrease in the
amount of bone [1–3] to a level below that required for
mechanical support [4], later definitions added the
im-portance of microarchitecture [5,6] and bone quality [7], a
term referring to architecture, turnover, damage accumula-tion, and mineralization. With the changed definition of osteoporosis, the focus of investigation also changed over the years. Most early studies in age-related bone changes concentrated in the description of the amount of bone
volume [1–3,8–17], and only few investigated structural
parameters such as bone surface density (BS/TV) [11,14,
15], trabecular number (Tb.N) [14, 18], trabecular
thick-ness (Tb.Th) [12, 14], or trabecular spacing (Tb.Sp) [12].
This was based on the intuitive idea that the mechanical properties of trabecular bone depend strongly on its
apparent density or bone volume [19,20], and it became
an indisputable fact that bone is lost in aging people. However, Hui et al. demonstrated that even for constant
bone mass, fracture risk increases with age [21]. Thus,
bone quality changes with age, independent of bone mass, and components such as microarchitecture, turnover, damage accumulation, and mineralization must be taken into account in determining bone strength.
Parfitt et al. were first to highlight the evidence of tra-becular bone microstructure in the etiology of osteoporosis
and bone fractures [22]. With their newly introduced
paral-lel-plate model, they investigated architectural changes with age, such as spacing and thickness of trabecular plate structures, and found that the reduction in bone volume was mainly due to a reduction in plate density, with no
sig-nificant decrease in plate thickness [22,23]. The authors
proposed that the process of plate removal was initiated by
M. Stauber . R. Müller (*) Institute for Biomedical Engineering, Swiss Federal Institute of Technology (ETH) and University of Zürich,
Moussonstrasse 18, 8044 Zürich, Switzerland e-mail: [email protected] Tel.: +41-44-6324592 Fax: +41-44-6321214
an excessive depth of osteoclastic resorption cavities, lead-ing to focal perforation of plates followed by progressive enlargement of the perforation with conversion of plates to rods. It was also proposed that a potential thinning of residual elements could arise from incomplete refilling by osteoblasts of resorption cavities of normal or reduced size
[24]. This theory stimulated research in trabecular bone
structure related to aging, and different methods were used to investigate the thickness and spacing of trabecular
ele-ments [25–30].
With the improvement in spatial resolution of three-dimensional imaging systems such as microcomputed
to-mography (μCT) [31], peripheral quantitative-computed
tomography (pQCT) [32,33], and magnetic resonance
im-aging (MRI) [34–36], it became possible to assess
tra-becular bone microstructure in three-dimensional space. This pushed the research field toward the assessment of new, unbiased, three-dimensional (3-D) quantities such as the model-independent assessment of mean Tb.Th and
mean trabecular separation (spacing) (Tb.Sp) [37],
struc-ture model index (SMI) [38], mean curvature of trabecular
bone structure (<H>) [39], or connectivity density (Conn.
D) [40]. All these parameters were also related to changes
with age and diseases [41–43].
Recently, we proposed a new method for the local mor-phometric analysis of single trabecular rod and plate
ele-ments [44–46]. This new method allows computing
morphometric parameters, such as volume, surface, thick-ness, and orientation, directly on a trabecular level (i.e., individual rods and plates) and it is possible, for the first time, to verify in 3-D space whether the thickness of hori-zontal and vertical rods are age dependent. Local mor-phometry also opens the doors to the investigation of new parameters, such as the slenderness of rods, which is im-portant in determining whether buckling is a potential fail-ure mode. To complete the pictfail-ure in age-related changes of trabecular bone, we also included global morphometric parameters such as bone volume density (BV/TV) and Tb. Sp, which are better measured by means of global than local methods. The overall aim of this study was to achieve a better understanding of age-related changes of trabecular bone microstructure.
Methods
In this study, we analyzed human trabecular bone samples that were measured earlier as part of the European Union
BIOMED I Concerted Action“Assessment of Bone
Quali-ty in Osteoporosis” [47, 48]. The analyzed data set
en-compasses 131 samples harvested from 70 donors at two different anatomical sites; femoral head (FH) and second lumbar spine (LS). These two sites were shown to have similar lifetime risk for fracture, which was about three
times higher in women than in men [49,50]. Bone samples
were recruited from subjects in the postmortem room in standardized conditions from subjects of all ages and dif-ferent pathological conditions. The main causes of death were heart failure, pneumonia, stroke, and sepsis. The
samples were extracted along their site-specific loading axis. Detailed clinical donor characteristics included in this
BIOMED I project have been described elsewhere [51,52].
No donors were excluded due to known skeletal diseases, metabolic diseases, or drugs known to affect the skeleton. In that sense, the study population was not considered a normal population with respect to their bone status but a typical cross-section of the hospital population at the time of the study. The numbers of samples and mean ages per
site and gender are shown in Table1.
All samples were scanned using a microcomputed
to-mography (μCT) system (μCT 20, Scanco Medical AG,
Switzerland) providing a spatial resolution of 28μm. This
system and scanning procedure is described elsewhere in
detail [31], and the data set has previously been used for
several investigations [46,47,53]. A 4-mm cubic region of
interest (TV) was selected from all samples. Using Gaussian
filtration and global thresholding [47], binary images were
created presenting either bone or background. A com-ponent-labeling algorithm was applied to the binary images to remove all parts not connected to the main structure.
These images were then used for both global and local morphometry. For global morphometry, standard 3-D algorithms were used to compute bone volume density (BV/TV), bone surface density (BS/TV), and specific bone surface (BS/BV), as well as Tb.Sp, Tb.N, and Tb.Th. These
algorithms are described in detail elsewhere [37, 47].
Furthermore, we also computed the <H> [39] also denoted
to as trabecular bone pattern factor (TBPf) [54], and the SMI
[38]. All these parameters were computed in 3-D space
without using any model assumptions and are summarized
in Fig.2and Table2.
For local morphometry, the component-labeled images were first spatially decomposed into rods and plates. A detailed description of the volumetric spatial decomposi-tion algorithm as well as local morphometry can be found
elsewhere [46] where here only a short description of the
main procedures is provided. First, the component-labeled images were skeletonized using a 3-D homotopic,
isotro-pic, and shape-preserving thinning algorithm [55, 56],
yielding in a two-voxel thick, symmetric skeleton. Subse-quently, a topology-preserving algorithm called conditional erosion was used to reduce this skeleton to 1 voxel
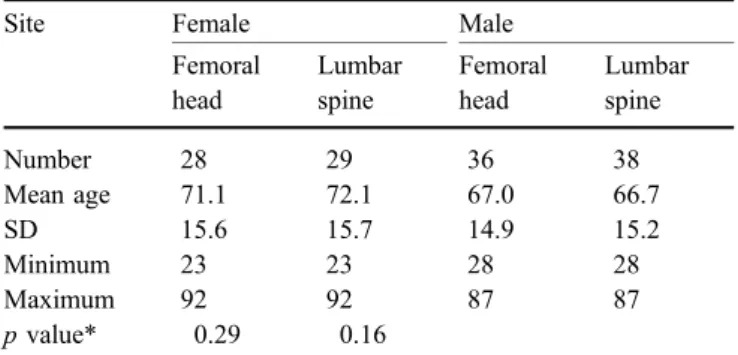
thick-Table 1 Number and age ranges of the trabecular bone samples per gender and site
Site Female Male
Femoral head Lumbar spine Femoral head Lumbar spine Number 28 29 36 38 Mean age 71.1 72.1 67.0 66.7 SD 15.6 15.7 14.9 15.2 Minimum 23 23 28 28 Maximum 92 92 87 87 p value* 0.29 0.16
ness [46]. These skeletons are a very rough, 1-voxel-thick representation of the original bone structure where rods with elliptic cross-section may be represented as slender plates. To overcome this problem, we applied an optimiza-tion algorithm to the skeleton to get a reasonable repre-sentation of rods and plates and to reduce surface noise. The slenderness parameter used for this optimization step was set to 10, which was visually yielding in reasonable
results [46]. The optimized skeleton was then characterized
by a slightly modified point-classification algorithm
origi-nally devised by Saha et al. [57], which was able to compute
for each voxel within the skeleton whether it was a surface point, a surface end point, an arc point, an arc end point, an
arc–arc intersection point, an arc–surface intersection point,
a surface–surface intersection point, or an isolated point.
This classified skeleton was spatially decomposed into rods and plates, which were expanded to their original size by
applying a so called multicolor dilation algorithm [46]. This
operation resulted in a spatially decomposed trabecular bone structure where all rods and plates were labeled with
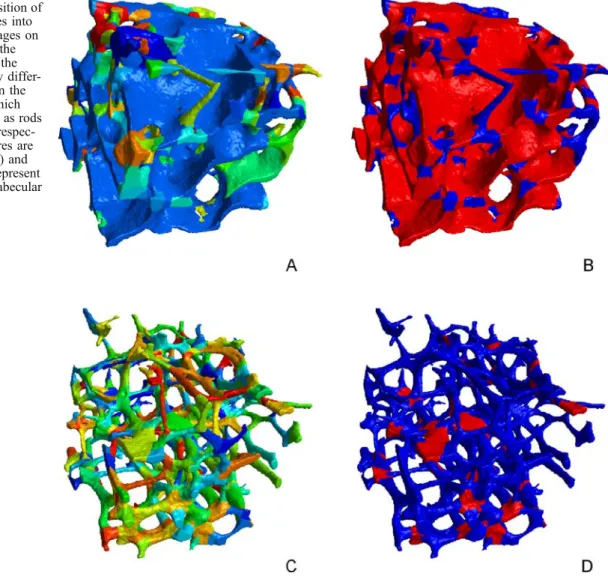
an individual number (Fig.1a,c).
Local morphometry was then used to compute
element-based indices [46]. These indices were computed and
averaged for rods and plates separately (Fig. 1b,d). The
length of the rods (<Ro.Le>) was determined directly from the point-classified skeleton by computing the distance of the two nodes. This operation was applied only to rods since the orientation of plates is not clearly defined. The
orientation of the rods (<Ro.θ>) was defined as the angle
spanned by the line connecting the two nodes and the Z–
axis of the image. Since all samples were extracted along
their site-specific loading axis, the Z–axis was collinear
with the loading axis, and thus, the orientation represents the orientation as compared with the loading axis. We used
this angle to group vertical elements (θ<=45°) and
hori-zontal elements (θ>45°). All other parameters such as the
thickness or volume of the elements were determined by applying standard morphometry algorithms to the rods and plates. In this paper, we denote <Ro.Th> and <Pl.Th> to be the mean thickness of all rods and plates, respectively, in a structure. The mean thickness of all vertical and horizontal
rods are denoted to as <RoV.Th> and <RoH.Th>,
respec-tively. The mean slenderness of the rods, as computed from the length over the thickness, is denoted to <Ro.Sl>. Furthermore, we computed the plate volume density (Pl.BV/BV), which is defined as total plate volume divided by total volume of interest in percent. This parameter was shown to represent structure type similar to the globally determined SMI but in a more direct, unambiguous way
[46].
For the statistical analysis, the GNU statistical computation
and graphics package R (Version 2.0.1;http://www.r-project.
org) was used. We conducted an analysis of covariance to
determine whether the morphometric indices had a linear trend with age and to find differences between women and men. For the indices that showed an age-related linear trend, we used the linear model to express these changes. The linear regression was expressed by arbitrarily setting the value at 30 years (young adult) to 100%, which allowed us to express the increase/decrease of a certain parameter in percentage per decade relative to this age. With this, the regression line is clearly defined, and the 100% level, which was arbitrarily chosen at the age of 30, could easily be moved to any other age. This analysis of covariance was performed site wise, and the resulting p values are shown in
Tables 2 and 3 for global and local morphometry,
re-spectively. The data was visualized by scatter plots, and
LOWESS fits [58, 59] were used to highlight trends
(Figs. 2, 3 and4). The same statistical analysis was
per-formed for all samples of donors aged 59 years and older.
Results
Generally, we can say that for all morphometric indices, the variation between subjects in any given site was large as compared with age-related changes. For this reason, it was difficult to formulate general laws, and for most param-eters, it was not so clear whether the relation with age was linear. Nevertheless, the data gives important indications and trends in bone changes with increasing age. The levels and trends of most morphometric indices were different for the three sites.
The analysis of covariance revealed no differences
be-tween female and male bone samples (Tables 2 and 3).
Therefore, male and female data was pooled for further
analysis and displayed in the same scatter plots (Figs.2,3,
and4).
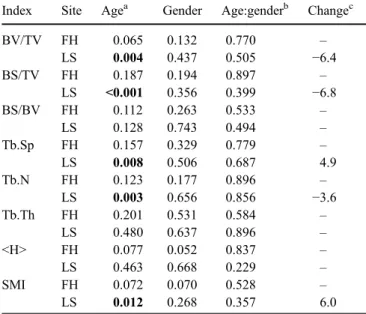
Table 2 P values of the analysis of covariance for the global morphometric indices
Index Site Agea Gender Age:genderb Changec
BV/TV FH 0.065 0.132 0.770 – LS 0.004 0.437 0.505 −6.4 BS/TV FH 0.187 0.194 0.897 – LS <0.001 0.356 0.399 −6.8 BS/BV FH 0.112 0.263 0.533 – LS 0.128 0.743 0.494 – Tb.Sp FH 0.157 0.329 0.779 – LS 0.008 0.506 0.687 4.9 Tb.N FH 0.123 0.177 0.896 – LS 0.003 0.656 0.856 −3.6 Tb.Th FH 0.201 0.531 0.584 – LS 0.480 0.637 0.896 – <H> FH 0.077 0.052 0.837 – LS 0.463 0.668 0.229 – SMI FH 0.072 0.070 0.528 – LS 0.012 0.268 0.357 6.0
BV/TV bone volume density, BS/TV bone surface density, BS/BV specific bone surface, Tb.Sp trabecular separation, Tb.N trabecular number, Tb.Th trabecular thickness, <H> mean curvature of trabecular bone structure, SMI structure model index, FH femoral head, LS lumbar spine
a
Bold numbers are smaller than 0.05 b
Interaction term age:gender c
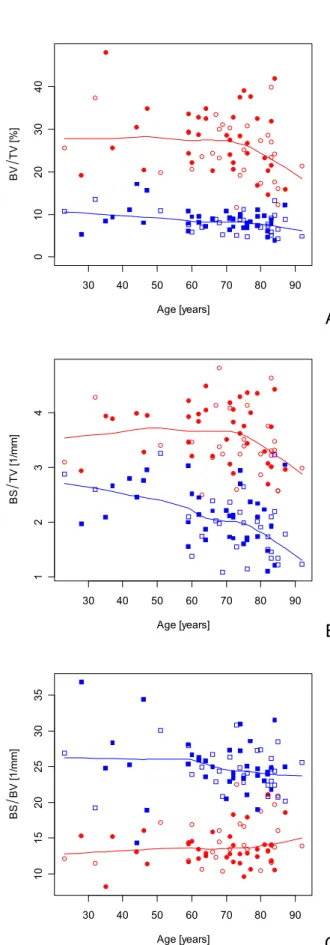
From global morphometry, we found an age-related decrease in BV/TV, which showed a linear relation in LS that was found to be 6.4% per decade. However, the var-iation was large at all ages. The sites differed in BV/TV, being high for FH and low for LS. A similar pattern was found for BS/TV, where a linear relation with age was found in LS. This parameter seemed to decrease more dramatically at higher ages (>70 years) similarly for both sites. BS/BV, on the other hand, showed no age-related changes for any of the sites. This parameter was large in LS and low in FH, which can be explained by the different sizes of the structure elements. There was a general in-crease in Tb.Sp, which showed a linear relation with age in LS. Again, the increase was more pronounced after the age of about 70 years. In LS, spacing was found to be increased by 4.9% per decade. Spacing was large in LS and small in FH. Accordingly, Tb.N decreased with age and was large in FH and small in LS. This parameter also showed a linear relation to age in LS. No significant change with age was found for the globally determined Tb.Th and <H>. The SMI increased slightly in LS only. These results are
sum-marized in Fig.2and Table2.
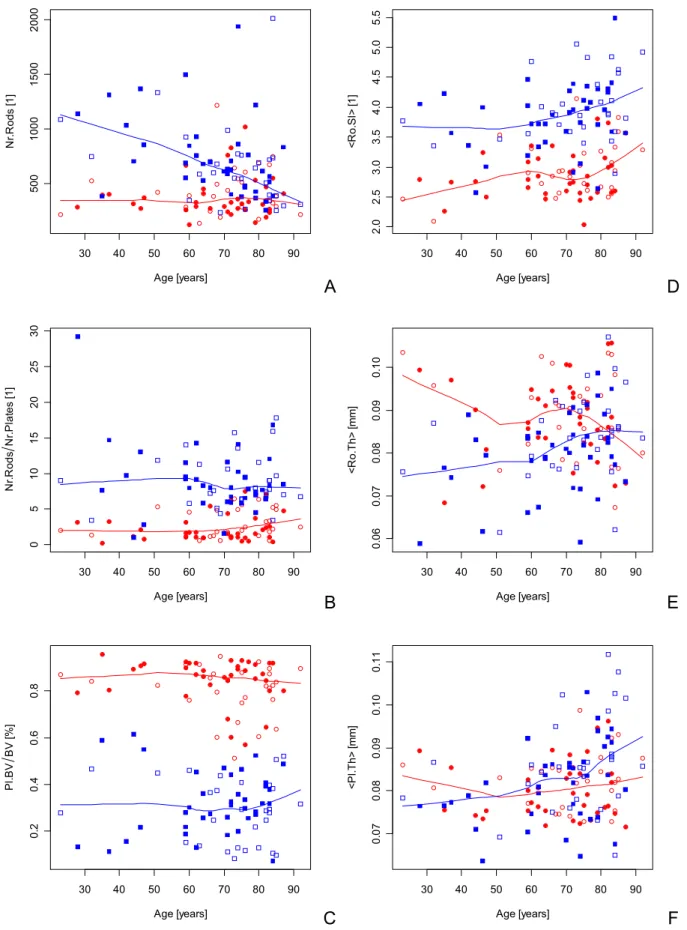
From local morphometry, we found an age-related de-crease in the number of rods in LS. On average, a 90-year-old person would have a 50% reduced number in rods as compared with a 30-year-old subject. The other site showed no obvious trend in this parameter. The ratio of the number of rods to the number of plates as well as Pl.BV/BV showed no age-related trend, and the levels in Pl.BV/BV were quite different for the two sites. The <Ro.Sl> increased with age and showed a linear relation in FH and LS. The <Ro.Th> and <Pl.Th> showed a trend only in LS, where an age-related increase was observed. The increase was
observed in both <RoV.Th> and <RoH.Th> elements.
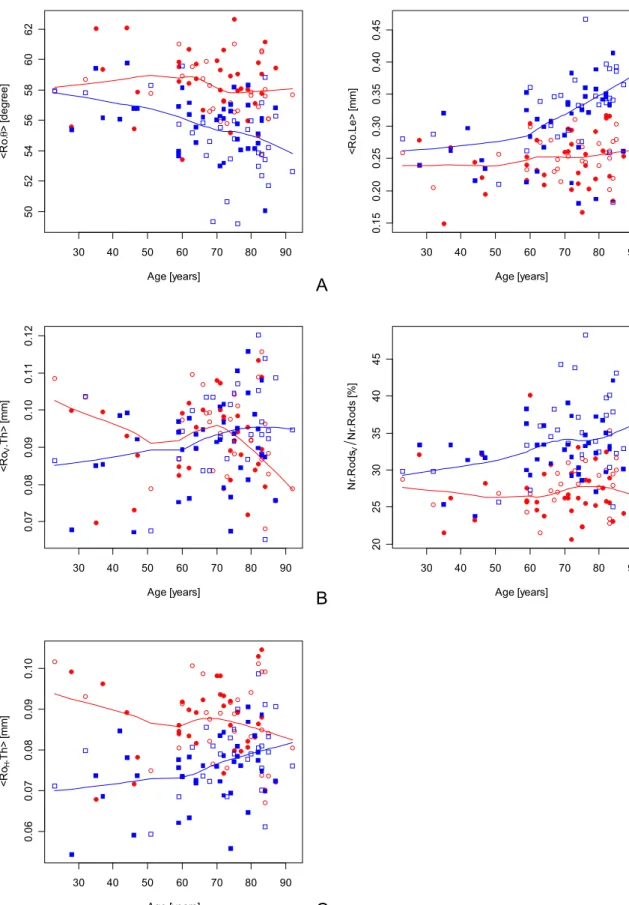
With increasing age, rods tended to be oriented along the
anatomical axis (Z–axis), which is reflected in LS by a
linear increase of the percentage of vertical rods (Nr.
RodsV/Nr.Rods). These results are summarized in Figs.3
and 4 and Table 3. By performing the same statistical
analysis including only the samples aged 59 years and older, all p-values became insignificant. The variation at these ages was obviously too large and the observed time interval too short to reveal significant linear trends over time.
Fig. 1 Spatial decomposition of trabecular bone structures into rods and plates. The images on the left-hand side show the extracted elements after the spatial decomposition by differ-ent colors, the images on the right-hand side show which elements were identified as rods (blue) and plates (red), respec-tively. The three structures are from femoral head (a, b) and lumbar spine (c, d) to represent a platelike and rodlike trabecular bone structure
A
E
F
B
C
30 40 50 60 70 80 90 0 1 02 03 04 0 Age [years] BV TV [ % ] 30 40 50 60 70 80 90 1234 Age [years] BS T V [1 /mm ] 30 40 50 60 70 80 90 10 15 20 25 30 35 Age [years] BS BV [ 1 /m m ] 30 40 50 60 70 80 90 0. 4 0 .6 0. 8 1 .0 1. 2 1 .4 Age [years] Tb .S p [ m m ] 30 40 50 60 70 80 90 1. 0 1 .5 2. 0 2 .5 Age [years] T b .N [1 /mm ] 30 40 50 60 70 80 90 0. 10 0. 15 0. 20 0. 25 Age [years] T b .T h [m m ]D
Fig. 2 Scatter plots with LOWESS fits for the global morphometric indices. The measured indices are bone volume density (BV/TV), bone surface density (BS/TV), specific bone surface (BS/BV), trabecular spacing (Tb.Sp), trabecular number (Tb.N), and
trabec-ular thickness (Tb.Th). Open symbols denote female, and closed symbols denote male, where data from femoral head are displayed as circles (○,●) and data from lumbar spine as squares (□,
▪
)A
E
F
B
C
30 40 50 60 70 80 90 500 1000 1500 2000 Age [years] N r. R ods [ 1 ] 30 40 50 60 70 80 90 0 5 10 15 20 25 30 Age [years] N r. R ods N r.P la te s [1 ] 30 40 50 60 70 80 90 0. 2 0 .4 0. 6 0 .8 Age [years] Pl .B V BV [ % ] 30 40 50 60 70 80 90 2. 0 2 .5 3. 0 3 .5 4. 0 4 .5 5. 0 5 .5 Age [years] <R o .S l> [1 ] 30 40 50 60 70 80 90 0. 06 0. 07 0. 08 0. 09 0. 10 Age [years] <R o .T h > [ mm] 30 40 50 60 70 80 90 0. 07 0. 08 0. 09 0. 10 0. 11 Age [years] <P l. T h > [ m m]D
Fig. 3 Scatter plots with LOWESS fits for the local morphometric indices. The measured indices are the number of rods (Nr.Rods), the ratio of the number of rods to the number of plates (Nr.Rods/Nr. Plates), the plate volume density (Pl.BV/BV), mean rod slenderness
(<Ro.Sl>), mean rod thickness (<Ro.Th>), and mean plate thickness (<Pl.Th>). Open symbols denote female, and closed symbols denote male, where data from femoral head are displayed as circles (○,●) and data from lumbar spine as squares (□,
▪
)A
B
E
C
30 40 50 60 70 80 90 50 52 54 56 58 60 62 Age [years] <R o . θ > [ degr ee] 30 40 50 60 70 80 90 0. 07 0. 08 0. 09 0. 10 0. 11 0. 12 Age [years] <R oV .T h > [m m] 30 40 50 60 70 80 90 0. 06 0. 07 0. 08 0. 09 0. 10 Age [years] <R oH .T h > [m m] 30 40 50 60 70 80 90 0. 15 0. 20 0. 25 0. 30 0. 35 0. 40 0. 45 Age [years] < R o. Le> [ m m ] 30 40 50 60 70 80 90 20 25 30 35 40 45 Age [years] N r. R ods V N r. R ods [ % ]D
Fig. 4 Scatter plots with LOWESS fits for the local morphometric indices. The measured indices are the mean orientation of rods (<Ro.θ>), the ratio of the number of vertical rods to the number of rods (Nr.RodsV/Nr.Rods), the mean thickness of vertical rods (<RoV.Th>)
and the mean thickness of horizontal rods (<RoH.Th>). Open symbols
denote female, and closed symbols denote male, where data from femoral head are displayed as circles (○,●) and data from lumbar spine as squares (□,
▪
)Discussion
This is the first study on age-related changes of 3-D local morphometric indices on human cancellous bone. Only recently a new method for the volumetric spatial decom-position of trabecular bone structures was proposed, en-abling local morphometry as applied on individual rods and
plates [44–46]. Here we related these new indices to age,
separately for men and women, in two different sites (FH and LS). These sites were chosen since they represent platelike and rodlike bone structures. Additionally, to draw a picture of age-related bone changes, we also computed 3-D global morphometric indices. Age-related changes of 3-D global morphometric parameters have already been
investigated for tibial cancellous bone [42,60]. However,
we found no study in which global morphometry derived from micro-CT data was related to age in FH and LS. The aim of this study was to achieve a better understanding of age-related bone changes in the trabecular bone structure. A separate analysis of bone samples from donors aged 59 years and older showed similar trends in all
morpho-metric indices as the analysis of the whole data set. How-ever, due to the large variation at these ages, none of the linear regressions were any longer significant. This could indicate that age-related changes are very individual at a given age but tend to be similar if compared over the whole lifetime. For this reason, in this study, only age-related changes over the whole lifetime were considered. The first and most accepted age-related change in trabecular bone structure is bone loss as expressed in a decrease of calcified bone tissue. It is well accepted that such bone loss is an important factor leading to enhanced bone fragility and fracture risk in the elderly. Such bone loss has been demonstrated in many studies for different anatomical sites
[1–3,8–13, 16, 17, 26, 42,61,62]. The results from our
study are in line with these findings, and we could dem-onstrate a linear relationship with age in LS. According to our data, a 90-year-old person showed a decrease in BV/ TV of 38% in LS as compared with a 30-year-old subject. In FH, we found no age-related changes although the
LOWESS fit in Fig. 2a tends to decrease at higher ages
(>70 years). It is a general finding of this study that age-related changes are more clearly expressed in LS than in FH in all morphometric parameters. It is, of course, im-portant to note that such age-related changes can only
apply to an “average” population. Typical for
cross-sec-tional studies, subject variation is too large to make state-ments about individual time courses.
Similar to BV/TV, BS/TV in LS also decreased with age
(6.8% per decade) in a linear fashion (Table2). This is not
surprising since larger volumes also have larger surfaces, assuming a constant structure shape. The decrease was
es-pecially pronounced after the age of 70 (Fig.2b). Opposed
to this, the BS/BV, a measure for the relative amount of bone surface per bone volume, remained constant
through-out life in both sites (Fig.2c, Table2), a result supported
by earlier findings from quantitative histology [15].
Tb.Sp, Tb.N, and Tb.Th were investigated intensively with many different approaches. Concerning Tb.Sp, there is little controversy, and to our knowledge, all published
results indicate an age-related increase [12,22,23,25–27,
29,30], which is in line with our findings (Fig.2d, Table2).
Opposed to Tb.Sp, Tb.Th is of higher controversy and has thoroughly been investigated by means of two-dimensional (2-D) and 3-D methods. In some studies, it was found that the mean Tb.Th decreased significantly with age either in all
trabeculae [28–30] or in horizontal trabeculae only [25,27]
whereas in other studies, no significant decrease could be
observed [12, 22]. Other studies even speculated that
vertical elements that are subjected to compression could increase in thickness as a compensatory response to loss of
horizontal trabeculae [24,63].
In our study, we approached the thickness of the trabeculae on a 3-D global as well as on a 3-D true local level. Globally, we found no age-related changes in the Tb.
Th (Fig.2f, Table2). On a local basis, we investigated the
thickness separately for plates and rods, which both showed an increase at higher ages in LS. This increase was found in
both vertical and horizontal elements (Fig.4b,c, Table3).
There are two interpretations to this result: first, trabeculae
Table 3 P values of the analysis of covariance for the local morphometric indices
Index Site Agea Gender Age:genderb Changec
Nr.Rods FH 0.469 0.356 0.952 – LS 0.002 0.626 0.788 −7.9 Nr.Rods/ Nr.Plates FH 0.093 0.174 0.916 – LS 0.235 0.786 0.072 – Pl.BV/BV FH 0.155 0.104 0.991 – LS 0.775 0.318 0.379 – <Ro.Sl> FH 0.019 0.445 0.455 4.2 LS 0.019 0.336 0.987 2.7 <Ro.Le> FH 0.151 0.464 0.719 – LS <0.001 0.122 0.973 5.7 <Ro.Th> FH 0.384 0.562 0.199 – LS 0.003 0.147 0.894 2.6 <Pl.Th> FH 0.539 0.170 0.940 – LS 0.006 0.166 0.960 2.6 <Ro.θ> FH 0.314 0.254 0.571 – LS 0.001 0.096 0.371 –1.2 Nr.RodsV/Nr.Rods FH 0.731 0.559 0.363 – LS 0.004 0.054 0.393 4.2 <RoV.Th> FH 0.444 0.285 0.133 – LS 0.031 0.246 0.786 1.8 <RoH.Th> FH 0.391 0.087 0.336 – LS 0.005 0.121 0.927 2.5
Pl.BV/BV plate volume density, <Ro.Le> mean rod length, <Ro.θ> mean rod orientation, <Ro.Th> mean thickness of all rods, <Pl.Th> mean thickness of all plates, Nr.RodsV/Nr.Rods ratio of number of vertical rods to number of rods, <Rov.Th> mean thickness of all vertical rods, <RoH.Th> mean thickness of all horizontal rods, <Ro.Sl> mean slenderness of rods, FH femoral head, LS lumbar spine
a
Bold numbers are smaller than 0.05 b
Interaction term age:gender c
become thicker; second, smaller trabeculae vanish. Since we also found in our study that the number of rods decreases with age, we speculate that the second interpre-tation is more realistic and that at higher ages, trabeculae first become thinner and finally vanish from the structure. Increased Tb.Sp implies a decrease in Tb.N, which was found in earlier studies where shortening or complete loss
of trabeculae was documented [18,28]. In another study, it
was found that the Tb.N decreased significantly with age
for both horizontal and vertical trabeculae [27]. In our
study, we could demonstrate a loss of trabeculae with global and local morphometry. From global morphometry, we found a general loss of Tb.N in LS. From local mor-phometry, we found a decrease in the number of rods (Nr.Rods) in LS only whereas FH showed no age-related changes. For the LS, this change is very obvious. The structures from this site are already in young people extremely rodlike and thus, if some elements are lost with age, the number of rods decreases as well. In FH, on the other hand, the number of elements is more difficult to interpret. In aging, bones plates eventually get perforated, which results in new, smaller plates and later in new rods. Thus, in FH, the number of elements increases due to plate perforation at the same time as some other elements vanish due to the aging process. Although bone remodeling mech-anisms on a cellular level are most likely the same at both sites, they are expressed differently in the remodeling of the structure due to the different initial structure types. This
result is corroborated by a recent simulation study [64]
where it was demonstrated that the relative amount of bone loss in any given structure was highly and directly corre-lated to the BS/BV, a measure for the structure shape.
It was suggested in different studies that buckling is an
important failure mode [65–70]. The relative importance of
this failure mode clearly increases with increasing slender-ness of trabeculae. In our study, we found an increase in the <Ro.Sl>, which was linear in LS and FH. This result is caused by a large increase in <Ro.Le>, which was espe-cially pronounced in LS.
In our study, we could demonstrate that local morpho-metry used in combination with global morphomorpho-metry may help to improve the understanding of age-related changes in trabecular bone microstructure. However, this study is lim-ited due to the cross-sectional nature and the limlim-ited number of samples per age group, resulting in a huge variation in morphometric parameters at any age. In cross-sectional studies, generally, thousands of samples are needed to demonstrate highly significant regressions, wherefore this study only may be considered as an illustration of the potential utility of the technique, highlighting some signif-icant and interesting trends. The high variation in the data may also be part of the reason why no gender differences could be detected although it is generally accepted that osteoporotic fractures occur with a much higher incidence
in women than in men [49,50]. However, previous studies
investigating trabecular bone also reported almost no
gender differences on a microstructural level [26,42], and
it was suggested that not only a greater age-related decrease in volumetric bone mineral density in trabecular and
cor-tical bone but also other factors, such as a smaller bone size in women compared with men may explain, in a large part, why fragility fractures are more common in elderly women
than in elderly men [62].
We would like to summarize our findings as follows: (1) Age related changes are best seen in LS. The reason for this is the extremely rodlike structure type, which is expressed by a high BS/BV that is sensitive to both hormonal and environmental changes. In aging people, thin rods are further thinned and finally vanish from the structure, which causes a transformation of the trabecular bone structure to longer and, on average, thicker rods. Due to loss of inter-connecting rods, the remaining trabeculae are more likely to buckle, increasing the potential for catastrophic failure. (2) Due to the high variation in almost all morphometric indices at all ages, it seems difficult to predict only from one site the state of the overall skeleton in cross-sectional studies. (3) Trabecular bone from FH is extremely platelike at all ages. Changes in these structures are expressed by a simultaneous thinning and loss of interconnecting trabec-ulae and perforation of plates leading to new plates and rods. With these changes, connectivity density can either increase or decrease and is therefore not a representative measure for the state of the bone.
In conclusion, our work demonstrates that 3-D local morphometry in combination with 3-D global morpho-metry are useful tools for the investigation of changes in trabecular bone microstructures. In our study, these tools were used to improve our understanding of age-related microstructural changes in trabecular bone, but these new tools could in future studies also help to better understand microstructural changes related to disease and treatment in individual rod and plate elements separately.
Acknowledgements This study was partly supported by the SNF Professorship in Bioengineering of the Swiss National Science Foundation (FP 620–58097.99 and PP–104317/1) and the European Union BIOMED I concerted action“Assessment of Bone Quality in Osteoporosis”. We would also like to thank Dr. H.R. Roth for statistical advice.
References
1. Beck JS, Nordin BE (1960) Histological assessment of os-teoporosis by iliac crest biopsy. J Pathol Bacteriol 80:391–397 2. Caldwell RA (1962) Observations on the incidence, aetiology, and pathology of senile osteoporosis. J Clin Pathol 15:421–431 3. Lindahl O, Lindgren AG (1962) Grading of osteoporosis in autopsy specimens. A new method. Acta Orthop Scand 32:85– 100
4. Riggs BL (1991) Overview of osteoporosis. West J Med 154 (1):63–77
5. Consensus development conference (1991) Prophylaxis and treatment of osteoporosis (1991). Am J Med 90(1):107–110 6. Consensus development conference (1993) Diagnosis,
prophy-laxis, and treatment of osteoporosis. Am J Med 94(6):646–650 7. Consensus Development Conference (2000) Osteoporosis pre-vention, diagnosis, and therapy. NIH consensus statement 17 (1):1–45
8. Trotter M, Broman GE, Peterson RR (1960) Densities of bones of white and Negro skeletons. Am J Orthop 42–A:50–58
9. Bromley RG, Dockum NL, Arnold JS, Jee WS (1966) Quan-titative histological study of human lumbar vertebrae. J Gerontol 21(4):537–543
10. Chalmers J, Weaver JK (1966) Cancellous bone: its strength and changes with aging and an evaluation of some methods for measuring its mineral content. II. An evaluation of some methods for measuring osteoporosis. J Bone Joint Surg Am 48 (2):299–308
11. Dunnill MS, Anderson JA, Whitehead R (1967) Quantitative histological studies on age changes in bone. J Pathol Bacteriol 94(2):275–291
12. Wakamatsu E, Sissons HA (1969) The cancellous bone of the iliac crest. Calcif Tissue Res 4(2):147–61
13. Ellis HA, Peart KM (1972) Quantitative observations on mineralized and non-mineralized bone in the iliac crest. J Clin Pathol 25(4):277–86
14. Arnold JS, Wei LT (1972) Quantitative morphology of vertebral trabecular bone. In: Stover B, Jee WS (eds) Radiobiology of plutonium, JW Press, Salt Lake City, pp 333–354
15. Merz WA, Schenk RK (1970) Quantitative structural analysis of human cancellous bone. Acta Anat (Basel) 75(1):54–66 16. Melsen F, Melsen B, Mosekilde L, Bergmann S (1978)
Histomorphometric analysis of normal bone from the iliac crest. Acta Pathol Microbiol Scand, A 86(1):70–81
17. Vedi S, Compston JE, Webb A, Tighe JR (1982) Histomorpho-metric analysis of bone biopsies from the iliac crest of normal British subjects. Metab Bone Dis Relat Res 4(4):231–236 18. Atkinson PJ (1967) Variation in trabecular structure of
vertebrae with age. Calcif Tissue Res 1(1):24–32
19. Carter DR, Hayes WC (1977) The compressive behavior of bone as a two-phase porous structure. J Bone Joint Surg Am 59 (7):954–962
20. Rice JC, Cowin SC, Bowman JA (1988) On the dependence of the elasticity and strength of cancellous bone on apparent den-sity. J Biomech 21(2):155–168
21. Hui SL, Slemenda CW, Johnston CC, Jr (1988) Age and bone mass as predictors of fracture in a prospective study. J Clin Invest 81(6):1804–1809
22. Parfitt AM, Mathews CH, Villanueva AR, Kleerekoper M, Frame B, Rao DS (1983) Relationships between surface, vol-ume, and thickness of iliac trabecular bone in aging and in osteoporosis. Implications for the microanatomic and cellular mechanisms of bone loss. J Clin Invest 72(4):1396–1409 23. Kleerekoper M, Villanueva AR, Stanciu J, Rao DS, Parfitt AM
(1985) The role of three-dimensional trabecular microstructure in the pathogenesis of vertebral compression fractures. Calcif Tissue Int 37(6):594–597
24. Parfitt AM (1984) Age-related structural changes in trabecular and cortical bone: cellular mechanisms and biomechanical consequences. Calcif Tissue Int 36 (Suppl 1):S123–8 25. Mosekilde L (1988) Age-related changes in vertebral trabecular
bone architecture-assessed by a new method. Bone 9(4):247– 250
26. Mosekilde L (1989) Sex differences in age-related loss of vertebral trabecular bone mass and structure-biomechanical consequences. Bone 10(6):425–432
27. Thomsen JS, Ebbesen EN, Mosekilde LI (2002) Age-related differences between thinning of horizontal and vertical trabec-ulae in human lumbar bone as assessed by a new computerized method. Bone 31(1):136–142
28. Bergot C, Laval-Jeantet AM, Preteux F, Meunier A (1988) Measurement of anisotropic vertebral trabecular bone loss during aging by quantitative image analysis. Calcif Tissue Int 43(3):143–149
29. McCalden RW, McGeough JA, Court–Brown CM (1997) Age-related changes in the compressive strength of cancellous bone. The relative importance of changes in density and trabecular architecture. J Bone Joint Surg Am 79(3):421–427
30. Weinstein RS, Hutson MS (1987) Decreased trabecular width and increased trabecular spacing contribute to bone loss with aging. Bone 8(3):137–142
31. Rüegsegger P, Koller B, Müller R (1996) A microtomographic system for the nondestructive evaluation of bone architecture. Calcif Tissue Int 58(1):24–29
32. Müller R, Hildebrand T, Rüegsegger P (1994) Non-invasive bone biopsy: a new method to analyse and display the three-dimensional structure of trabecular bone. Phys Med Biol 39 (1):145–164
33. Müller R (2002) The Zürich experience: one decade of three– dimensional high–resolution computed tomography. Top Magn Reson Imaging 13(5):307–322
34. Wehrli FW, Saha PK, Gomberg BR, Song HK, Snyder PJ, Benito M, Wright A, Weening R (2002) Role of magnetic resonance for assessing structure and function of trabecular bone. Top Magn Reson Imaging 13(5):335–355
35. Majumdar S (1998) A review of magnetic resonance (MR) imaging of trabecular bone micro-architecture: contribution to the prediction of biomechanical properties and fracture prev-alence. Technol Health Care 6(5–6):321–327
36. Majumdar S (2002) Magnetic resonance imaging of trabecular bone structure. Top Magn Reson Imaging 13(5):323–334 37. Hildebrand T, Rüegsegger P (1997) A new method for the
model-independent assessment of thickness in three-dimen-sional images. J Microsc 185:67–75
38. Hildebrand T, Rüegsegger P (1997) Quantification of bone microarchitecture with the structure model index. Comput Methods Biomech Biomed Eng 1(1):15–23
39. Jinnai H, Watashiba H, Kajihara T, Nishikawa Y, Takahashi M, Ito M (2002) Surface curvatures of trabecular bone micro-architecture. Bone 30(1):191–194
40. Odgaard A, Gundersen HJ (1993) Quantification of connectiv-ity in cancellous bone, with special emphasis on 3–D recon-structions. Bone 14(2):173–182
41. Ding M (2000) Age variations in the properties of human tibial trabecular bone and cartilage. Acta Orthop Scand 292:1–45 42. Ding M, Odgaard A, Linde F, Hvid I (2002) Age-related
variations in the microstructure of human tibial cancellous bone. J Orthop Res 20(3):615–621
43. Kinney JH, Ladd AJ (1998) The relationship between three-dimensional connectivity and the elastic properties of trabecular bone. J Bone Miner Res 13(5):839–845
44. Stauber M, Nazarian A, Müller R (2002) Element based morphometric characterization of trabecular bone. Trans Europ Orthop Res Soc 12, pp O89
45. Stauber M, Rapillard L, Zysset PK, Müller R (2003) Element based morphometry– a new tool for the assessment of mechano– structure relationships in trabecular bone. Trans Orthop Res Soc 28:109 New Orleans
46. Stauber M, Müller R (2006) Volumetric spatial decomposition of trabecular bone into rods and plates – A new method for local bone morphometry. Bone in press
47. Hildebrand T, Laib A, Müller R, Dequeker J, Rüegsegger P (1999) Direct three-dimensional morphometric analysis of human cancellous bone: microstructural data from spine, femur, iliac crest, and calcaneus. J Bone Miner Res 14(7): 1167–1174
48. Dequeker J (1994) Assessment of quality of bone in osteopo-rosis–BIOMED I: fundamental study of relevant bone. Clin Rheumatol 13 (Suppl 1):7–12
49. Melton LJ, 3rd (2000) Who has osteoporosis? A conflict be-tween clinical and public health perspectives. J Bone Miner Res 15(12):2309–2314
50. Cummings SR, Melton LJ (2002) Epidemiology and outcomes of osteoporotic fractures. Lancet 359(9319):1761–1767 51. Aerssens J, Boonen S, Joly J, Dequeker J (1997) Variations in
trabecular bone composition with anatomical site and age: potential implications for bone quality assessment. J Endocrinol 155(3):411–421
52. Dequeker J, Boonen S, Breemans S (1995) Assessment of quality of bone in osteoporosis: clinical characteristics of pa-tient material. Clin Rheumatol 14:596
53. Müller R, Rüegsegger P (1997) Micro-tomographic imaging for the nondestructive evaluation of trabecular bone architecture. Stud Health Technol Inform 40:61–79
54. Hahn M, Vogel M, Pompesius-Kempa M, Delling G (1992) Trabecular bone pattern factor–a new parameter for simple quantification of bone microarchitecture. Bone 13(4):327–330 55. Bernard TM, Manzanera A (1999) Improved Low Complexity Fully Parallel Thinning Algorithm 10th International Confer-ence on Image Analysis and Processing (ICIAP‘99), Venice, Italy
56. Manzanera A, Bernard TM, Prêteux F, Longuet B (1999) Medial faces from a concise 3D thinning algorithm Interna-tional Conference on Computer Vision (ICCV‘99), Kerkyra, Greece, pp 337–343
57. Saha PK, Chaudhuri BB (1996) 3D digital topology under binary transformation with applications. Comput Vis Image Underst 63(3):418–429
58. Cleveland WS (1979) Robust locally weighted regression and smoothing scatterplots. J Am Stat Assoc 74(368):829–836 59. Cleveland WS (1981) Lowess – a program for smoothing
scatterplots by robust locally weighted regression. Am Stat 35 (1):54–54
60. Ding M, Hvid I (2000) Quantification of age-related changes in the structure model type and trabecular thickness of human tibial cancellous bone. Bone 26(3):291–295
61. Cummings SR, Black DM, Nevitt MC, Browner WS, Cauley JA, Genant HK, Mascioli SR, Scott JC, Seeley DG, Steiger P, et al. (1990) Appendicular bone density and age predict hip fracture in women. The Study of Osteoporotic Fractures Research Group. JAMA 263(5):665–668
62. Riggs BL, Melton Iii LJ, Robb RA, Camp JJ, Atkinson EJ, Peterson JM, Rouleau PA, McCollough CH, Bouxsein ML, Khosla S (2004) Population-based study of age and sex dif-ferences in bone volumetric density, size, geometry, and struc-ture at different skeletal sites. J Bone Miner Res 19(12):1945– 1954
63. Parfitt AM (1989) Plasma calcium control at quiescent bone surfaces: a new approach to the homeostatic function of bone lining cells. Bone 10(2):87–88
64. Müller R (2005) Long-term prediction of three-dimensional bone architecture in simulations of pre-, peri- and post-meno-pausal microstructural bone remodeling. Osteoporos Int 16 (Suppl 2):S25–S35
65. Hayes WC, Carter DR (1976) Postyield behavior of subchon-dral trabecular bone. J Biomed Mater Res 10(4):537–544 66. Turner CH (1989) Yield behavior of bovine cancellous bone.
J Biomech Eng 111(3):256–260
67. Michel MC, Guo XD, Gibson LJ, McMahon TA, Hayes WC (1993) Compressive fatigue behavior of bovine trabecular bone. J Biomech 26(4–5):453–463
68. Müller R, Gerber SC, Hayes WC (1998) Micro-compression: a novel technique for the nondestructive assessment of local bone failure. Technol Health Care 6(5–6):433–444
69. Nazarian A, Müller R (2004) Time-lapsed microstructural im-aging of bone failure behavior. J Biomech 37(1):55–65 70. Gibson LJ (2005) Biomechanics of cellular solids. J Biomech