Publisher’s version / Version de l'éditeur:
Vous avez des questions? Nous pouvons vous aider. Pour communiquer directement avec un auteur, consultez la première page de la revue dans laquelle son article a été publié afin de trouver ses coordonnées. Si vous n’arrivez pas à les repérer, communiquez avec nous à PublicationsArchive-ArchivesPublications@nrc-cnrc.gc.ca.
Questions? Contact the NRC Publications Archive team at
PublicationsArchive-ArchivesPublications@nrc-cnrc.gc.ca. If you wish to email the authors directly, please see the first page of the publication for their contact information.
https://publications-cnrc.canada.ca/fra/droits
L’accès à ce site Web et l’utilisation de son contenu sont assujettis aux conditions présentées dans le site LISEZ CES CONDITIONS ATTENTIVEMENT AVANT D’UTILISER CE SITE WEB.
Research Report (National Research Council of Canada. Institute for Research in Construction), 2008-09-12
READ THESE TERMS AND CONDITIONS CAREFULLY BEFORE USING THIS WEBSITE. https://nrc-publications.canada.ca/eng/copyright
NRC Publications Archive Record / Notice des Archives des publications du CNRC :
https://nrc-publications.canada.ca/eng/view/object/?id=63eae1c4-fb0e-4a94-8341-32f657eb8953 https://publications-cnrc.canada.ca/fra/voir/objet/?id=63eae1c4-fb0e-4a94-8341-32f657eb8953
NRC Publications Archive
Archives des publications du CNRC
For the publisher’s version, please access the DOI link below./ Pour consulter la version de l’éditeur, utilisez le lien DOI ci-dessous.
https://doi.org/10.4224/20374197
Access and use of this website and the material on it are subject to the Terms and Conditions set forth at International Road Tunnel Fire Detection Research Project - Phase II Task 4: Field Fire Tests on Performance of Fire Detection Systems in an Operating Road Tunnel in Montreal
Liu, Z. G.; Crampton, G. P.; Kashef, A.; Lougheed, G. D.; Gibbs, E.; Muradori, S.
International Road Tunnel Fire Detection Research Project – Phase II
TASK 4: FIELD FIRE TESTS ON PERFORMANCE OF FIRE
DETECTION SYSTEMS IN AN OPERATING ROAD
TUNNEL IN MONTREAL
Prepared by
Z. G. Liu, G. Crampton, A. Kashef, G. Lougheed, E. Gibbs and S. Muradori
Fire Research Program
Institute for Research in Construction
2
International Road Tunnel Fire Detection Research Project – Phase II
Project Technical Panel
Frank Gallo, Port Authority of New York and New Jersey Harry Capers, New Jersey DOT
Alexandre Debs, Ministry of Transportation of Quebec Jesus Rohena, Federal Highway Administration
Paul Patty, Underwriters Laboratories Inc. Volker Wetzig, Versuchs Stollen Hagerbach AG Art Bendelius, A & G Consultants
Bill Connell, Parsons Brinckerhoff
Margaret Simonson, Swedish National Testing and Research Institute Gary English, Seattle Fire Department
Peter Johnson, ARUP Fire Risk & Security Jim Lake, NFPA staff liaison
Principal Sponsors
Ministry of Transportation of British Columbia Ministry of Transportation of Ontario
Ministry of Transportation of Quebec
The City of Edmonton, Transportation Department, Transit Projects BranchAxonX LLC
Siemens Building Technologies Tyco Fire Products
VisionUSA
Sureland Industrial Fire Safety
United Technologies Research Corporation
Contributing Sponsors
National Research Council of Canada
Port Authority of New York and New Jersey A & G Consultants
PB Foundation Micropack, Inc.
J-Power Systems and Sumitomo Electric U.S.A., Inc. Honeywell Inc.
EXECUTIVE SUMMARY
This report presents the results of the research completed in Task 4 of the International Road Tunnel Fire Detection Research Project (Phase II): Field Fire Tests in an Operating Road Tunnel in Montreal, Canada. The objectives of Task 4 were:
• Investigate the performance of fire detectors/detection systems in an operating tunnel environment;
• Evaluate the performance of selected fire detectors at their maximum detection range; and
• Provide technical information for comparison to those obtained in the laboratory tunnel tests.
The field fire tests were conducted on June 23, 2007 in Tube A of Carré-Viger Tunnel that is located in downtown Montreal. The section of the tunnel used in the tests was 400 m long, 5 m high and 16.8 m wide (4 traffic lanes). The tunnel was equipped with four jet fans, which were used for emergency ventilation.
Six fire detectors/detection systems were evaluated. They were: two linear heat detection systems, one optical flame detector, and three video imaging detection (VID) systems. These detectors and their alarm levels were the same as used in the tests conducted in a laboratory tunnel facility in Tasks 2 and 7. The maximum detection distance of the optical flame detector D-3F1 with medium sensitivity level was approximately 30 m, and the maximum detection distances of the three VID systems were approximately 60 m. The sensing cables of the two linear heat detection systems were installed on the ceiling of the tunnel close to the fire locations.
Nine full-scale fire tests were conducted using three fire scenarios. The scenarios were similar to ones used in the laboratory tunnel tests conducted in Tasks 2 and 7 of the project. The fire scenarios used in the tests included a small gasoline pool fire (0.09 m2), a gasoline pool fire (0.36 m2) located underneath a simulated vehicle, and a gasoline pool fire (0.36 m2) located behind a large simulated vehicle. The fire sizes were varied from 125 kW to 650 kW as measured using a calorimeter.
Four tests were conducted with a small gasoline pool fire (0.09 m2) at different locations in the tunnel. The maximum heat release rate produced by the fire was approximately 125 kW. The tests were designed to study the effect of changing fire location on the response of the detection systems to a small open pool fire. There was minimal airflow in the tunnel during these tests. In this scenario, the fire developed very quickly and substantial smoke was produced.
4 release rate of the fire was approximately 650 kW. The fire source was located at a fixed position in the tunnel and the average airflow velocities were varied: 1.3, 2.0 and 2.4 m/s.
Two tests were conducted with an open pool fire located behind a simulated vehicle. The tests were designed to study the response of the detection systems to a small fire (0.6 m x 0.6 m fuel pan) located behind a vehicle under airflow conditions. The heat release rate of the fire was approximately 650 kW. A different location for the fire was used for the two tests. The average airflow velocity in the tunnel was 1.3 m/s.
The fire characteristics, including temperatures and smoke spread in the tunnel, were measured in the tests. The activation time of each detector/detection system under various ventilation conditions was recorded. The ability of the detection systems to locate and monitor the fire was also evaluated. Table 1 provides a summary of the test conditions and results of Task 4. General observations on the performance of fire detectors/detection systems in test series are as follows:
• The performances of the fire detection systems were generally consistent with those observed in the laboratory tunnel tests under the same test conditions. • The pool fires located underneath a vehicle were more difficult to detect than
the fires located behind a vehicle. The response times of fire detection systems for the fire located underneath a vehicle were generally longer than those for the fire located behind a vehicle.
Observations on the response of the linear heat detection systems are as follows: • The linear heat detection systems were able to respond to small fires based on
the rate of rise of temperature, even though the ceiling temperature was not high. The response time of the linear detection system D-1L1 to a small open pool fire (125 kW) ranged from 22 s to 33 s, and the response time of the linear detection system D-2L2 ranged from 41 s to 45 s.
• The response times of the linear heat detection systems were not affected by fire location in the tunnel, as the fires were always near a section of the cable. The detection times increased with an increase in airflow speed as the ceiling temperature decreased.
• The linear heat detection system D-1L1 was able to determine the fire location to within 2 m range but the hot spot identified by the system under longitudinal airflow conditions was not the real fire location.
Observations on the response of the optical flame detector D-3F1 are as follows: • The optical flame detector D-3F1 was able to detect all fires within its
detection range. The detection time ranged from 25 s to 76 s in the test series, depending on the fire scenario, fire size and airflow conditions.
• The detector did not respond to the fire, when it was located beyond its maximum detection distance (~30 m).
• Its performance was affected by an increase in airflow speed.
Observations on the response of the three VID systems are as follows:
• The three VID systems were able to detect the small open fires (125 kW) at their maximum detection range (~60 m). The change in location of the small open fire in the tunnel had a limited impact on the performance of Detectors D-4C1 and D-6C3, but had a substantial impact on the performance of D-5C2. • The performance of the three VID systems was affected by longitudinal
airflow conditions. Both D-4C1 and D-5C2 were able to detect the fire located underneath a vehicle at the three airflow speeds. The response time was either decreased or increased depending on the airflow velocity.
• The airflow conditions made it more difficult for D-6C3 to respond to the fire. It detected the fire in the tests with an airflow speed of 1.3 m/s and 2.4 m/s but did not respond to the fire at an airflow speed of 2 m/s.
• Both D-4C1 and D-5C2 were able to detect the fire located behind the vehicle when the fire was 32 m from the detectors, but did not respond to the fire when it was 60 m from the detectors.
• D-6C3 detected the fire at both locations but the response time increased with an increase in distance.
6
Response Time of Detectors/Detection Systems D-3F1 (s) Fire scenario Test no Pan (m) Fire Location from Detectors Fuel Type Heat Release Rate (kW) Wind Speed (m/s) D-1L1 (s) D-2L2 (s) H* M* D-4C1 (s) D-5C2 (s) D-6C3 (s) F-1 0.3 x 0.3 32 m in 1st lane Gasoline ~125 0 29 41 6 33 44 46 6 F-5 0.3 x 0.3 35 m in 4st lane Gasoline ~125 0 30 45 3 N/R* 46 13 6 F-7 0.3 x 0.3 60 m in 1st lane Gasoline ~125 0 22 N/R* 7 N/R 58 167 9 Open pool fires F-9 0.3 x 0.3 62 m in 4st lane Gasoline ~125 0 33 N/R* 9 N/R 47 58 6 F-3 0.6 x 0.6 32 m in 1st lane Gasoline ~650 ~1.5 48 43 3 33 56 66 13 F-2 0.6 x 0.6 32 m in 1st lane Gasoline ~650 ~2.5 101 96 4 76 88 18 N/R* Pool fires under the vehicle F-4 0.6 x 0.6 32 m in 1st
lane Gasoline ~650 ~3 N/R* 101 34 N/A 66 38 51 F-6 0.6 x 0.6 32 m in 1st lane Gasoline ~650 ~1.3 30 29 N/A 25 47 24 6
Pool fires behind vehicle
F-8 0.6 x 0.6 60 m in 1st lane Gasoline ~650 ~1.3 32 31 12 N/R N/R N/R* 18
Note:
• N/R*: no response in the test
• H*: optical flame detector D-3F1 with very high sensitivity • M*: optical flame detector D-3F1 with medium sensitivity • The systems listed in the table are as follows:
D-1L1: Linear fiber optic heat detection system D-2L2: Linear cable heat detection system D-3F1: Flame detector
D-4C1: VID flame/smoke detector D-5C2: VID flame/smoke detector D-6C3: VID flame detector
ACKNOWLEDGEMENTS
The project was conducted under the auspices of the Fire Protection Research Foundation (FPRF). The authors would like to acknowledge the support of the Technical Panel, Sponsors as well as many NRCC staff to this project. A special acknowledgement is noted to Kathleen Almand of the FPRF for her contribution in managing the project. In addition, the Ministry of Transportation of Quebec is recognized for their contribution of tunnel resources and time, particularly Alexandre Debs.
8
TABLE OF CONTENTS
1. Introduction ... 9
2. Test Tunnel ... 9
3. Fire Detection Systems and Test Setups ... 13
4. Instrumentation ... 15
5. Test Procedure……….18
6. Ventilation Setup and Airflow Measurement………...…… 19
7. Fire Tests and Results ... 22
7.1 Open Pool Fires... 24
7.1.1 Fire Characteristics ... 26
7.1.2 Response of Fire Detection Systems... 29
7.2 Pool Fires Located Underneath Vehicle ... 31
7.2.1..Fire Characteristics……….33
7.2.2.. Response of Fire Detection Systems ……….38
7.3 Open Pool Fires Located behind A Large Vehicle ... .40
7.3.1 Fire Characteristics………42
7.3.2 Response of Fire Detection Systems………..47
8. Summary.……….49
1. INTRODUCTION
A series of fire tests were conducted on June 23, 2007 in the Carré-Viger Tunnel located in Montreal, Canada, in collaboration with the Ministry of Transport of Quebec (MTQ) as part of the International Road Tunnel Fire Detection Research Program (Phase II). The fire tests in an operating road tunnel were an important component of the research program (Task 4). There were three objectives related to this task:
• Investigate the performance of fire detectors/detection systems in an operating tunnel environment;
• Evaluate the performance of selected fire detectors at their maximum detection range; and
• Provide technical information for comparison to those obtained in the laboratory tunnel tests.
This report provides the results of Task 4 of the International Road Tunnel Fire Detection Research Project (Phase II). Information on the tunnel, fire scenarios, fire detectors/detection systems and test instrumentation is provided. The fire characteristics, such as the fire growth rate, temperature and smoke spread in the tunnel, are presented. The performances of the fire detectors/detection systems to tunnel fire scenarios, including their response time and their ability to locate and monitor a fire as well as the impact of longitudinal airflow on their performance, are reported.
2. TEST TUNNEL
The Carré-Viger Tunnel, completed in 1986, is a part of the A-720 Autoroute Ville-Marie that runs through downtown Montreal. The tunnel is composed of two underground one-way traffic tubes running East to West (Tube A) and West to East (Tube B). Each tube is a 4-lane roadway with a length of approximately 400 m, a width of 16.8 m, and a height of 5.0 m to the tunnel ceiling (as shown in Figures 2.1 and 2.2). Only trucks that do not carry hazardous materials are allowed in the tunnel.
The tunnel has a longitudinal ventilation system that is equipped with eight ceiling jet fans (4 fans in each tube). The jet fan system in Tube A of the tunnel is shown in Figure 2.3. The capacity of each jet fan is 23.6 and 14.2 m3/s in the supply and exhaust modes, respectively. Each jet fan can operate on its own or in combination with other fans. The ventilation flows can be adjusted as needed.
The field tests were all conducted in Tube A of the Carré-Viger Tunnel. During the field tests, longitudinal airflow conditions were simulated by activating one or more fan(s).
10
Figure 2.1. Photograph of Tube A of the Carré-Viger Tunnel
Figure 2.2. Schematic of the Carré-Viger Tunnel
12
3. FIRE DETECTORS/DETECTION SYSTEMS AND SETUP
Six fire detectors/detection systems were evaluated in the test series. They were: two linear heat detection systems D-1L1 and D-2L2, one optical flame detector D-3F1, and three video image detection (VID) systems D-4C1, D-5C2 and D-6C3. These detectors/detection systems were the same as those used in the full-scale tests conducted in a laboratory tunnel facility [1, 2]. A detailed description of these detectors and systems was provided in the reports for Tasks 2 and 7 of the project [1, 2].
The maximum detection distance of the optical flame detector D-3F1 with a medium sensitivity setting was approximately 30 m. The maximum detection distances of the three VID systems were approximately 60 m.
Two linear heat detection systems were installed on the ceiling of the tunnel. These systems would respond to a fire if the rate of temperature rise or the temperature at the cables meets the detection criteria. A schematic showing the setup of the detectors/detection systems in the tunnel is shown in Figure 3.1.
The fire detection capability and coverage area of the flame and VID systems were evaluated at their maximum detection distance by locating the fires 30 m and 60 m from the detectors as well as on both sides of the tunnel (Figure 3.1).
The sensing cables of two linear heat detection systems, D-1L1 and D-2L2, were installed on the ceiling of the tunnel in a loop with dimensions of 8.4 m in width and 50 m in length. The sensing cables were 80 mm below the ceiling and 4.2 m from the wall of the tunnel (Figure 3.1). The total lengths of the two linear heat detection systems were approximately 2,230 m (approximately 150 m was used in the tunnel to form the loop at the ceiling) and 140 m, respectively. A photograph of the linear heat detectors is shown in Figure 3.2.
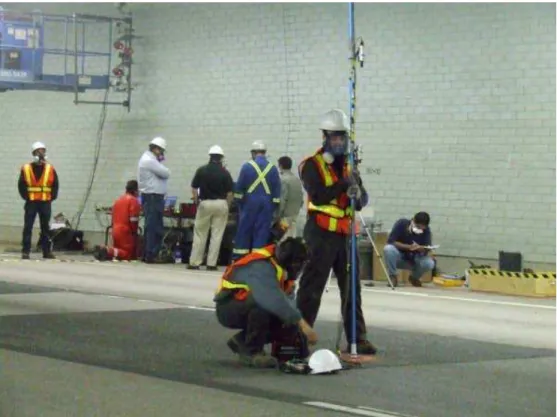
The optical flame detector and the three VID systems were fastened to a lift vehicle and located near the North wall of the tunnel (Figure 3.3) to simulate wall-mounted detectors. The height of the optical flame detector D-3F1, the VID flame/smoke detector D-4C1, the VID flame/smoke detector D-5C2 and the VID flame detector D-6C3 were approximately 4 m, 4.5 m, 4.3 m and 3.9 m above the ground, respectively.
The distance between the wall mounted detectors and the nearest section of the linear heat detectors was approximately 15 m. The distance between the jet fans and the linear heat detectors and the wall mounted detectors were 55 m and 120 m, respectively.
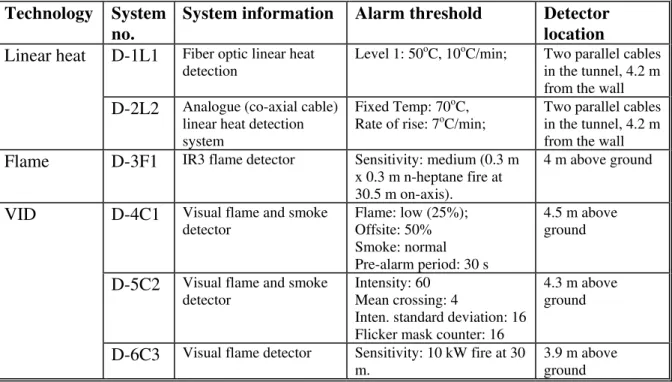
The sensitivity levels of the fire detectors/detection systems in the test series were the same as used in Task 7 of the project [2]. General information on the detectors and systems is summarized in Table 3.1.
Figure 3.1. Schematic of detector/detection system setup in the tunnel 60 m CH 180+00 CH 181+00 CH 182+00 CH 178+00 16.8 m 60 m Wall mounted detectors
Table 3.1. Fire Detection Systems in Test Program
Technology System no.
System information Alarm threshold Detector
location
D-1L1 Fiber optic linear heat detection
Level 1: 50oC, 10oC/min; Two parallel cables in the tunnel, 4.2 m from the wall Linear heat
D-2L2 Analogue (co-axial cable) linear heat detection system
Fixed Temp: 70oC, Rate of rise: 7oC/min;
Two parallel cables in the tunnel, 4.2 m from the wall Flame D-3F1 IR3 flame detector Sensitivity: medium (0.3 m
x 0.3 m n-heptane fire at 30.5 m on-axis).
4 m above ground
D-4C1 Visual flame and smoke detector Flame: low (25%); Offsite: 50% Smoke: normal Pre-alarm period: 30 s 4.5 m above ground
D-5C2 Visual flame and smoke detector
Intensity: 60 Mean crossing: 4
Inten. standard deviation: 16 Flicker mask counter: 16
4.3 m above ground VID
D-6C3 Visual flame detector Sensitivity: 10 kW fire at 30 m.
3.9 m above ground
14
Figure 3.3. Photograph of detector setup in the test tunnel Figure 3.2. Photograph of linear heat detection systems
Detectors
4. INSTRUMENTATION
Instrumentation used in the test series included thermocouples, smoke meters, velocity meters and video cameras. Figure 4.1 shows the location of the instrumentation in the tunnel.
Three thermocouple trees were distributed in the tunnel to monitor temperatures produced by the fires. Thermocouple tree #1 was located near the fire source in each test to measure the flame/plume temperature of the fire and to monitor the fire development. There were four thermocouples on the tree spaced at 1.0 m intervals starting 2 m above the tunnel floor. The locations of the other thermocouple trees (#2 and #3) were fixed in the tunnel. They were placed at the middle of the tunnel 15 m and 30 m downstream of the fire, respectively, when the fire was located at 30 m from the detectors mounted on the wall of the tunnel. The thermocouple trees were 45 m and 60 m downstream of the fire, when the fire was located at 60 m from the detectors. There were five thermocouples on each tree spaced at 1.0 m intervals starting 1 m above the tunnel floor. These two thermocouple trees were held manually during the tests, as shown in Figure 4.2.
Two smoke meters were attached to thermocouple trees #2 and #3 to measure smoke optical density and monitor the smoke spread in the tunnel. There was a 0.6 m vertical light path between the transmitter and the receiver for each smoke meter. The first smoke meter on the thermocouple tree was located near the ceiling with its mid-point approximately 0.3 below the ceiling. The second smoke meter had its mid-point 2.3 m below the ceiling.
A hand held velocity meter mounted on a 4 m long aluminium pole was used to measure the air velocity in the tunnel. The air velocity was manually recorded during the tests.
Two video cameras were used to record and monitor fire conditions in the tests. One video camera was located near the wall-mounted fire detectors. It was used to monitor conditions in the tunnel between the fire and the detectors. The second video camera was placed near the fire source. It was used to monitor the fire conditions from behind the fire towards the detectors.
Four data acquisition systems were used in the tests. There was one system for each thermocouple tree used to collect temperature and smoke data. One system was located near the fire detectors/detection systems and was used to monitor the response of the detectors/detection systems to the fires. The test data were collected at one second time interval.
16
Figure 4.1. Schematic of instrumentation in the tunnel
8.4 m
55 m
60 m
CH 180+00 CH 181+00 CH 182+00 CH 178+00 4.2 mJet fan
16.8 m
Thermocouple tree Video camera18
5. TEST PROCEDURE
The test procedure used in the test series was as follows:
• Set up fire test;
• Checked instrumentation and each detection system prior to each test; • Activated fan systems in ventilated tests;
• Measured air velocities around the location of the fire source;
• Started the data acquisition systems and video recorders for 30 s baseline; • Ignited the fire;
• Terminated the test once the fuel in the pan was consumed and the fire self extinguished;
• Checked each detection system to determine if they still functioned properly after the fire test.
6. VENTILATION SETUP AND AIRFLOW MEASUREMENT
Four airflow velocities were used to study the impact of longitudinal airflow on the performance of the fire detectors/detection systems. Tests were conducted under ambient airflow as well as three airflow speeds provided by running the jet fans: velocity #1 by operating Jet Fan #3, velocity #2 by operating Jet Fans #1 and #4, and velocity #3 by operating Jet Fans #1, #2 and #4. The configuration of the jet fans in the tunnel is shown in Figure 6.1a. The fans are located in a recess in the tunnel ceiling, which at its maximum height is approximately 9 m. The base of the fans was at a height of 6 m. The tunnel ceiling height was 5 m (Figure 6.1b).
The fans are not operated under normal conditions unless the environmental conditions in the tunnel (pollution) necessitate their operations. Their primary use is for emergencies.
Air velocity measurements were conducted at a number of cross sections of the tunnel, including the section where the fire was located using a velocity meter. Measurements were taken prior to and during the tests (Figure 6.2). The measurement locations were 60 m, 90 m, 150 m and 210 m from the fans. The velocities were measured at 9 points at each location. As shown in Figure 6.1b, points 1, 2 and 3 were located 4.4 m from the North wall of the tunnel and 1 m, 2.5 m and 4 m above the ground, respectively. Points 4, 5 and 6 were located 8.4 m from the North wall of the tunnel and 1 m, 2.5 m and 4 m above the ground, respectively. Points 7, 8 and 9 were located at 12.4 m from the North wall of the tunnel and 1 m, 2.5 m and 4 m above the ground, respectively.
Test results showed that air velocities were more uniform with an increase in distance from the fan systems. The air velocity near the fire source was affected by the setup around the fire, such as the size and location of obstacles. Figure 6.3 shows the air velocities measured at the section where the fire was located (32 m from the detectors) for Test F-3 using Jet Fan #3. The average air velocity was 1.3 m/s. The average airflow velocities produced with two and three jet fans were 2 m/s and 2.4 m/s, respectively.
20
Figure 6.1a. Jet Fan Systems in Viger Tunnel
Figure 6.1b. Velocity measuring points in Viger Tunnel
1 2 3 4 Jet fan Measuring point 1 2.5 4.0
1.3 m/s 1.2 m/s 1.3 m/s 1.5 m/s 1.2 m/s 1.3 m/s 1.7 m/s 1.7 m/s 1.4 m/s 1 2 3 9 4 5 6 7 8 Fire
22
7. FIRE TESTS AND RESULTS
Nine full-scale fire tests were conducted using three fire scenarios. The scenarios included open gasoline pool fires, gasoline pool fires located underneath a simulated vehicle, and gasoline pool fires located behind a simulated large vehicle. The fire sizes in the tests varied from approximately 125 kW to 650 kW. The fire size was limited to minimize possible damage to equipment and the tunnel. The scenarios were similar to ones used in the laboratory tunnel tests conducted in Tasks 2 and 7, which are described in detail in the reports of Tasks 2 and 7 of the project [1, 2].
The fires were placed at different locations in the tunnel to evaluate the detection capability of the fire detectors/detection systems at the maximum detecting distance and coverage areas. Figure 7.1 shows the locations of the fires in the tunnel. Detailed information on the fire locations is as follows:
• Fire Position 1 (FP 1) was located in Lane 1 of the tunnel and approximately 33 m from the detectors mounted at the North wall of the tunnel, 4.8 m from the North wall of the tunnel and 0.6 m from the nearest section of the linear heat detector cables.
• Fire Position 2 (FP 2) was located in Lane 4 approximately 35 m from the detectors mounted at the North wall of the tunnel, 12.8 m from the North wall of the tunnel and 0.2 m from the nearest section of the linear heat detector cables.
• Fire Position 3 (FP 3) was located in Lane 1 approximately 60 m from the detectors mounted at the North wall of the tunnel, 4.8 m from the North wall of the tunnel and 0.6 m from the nearest section of the linear heat detector cables.
• Fire Position 4 (FP 4) was located in lane 4 approximately at 61.5 m from the detectors mounted at the North wall of the tunnel, 12.8 m from the North wall of the tunnel and 0.2 m from the nearest section of the linear heat detector cables.
The distance of the fire at positions FP 1 and FP 3 to the North wall of the tunnel (4.8 m) was greater than used in the laboratory tunnel tests (2.5 m). This gave a wider view for the detectors mounted on the wall to monitor the fire.
The average air velocities used in the tests were 0 m/s, 1.3 m/s, 2 m/s and 2.4 m/s. The air velocity at the fire source was measured prior to and during each fire test.
The fire behaviour in the tests, such as the fire growth rates, temperatures and smoke spread in the tunnel, were investigated. The activation time of each detector/detection system under various test conditions was recorded. The ability of the detection systems to locate and monitor the fire incident was also evaluated.
8.4 m
55 m
60 m
CH 180+00 CH 181+00 CH 182+00 CH 178+00 4.2 mJet fan
16.8 m
FP 1 FP 2 FP 4 FP 3Wall mounted detectors
24
Figure 7.2. Photograph of a small open pool fire in Viger Tunnel tests
7.1 Open Pool Fires
Four full-scale tests were conducted with a 0.3 m by 0.3 m gasoline pool fire (Tests F-1, F-5, F-7 and F-9). The fire (Figure 7.1) was placed at four locations in the tunnel. There was no obstacle around the fire source. Ambient temperature in the tunnel was 18oC with no prevailing wind. All tests were conducted with minimal airflow velocity in the tunnel (approximately 0 m/s). The tests were designed to study the response of the detectors/detection systems to a small open pool fire. The test conditions and results for the open pool fire are listed in Table 7.1.
The fire was allowed to burn freely for approximately 9 minutes until the gasoline in the pan was consumed. The fire developed very quickly and substantial smoke was produced and accumulated below the ceiling (Figure 7.2). The smoke did not obstruct the view of the detectors during the tests. The maximum heat release rate produced by the fire was approximately 125 kW.
RESPONSE TIME OF DETECTORS/DETECTION SYSTEMS D-3F1 (s) FIRE SCENARIO TEST NO PAN (m) FIRE LOCATION FROM DETECTORS FUEL TYPE HEAT RELEASE RATE (kW WIND SPEED (m/s) D-1L1 (s) D-2L2 (s) H* M* D-4C1 (s) D-5C2 (s) D-6C3 (s) F-1 0.3 x 0.3 32 m in 1st lane Gasoline ~125 0 29 41 6 33 44 46 6 F-5 0.3 x 0.3 35 m in 4st lane Gasoline ~125 0 30 45 3 N/R* 46 13 6 F-7 0.3 x 0.3 60 m in 1st lane Gasoline ~125 0 22 N/R* 7 N/R 58 167 9 Open pool fires F-9 0.3 x 0.3 62 m in 4st lane Gasoline ~125 0 33 N/R* 9 N/R 47 58 6 Note:
• N/R*: no response in the test
• H*: optical flame detector D-3F1 with very high sensitivity • M*: optical flame detector D-3F1 with medium sensitivity • The systems listed in the table are as follows:
D-1L1: Linear fiber optic heat detection system D-2L2: Linear cable heat detection system D-3F1: Flame detector
D-4C1: VID flame/smoke detector D-5C2: VID flame/smoke detector D-6C3: VID flame detector
26 Time (s) 0 100 200 300 400 500 600 Te mp era ture ( o C) 0 20 40 60 80 100 120 140 2 m 3 m 4 m 5 m Elevation from ground
ignition
Figure 7.3. Temperatures at Thermocouple Tree #1 in Test F-1
7.1.1 Fire Characteristics
Figure 7.3 shows the variation in temperature with time in Test F-1 when the fire was located at FP 1. The temperatures were measured at thermocouple tree #1 near the fire source. The temperature was approximately 120oC near the tip of the fire plume and it quickly decreased with an increase in elevation. The maximum temperature near the ceiling of the tunnel was approximately 33oC. The rate of rise of temperature at the ceiling was approximately 15oC/min.
Time (s) 0 100 200 300 400 500 600 T e mper ature ( o C) 15 16 17 18 19 20 21 22 23 24 25 5 m 4 m 3 m 2 m 1 m Elevation from ground
ignition
Figure 7.4. Temperatures measured at Thermocouple Tree #2 15 m from fire location in Test F-1
Figure 7.4 shows the temperatures measured at thermocouple tree #2, 15 m from the fire source in Test F-1. The temperature started to increase approximately 70 s after the ignition of the fire. The temperature increase near the ceiling was approximately 4oC. There was a minimal increase in temperature at heights less than 4 m.
28 The smoke production and spread in Test F-1 are shown in Figure 7.5. The smoke optical densities (OD/m) near the ceiling were measured 15 m and 30 m from the fire location. The smoke optical density increased with time and had a significant increase when the fire reached a certain level. The smoke optical density at 15 m from the fire source was higher than that at 30 m. This suggests the smoke was diluted as it moved down the tunnel. The smoke spread in the tunnel can be calculated from the time interval from ignition and the distance between the measuring point and the fire location. Since the optical smoke density produced by the small pool fire was limited, the VID systems were able to monitor the fire conditions in the tunnel throughout the tests.
Time (s) 0 100 200 300 400 500 Sm o k e De ns ity ( O D /m ) 0.00 0.02 0.04 0.06 0.08 0.10 0.12 0.14 15 m 30 m ignition
Distance from fire source
7.1.2 Response of Fire Detection Systems
The fire characteristics produced by the small open pool fire in Tests F-5, F-7 and F-9 were similar to those produced in Test F-1. Figure 7.6 summarizes the response times of the fire detectors/detection systems to the fire at the four locations in the tunnel.
The linear heat detection system D-1L1 responded to the fire at all four locations, based on the rate of rise of the temperature produced by the fire. It detected the small fire with the response time ranging from 22 s to 33 s, as shown in Table 7.1. The change in fire location in the tunnel had a limited impact on the detection performance, as the fire was always near a section of the detection cable. The response times were consistent with those measured in the laboratory tunnel tests with the same fire setup [1]. In addition, the system was able to identify the fire location in the tunnel by determining the location in the cable with the change in temperature. Figure 7.7 shows the variation of the temperature along the cable in Test F-7. The maximum temperature increase was 20oC.
The linear heat detection system D-2L2 detected the fire when it was located at positions FP #1 and FP #2 with the response times ranging from 41 s to 45 s. It did not respond to the fires located at positions FP #3 and FP #4.
The optical flame detector D-3F1 with a medium sensitivity level responded to the fire located at FP #1 approximately 32 m from the detector at 33 s. It did not respond to the fires located at the other three positions, which were located outside its maximum detection distance.
The flame/smoke VID system D-4C1 detected all the fires with the response times ranging from 44 s to 58 s. The change in fire location in the tunnel had a limited impact on its performance.
The flame/smoke VID system D-5C2 also responded to all the fires with the response times ranging from 13 s to 167 s. The performance of the detector was affected by the change in fire location.
The flame VID system D-6C3 detected the fires located at FP #1 to FP #3 in the tunnel with the detection time ranging from 6 s to 9 s. It detected the fire at position FP #4, after the view of the detector was adjusted. The performance in the operating tunnel was consistent with that in the laboratory tunnel tests with the same fire setup [1].
30 Detec ting Time ( s ) 0 50 100 150 200 FP1 FP2 FP 3 FP 4 D-1L1 D-2L2 D-3F1 D-4C1 D-6C3 Detectors/Detection Systems D-5C2 no response Fire position
Figure 7.6. Response times of fire detectors/detection systems to a 0.09 m2 open fire
Fire Detection Test No.7 (ignition time: 03:28:56)
0 10 20 30 40 50 60 2150 2170 2190 2210 2230 2250 2270 2290 2310 Distance (m) T e m p er at u re ( d e g. C ) 3:28:49(before ignition) 3:29:01 3:29:14(fire detection1) 3:29:28 3:29:43(fire detecion2) 3:30:00 3:30:19 3:30:33 3:30:47 3:31:05 3:31:20(peak) ? T= 20 deg.C
Figure 7.7. Variations of temperatures along linear heat detection system D-1L1 in Test F-7 C
T o
20 = ∆
7.2 Pool Fires Located underneath Vehicle
Three tests with a 0.36 m2 gasoline pool fire located underneath a simulated vehicle (Tests F-2 to F-4) were conducted in the Viger Tunnel. The setup of the fire scenario was the same as used in the laboratory tunnel tests of the project [1, 2]. The fuel pan was placed underneath a simulated vehicle. A 1.5 m wide by 1.2 m high plate, simulating a crashed car, was located between the fire source and the wall-mounted detectors. It was placed 1.5 m in front of the fire source and 0.3 m above the ground. The heat release rate of the fire was approximately 650 kW when measured using a calorimeter. The setup of the fire scenario in the Viger Tunnel is shown in Figure 7.8.
The fire source was at FP #1 in the three tests: 32 m from the detectors mounted on the wall and 4.8 m from the North wall of the tunnel. Three tests with the same fire setup were conducted with the average airflow velocities in the tunnel at 1.3 m/s, 2.0 m/s and 2.4 m/s. The tests were used to study the impact of airflow on the response of the detectors/detection systems to a small fire located underneath a vehicle. The test conditions and results for the pool fire located underneath the vehicle are listed in Table 7.2.
32
RESPONSE TIME OF DETECTORS/DETECTION SYSTEMS D-3F1 (s) FIRE SCENARIO TEST NO PAN SIZE (m) FIRE LOCATION FROM DETECTORS FUEL TYPE HEAT RELEASE RATE (kW WIND SPEED (m/s) D-1L1 (s) D-2L2 (s) H* M* D-4C1 (s) D-5C2 (s) D-6C3 (s) F-3 0.6 x 0.6 32 m in 1st lane Gasoline ~650 ~1.3 48 43 3 33 56 66 13 F-2 0.6 x 0.6 32 m in 1st lane Gasoline ~650 ~2.0 101 96 4 76 88 18 N/R* Pool fires under the vehicle F-4 0.6 x 0.6 32 m in 1st lane Gasoline ~650 ~2.4 N/R* 101 34 N/A 66 38 51 Note:
• N/R*: no response in the test
• H*: optical flame detector D-3F1 with very high sensitivity • M*: optical flame detector D-3F1 with medium sensitivity • The systems listed in the table are as follows:
D-1L1: Linear fiber optic heat detection system D-2L2: Linear cable heat detection system D-3F1: Flame detector
D-4C1: VID flame/smoke detector D-5C2: VID flame/smoke detector D-6C3: VID flame detector
Figure 7.9. Side view of a 0.36 m2 gasoline pool fire located underneath a vehicle
7.2.1 Fire Characteristics
Ambient temperature in the tunnel was 18oC. The fire was allowed to burn freely until the gasoline in the pan was consumed. The fire plume was tilted by the longitudinal airflow. The angle of the fire plume to the ground was reduced with an increase in airflow speed. Moreover, the fire plume became short and unsteady at high airflow speed, as shown in Figure 7.9. The plate placed in front of the fire obstructed the view of the detectors mounted on the wall and partially shielded the flames. Figure 7.10 is a photograph taken from the front of the fire setup.
34
Figure 7.11. Ceiling temperatures at the fire location in Viger Tunnel tests
Figure 7.11 shows the ceiling temperatures in the tests with variation in airflow velocity. The temperatures were measured near the fire source. The ceiling temperatures near the fire had a minimal increase as the fire plume was tilted towards the downstream side of the fire. The temperature decreased with an increase in air velocity. The maximum ceiling temperature ranged from 18oC to 20oC.
Figure 7.12 shows the ceiling temperatures measured 15 m downstream of the fire source. The ceiling temperatures were higher than those near the fire source. The temperature did not change with airflow speed. The maximum ceiling temperature was approximately 25oC. Time (s) 0 50 100 150 200 250 300 350 400 450 Tem p e rat ur e ( o C) 16 17 18 19 20 21 22 1.3 m/s 2 m/s 2.4 m/s Air speed ignition
36
Figure 7.12. Ceiling temperature measured at 15 m downstream of the fire Time (s) 0 50 100 150 200 250 300 350 400 Te mp eratu re ( o C) 14 16 18 20 22 24 26 1.3 m/s 2 m/s 2.4 m/s Air speed ignition
Figure 7.13. Ceiling smoke optical density measured 15 m downstream of the fire
Figure 7.13 shows the variation of the ceiling smoke optical density measured 15 m downstream of the fire source. The smoke optical density measured near the ceiling decreased with an increase in airflow speed. The results also showed that the smoke produced by the fire under airflow conditions was not steady, which was consistent with the visual observations during the tests. The VID systems mounted at the wall of the tunnel were able to monitor the fire conditions in the tunnel throughout the tests.
Time (s) 0 50 100 150 200 250 300 350 400 S m oke Densit y (OD/ m ) 0.00 0.02 0.04 0.06 0.08 0.10 0.12 0.14 1.3 m/s 2 m/s 2.4 m/s Air speed ignition
38
7.2.2 Response of Fire Detection Systems
The response times of fire detectors/detection systems to the fire located underneath a vehicle for tests with three air velocities are summarized in Figure 7.14. Generally, the challenge for the detectors increased under the longitudinal airflow conditions.
The response time of the linear heat detection systems increased with an increase in airflow speed, as the ceiling temperature decreased. The linear heat detection system D-1L1 detected the fire at 48 s and 101 s, respectively, when the air velocities were at 1.3 m/s and 2 m/s. It did not respond to the fire when the air velocity was 2.4 m/s.
Figure 7.15 shows the temperature along the sensing cable of the linear detection system D-1L1 in Test F-2 with an airflow speed of 2 m/s. There were two hot spots measured in the cable: one near the fire source and the other in the section of cable crossing the tunnel at the west end of the loop. (The end of the cable was at the northwest corner of the loop and the cable was installed clockwise with decreasing distance relative to the measurement system.) However, only the temperature measured near the fire source reached the alarm threshold. Figure 7.15 also shows that the hot spot identified by the detection system was not the real fire location. The distance from the fire location was approximately 7 m.
The linear heat detection system D-2L2 responded to all fires. The response times were 43 s at 1.3 m/s, 96 s at 2 m/s and 101 s at 2.4 m/s. The response times increased with an increase in airflow velocity.
The response time of the optical flame detector D-3F1 was delayed with an increase in airflow speed from 33 s at 1.3 m/s to 76 s at 2 m/s.
The response times of the three VID systems to the fire could be delayed or shortened under airflow conditions, as the flames behind the obstacle were unsteady. The response time of the flame/smoke VID system D-4C1 was 56 s at 1.3 m/s and increased to 88 s at 2 m/s and then decreased to 66 s at 2.4 m/s.
The flame/smoke VID system D-5C2 detected the fire with response times of 66 s at 1.3 m/s, 18 s at 2 m/s and 36 s at 2.4 m/s.
The flame VID system D-6C3 did not respond to the fire in the test with an airflow speed of 2 m/s, but detected the fire at 13 s at 1.3 m/s and 51 s at 2.4 m/s.
D e tec ti n g Ti me ( s ) 0 50 100 150 200 1.3 m/s 2.0 m/s 3.4 m/s D-1L1 D-2L2 D-3F1 D-4C1 D-6C3 Detectors/Detection Systems D-5C2 no response Air speed
Figure 7.14. Response times of fire detectors/detection systems to a 0.36 m2 fire located
underneath a vehicle at three air velocities in the tunnel
Fire Detection Test No.2 (ignition time: 01:35:12)
0 10 20 30 40 50 60 2150 2170 2190 2210 2230 2250 2270 2290 2310 Distance (m) T e m p er at u re ( d eg .C ) 1:35:12(before ignition) 1:35:25 1:35:36 1:35:48 1:36:02 1:36:16 1:36:29 1:36:42 1:36:56 1:37:08(fire detection1) 1:37:22 1:37:36 1:37:48 1:38:04 1:38:17 1:38:29(peak) ? T= 12 deg.C Fire Point Wind Direction Wind Direction T C o 12 = ∆
40
Figure 7.16. Photograph of the setup of a pool fire located behind a simulated vehicle
7.3 Open Pool Fires Located behind A Large Vehicle
Two full-scale tests with a gasoline pool fire located behind a simulated vehicle (Tests F-6 and F-8) were conducted in the Viger Tunnel. The fire scenario was setup with a 0.36 m2 gasoline pan fire located behind a large plate. The plate, simulating the front portion of a large van, was 1.2 m wide by 2.4 m high. It was placed 0.3 m above the tunnel floor and 3.5 m in front of the pool fire. It was located between the pool fire and the detectors mounted at the wall of the tunnel. The heat release rate of the fire was approximately 650 kW. The setup of the fire scenario is shown in Figure 7.16.
The fire was placed at positions FP 1 and FP 3. The air velocity in the tunnel was 1.3 m/s. The tests were designed to study the response of the detectors/detection systems to a fire located behind a vehicle under airflow conditions. The test conditions and results are listed in Table 7.3.
RESPONSE TIME OF DETECTORS/DETECTION SYSTEMS D-3F1 (s) FIRE SCENARIO TEST NO PAN SIZE (m) FIRE LOCATION FROM DETECTORS FUEL TYPE HEAT RELEASE RATE (kW WIND SPEED (m/s) D-1L1 (s) D-2L2 (s) H* M* D-4C1 (s) D-5C2 (s) D-6C3 (s) F-6 0.6 x 0.6 32 m in 1st lane Gasoline ~650 ~1.3 30 29 N/A 25 47 24 6 Pool fires behind vehicle F-8 0.6 x 0.6 60 m in 1st lane Gasoline ~650 ~1.3 32 31 12 N/R N/R N/R* 18 Note:
• N/R*: no response in the test
• H*: optical flame detector D-3F1 with very high sensitivity • M*: optical flame detector D-3F1 with medium sensitivity • The systems listed in the table are as follows:
D-1L1: Linear fiber optic heat detection system D-2L2: Linear cable heat detection system D-3F1: Flame detector
D-4C1: VID flame/smoke detector D-5C2: VID flame/smoke detector D-6C3: VID flame detector
42
Figure 7.17. Photograph of a pool fire located behind a simulated vehicle in Viger Tunnel
7.3.1 Fire Characteristics
The gasoline pool fire located behind the vehicle was an open pool fire. It developed very quickly. A large fire plume and significant smoke were produced. The fire plume and smoke were pushed downstream of the fire by the longitudinal airflow, as shown in Figure 7.17. The fire plume and smoke production were much larger than those produced by the fire underneath a vehicle with the same size of pool fire. It was difficult to view the flames from the front of the fire, as the large plate shielded the flames.
Figures 7.18 and 7.19 show photographs taken from the front and back of the fire setup, when the fire was located at 32 m and 60 m from the detectors. Although the fires behind the plate were large, the flames were only partially visible at the sides of the plate. However, the smoke produced from the fires was visible in the tunnel and was not affected by the obstacle. Figures 7.18 and 7.19 also show that the amount of flame visible at the two locations was comparable and were not affected by the change in fire location.
Figure 7.18. Photographs of a pool fire located behind a simulated vehicle taken from front and back of the fire setup with the fire was located at 32 m from the detectors
44
Figure 7.20. Temperatures measured at Thermocouple #1 at fire location in Test F-6
Figure 7.20 shows the temperatures measured in Test F-6. The temperatures were measured at thermocouple tree #1 near the fire source. The temperature near the tip of the fire plume was approximately 85oC. The temperature decreased with an increase in height. The maximum temperature increase near the ceiling of the tunnel was 7oC approximately 50 s after ignition (rate of rise of about 8.5oC/min).
Figure 7.21 shows the ceiling temperature measured at three distances from the fire source in Test F-6. The temperatures measured 15 m and 30 m downstream of the fire were higher than that measured at the fire location (about 15.6 and 10.8oC/min at 15 and 30 m downstream of fire, respectively). The rate of temperature rise was also faster than that at the fire location. The ceiling temperature produced by the fire located behind the vehicle was higher than that produced by the fire located underneath the vehicle under the same airflow conditions.
Time (s) 0 50 100 150 200 250 300 350 Te m p er atu re ( o C) 10 20 30 40 50 60 70 80 90 2 m 3 m 4 m 5 m Elevation from ground
Figure 7.21. Ceiling temperatures at three distances from the fire in Test F-6 Time (s) 0 50 100 150 200 250 300 350 Tem per at ur e ( o C) 14 16 18 20 22 24 26 28 30 32 0 15 m 30 m distance from fire location
46 Figure 7.22 shows the smoke optical density measured 15 m and 30 m from the fire source in Test F-6. The smoke optical densities quickly increased. The smoke optical densities measured at the two locations were comparable. However, the smoke optical density 15 m from the fire was slightly higher than that at 30 m from the fire. The smoke optical density produced by the fire behind a vehicle was higher than that produced by the fire located underneath a vehicle under the same test conditions.
The view of VID systems was affected at 120 s after ignition in Test F-6 in which the fire was 32 m from the detectors. The view of the VID systems was obscured at 90 s after ignition in Test F-8 in which the fire was 60 m from the detectors.
Time (s) 0 50 100 150 200 250 300 350 S m oke De n s it y (OD/ m ) 0.00 0.05 0.10 0.15 0.20 0.25 0.30 0.35 15 m 30 m Distance from fire source
ignition
7.3.2 Response of Fire Detection Systems
The response times of the fire detector/detection systems to a 0.36 m2 fire located behind a vehicle are summarized in Figure 7.23. The response times of the two linear heat detection systems were not affected by the change in fire locations. The performance of the flame detector D-3F1 and the three VID systems were affected by the change in fire location.
The linear heat detection system D-1L1 responded to the fires at 30 s and 32 s when the fire was located 32 m and 60 m from the wall mounted detectors, respectively.
The linear heat detection system D-2L2 detected the fires at 29 s and 31 s when the fire was located 32 m and 60 m from the wall mounted detector, respectively.
The optical flame detector D-3F1 detected the fire at 25 s when the fire was located 32 m from the detector. It did not respond to the fire when it was located 60 m from the detector, since the distance was greater than its maximum detection distance.
The flame/smoke VID system D-4C1 responded to the fire at 47 s when the fire was located 32 m from the detector. It did not respond to the fire when it was located 60 m from the detector.
The flame/smoke VID system D-5C2 detected the fire at 24 s when the fire was located 32 m from the detector. It did not respond to the fire when it was located 60 m from the detector.
The flame VID system D-6C3 responded to the fires at 6 s when the fire was 32 m from the detector and 18 s when the fire was 60 m from the detector.
48
Figure 7.23. Response times of fire detectors/detection systems to a 0.36 m2 fire located behind
the vehicle at two locations
De te c ti n g Ti me ( s ) 0 50 100 150 200 30 m 60 m D-1L1 D-2L2 D-3F1 D-4C1 D-6C3 Detectors/Detection Systems D-5C2 no response
8. SUMMARY
The performance of the fire detectors/detection systems was investigated in a series of fire tests conducted in an operating tunnel in Montreal, Canada. The tests investigated the response of fire detectors/detection systems to the fire scenarios in an operating tunnel environment at their maximum detection range. The results were also compared to those obtained in tests conducted in the laboratory tunnel facility.
The fire scenarios used in the tests included a small gasoline pool fire, a gasoline pool fire located underneath a simulated vehicle, and a gasoline pool fires located behind a large vehicle. Four airflow velocities were used in the tests: 0 m/s, 1.3 m/s, 2 m/s and 2.4 m/s. The fire size varied from 125 kW to 650 kW.
The tests were field tests only, and variations were made to the type of fire, tunnel air velocity, distance between the fires and detector locations, and fire sizes, within any set of tests. Therefore, it was not intended that individual detector performance (response time) could be directly linked to any of these variable test parameters in such a limited test program. Replicates of test were not undertaken. Therefore conclusions are limited to general observations of performance. The tests conducted in the laboratory tunnel in Tasks 2 and 7 [1-2] provide a more detailed analysis of the impacts of fire types and airflow velocity on detector response.
The fire characteristics, including temperatures and smoke spread in the tunnel, were measured in the tests. The activation time of each detector/detection system under various ventilation conditions was recorded. The ability of the detection systems to locate and monitor the fire was also evaluated. General observations on the performance of fire detectors/detection systems in test series are as follows:
• The performances of the fire detection systems were generally consistent with those observed in the laboratory tunnel tests under the same test conditions. • The pool fires located underneath a vehicle were more difficult to detect than
the fires located behind a vehicle. The response times of fire detection systems for the fire located underneath a vehicle were generally longer than those for the fire located behind a vehicle.
Observations on the response of the linear heat detection systems are as follows: • The linear heat detection systems were able to respond to small fires based on
the rate of rise of temperature, even though the ceiling temperature was not high. The response time of the linear detection system D-1L1 to a small open pool fire (125 kW) ranged from 22 s to 33 s, and the response time of the
50 • The response times of the linear heat detection systems were not affected by
fire location in the tunnel, as the fires were always near a section of the cable. The detection times increased with an increase in airflow speed as the ceiling temperature decreased.
• The linear heat detection system D-1L1 was able to determine the fire location to within 2 m range but the hot spot identified by the system under longitudinal airflow conditions was not the real fire location.
Observations on the response of the optical flame detector D-3F1 are as follows: • The optical flame detector D-3F1 was able to detect all fires within its
detection range. The detection time ranged from 25 s to 76 s in the test series, depending on the fire scenario, fire size and airflow conditions.
• The detector did not respond to the fire, when it was located beyond its maximum detection distance (~30 m).
• Its performance was affected by an increase in airflow speed.
Observations on the response of the three VID systems are as follows:
• The three VID systems were able to detect the small open fires (125 kW) at their maximum detection range (~60 m). The change in location of the small open fire in the tunnel had a limited impact on the performance of Detectors D-4C1 and D-6C3, but had a substantial impact on the performance of D-5C2. • The performance of the three VID systems was affected by longitudinal
airflow conditions. Both D-4C1 and D-5C2 were able to detect the fire located underneath a vehicle at the three airflow speeds. The response time was either decreased or increased depending on the airflow velocity.
• The airflow conditions made it more difficult for D-6C3 to respond to the fire. It detected the fire in the tests with an airflow speed of 1.3 m/s and 2.4 m/s but did not respond to the fire at an airflow speed of 2 m/s.
• Both D-4C1 and D-5C2 were able to detect the fire located behind the vehicle when the fire was 32 m from the detectors, but did not respond to the fire when it was 60 m from the detectors.
• D-6C3 detected the fire at both locations but the response time increased with an increase in distance.
9. REFERENCES
1. Z. G. Liu, G. P. Crampton, A. H. Kashef, G. D. Lougheed, E. Gibbs, and S. Muradori “ International Road Tunnel Fire Detection Research Project – Phase II: Task 2, Full-scale Fire Tests in a Laboratory Tunnel for Study of Tunnel Fire Detection Technologies,” NRCC Client Report (B-4179.2), November 2007 2. Z. G. Liu, G. P. Crampton, A. H. Kashef, G. D. Lougheed, E. Gibbs, and S.
Muradori “ International Road Tunnel Fire Detection Research Project – Phase II: Task 7, Effect of Naturally Longitudinal Ventilation on Performance of Fire Detectors/Detection Systems for Road Tunnel Protection,” NRCC Client Report (B-4179.3), February 2008