Publisher’s version / Version de l'éditeur:
Molecular Biology of the Cell, 19, 7, pp. 2741-2751, 2008-04-23
READ THESE TERMS AND CONDITIONS CAREFULLY BEFORE USING THIS WEBSITE.
https://nrc-publications.canada.ca/eng/copyright
Vous avez des questions? Nous pouvons vous aider. Pour communiquer directement avec un auteur, consultez la
première page de la revue dans laquelle son article a été publié afin de trouver ses coordonnées. Si vous n’arrivez
pas à les repérer, communiquez avec nous à PublicationsArchive-ArchivesPublications@nrc-cnrc.gc.ca.
Questions? Contact the NRC Publications Archive team at
PublicationsArchive-ArchivesPublications@nrc-cnrc.gc.ca. If you wish to email the authors directly, please see the
first page of the publication for their contact information.
NRC Publications Archive
Archives des publications du CNRC
This publication could be one of several versions: author’s original, accepted manuscript or the publisher’s version. /
La version de cette publication peut être l’une des suivantes : la version prépublication de l’auteur, la version
acceptée du manuscrit ou la version de l’éditeur.
For the publisher’s version, please access the DOI link below./ Pour consulter la version de l’éditeur, utilisez le lien
DOI ci-dessous.
https://doi.org/10.1091/mbc.E08-02-0191
Access and use of this website and the material on it are subject to the Terms and Conditions set forth at
Regulation of the Candida albicans Cell Wall Damage Response by
Transcription Factor Sko1 and PAS Kinase Psk1
Rauceo, Jason M.; Blankenship, Jill R.; Fanning, Saranna; Hamaker, Jessica
J.; Deneault, Jean-Sebastien; Smith, Frank J.; Nantel, Andre; Mitchell, Aaron
P.
https://publications-cnrc.canada.ca/fra/droits
L’accès à ce site Web et l’utilisation de son contenu sont assujettis aux conditions présentées dans le site
LISEZ CES CONDITIONS ATTENTIVEMENT AVANT D’UTILISER CE SITE WEB.
NRC Publications Record / Notice d'Archives des publications de CNRC:
https://nrc-publications.canada.ca/eng/view/object/?id=391520f8-a15f-41cc-9a2e-b0e7ce91a054
https://publications-cnrc.canada.ca/fra/voir/objet/?id=391520f8-a15f-41cc-9a2e-b0e7ce91a054
Vol. 19, 2741–2751, July 2008
Regulation of the
Candida albicans Cell Wall Damage
Response by Transcription Factor Sko1 and PAS Kinase
Psk1
Jason M. Rauceo,* Jill R. Blankenship,* Saranna Fanning,* Jessica J. Hamaker,*
Jean-Sebastien Deneault,
†
Frank J. Smith,* Andre Nantel,
†
and Aaron P. Mitchell*
*Department of Microbiology and Institute of Cancer Research, Columbia University, New York, NY 10032;
and
†Biotechnology Research Institute, National Research Council of Canada, Montreal, QC H4P 2R2, Canada
Submitted February 21, 2008; Revised April 7, 2008; Accepted April 16, 2008
Monitoring Editor: Kerry Bloom
The environmental niche of each fungus places distinct functional demands on the cell wall. Hence cell wall regulatory
pathways may be highly divergent. We have pursued this hypothesis through analysis of
Candida albicans transcription
factor mutants that are hypersensitive to caspofungin, an inhibitor of beta-1,3-glucan synthase. We report here that
mutations in
SKO1 cause this phenotype. C. albicans Sko1 undergoes Hog1-dependent phosphorylation after osmotic
stress, like its
Saccharomyces cerevisiae orthologues, thus arguing that this Hog1-Sko1 relationship is conserved. However,
Sko1 has a distinct role in the response to cell wall inhibition because 1)
sko1 mutants are much more sensitive to
caspofungin than
hog1 mutants; 2) Sko1 does not undergo detectable phosphorylation in response to caspofungin; 3)
SKO1 transcript levels are induced by caspofungin in both wild-type and hog1 mutant strains; and 4) sko1 mutants are
defective in expression of caspofungin-inducible genes that are not induced by osmotic stress. Upstream Sko1 regulators
were identified from a panel of caspofungin-hypersensitive protein kinase– defective mutants. Our results show that
protein kinase Psk1 is required for expression of
SKO1 and of Sko1-dependent genes in response to caspofungin. Thus
Psk1 and Sko1 lie in a newly described signal transduction pathway.
INTRODUCTION
The fungal cell wall is critical for interaction with the
envi-ronment and survival. It is the point of contact between the
fungus and target surfaces, and processes such as adhesion,
dimorphism, and biofilm formation are dependent on a
dynamic cell wall (Nobile and Mitchell, 2005; Lesage and
Bussey, 2006; Ruiz-Herrera et al., 2006; Dranginis et al., 2007).
These processes all contribute to the pathogenicity of
Can-dida albicans, the major fungal pathogen of humans. This
organism causes superficial, mucosal, and potentially fatal
invasive infections (Rangel-Frausto et al., 1999; Rabkin et al.,
2000). As a fungal-specific structure, the cell wall is also of
interest as a mediator of immunological recognition and
evasion (Wheeler and Fink, 2006) and in addition as a target
of antifungal drugs such as caspofungin (Letscher-Bru and
Herbrecht, 2003). Our interest is in the signaling pathways
that govern C. albicans cell wall dynamics.
Caspofungin inhibits beta-glucan synthesis to cause cell
lysis (Letscher-Bru and Herbrecht, 2003). Caspofungin
treat-ment elicits a broad transcriptional response in the baker’s
yeast Saccharomyces cerevisiae and in C. albicans
(Reinoso-Martin et al., 2003; Liu et al., 2005; Bruno et al., 2006). The S.
cerevisiae response is controlled in part by the
mitogen-activated protein kinase (MAPK) signaling cascade known
as the protein kinase C (PKC) cell wall integrity pathway
(Reinoso-Martin et al., 2003; Levin, 2005; Liu et al., 2005;
Bruno et al., 2006). This MAPK pathway is conserved in C.
albicans, where it also governs cell wall integrity
(Navarro-Garcia et al., 1998; Reinoso-Martin et al., 2003). However,
there is increasing evidence that the C. albicans response to
caspofungin has unique features as well. For example, the C.
albicans response includes induction of numerous secretory
genes (Bruno et al., 2006), a gene class that is largely
nonre-sponsive in S. cerevisiae. Even more striking is the fact that a
major mediator of the C. albicans response, transcription
factor Cas5, lacks an S. cerevisiae orthologues (Bruno et al.,
2006). Cas5 is required for induction of genes mainly
in-volved in cell wall biogenesis. Those genes account for a
small fraction of caspofungin-responsive genes.
In this study we use a genetic screen to identify new C.
albicans transcription factors involved in cell wall damage
signaling. We also employ a new resource, a set of
caspo-fungin-sensitive protein kinase mutants (Blankenship,
Fan-ning, Hamaker, and Mitchell, unpublished data), to search
for upstream signaling components. We uncover a novel cell
wall regulatory pathway that includes the transcription
fac-tor Sko1 (ORF 19.1032) and the protein kinase Psk1 (ORF
19.7451). In S. cerevisiae both ScSko1 and the proteins ScPsk1
and ScPSk2 have been characterized. ScSko1 mediates the
adaptive response to osmotic stress via the high-osmolarity
glycerol (HOG) pathway. ScSko1 is activated through
phos-phorylation by the MAP kinase ScHog1 and functions as a
activator and repressor of osmotic stress–responsive genes
(Proft et al., 2001; Proft and Struhl, 2002). ScSko1 function
has not been characterized in the response to cell wall
dam-age. Gene expression studies implicate C. albicans Sko1 in the
osmotic stress response (Enjalbert et al., 2006), but no sko1
This article was published online ahead of print in MBC in Press
(http://www.molbiolcell.org/cgi/doi/10.1091/mbc.E08 – 02– 0191)
on April 23, 2008.
mutant defect has been reported previously (Braun et al.,
2001). ScPsk1/2 regulates glucose partitioning for either
glu-can or glycogen synthesis, and Scpsk1 Scpsk2 double mutants
are sensitive to cell wall damage (Smith and Rutter, 2007).
The sole C. albicans orthologue Psk1 has not been
character-ized previously. Our findings define a new regulatory
path-way that governs a critical aspect of C. albicans growth and
survival.
MATERIALS AND METHODS
Media and Growth Conditions
C. albicans cultures were prepared in YPD plus uridine (2% dextrose, 2% bacto peptone, 1% yeast extract, and 80 mg/l uridine) at 30°C with shaking at 200 rpm. Synthetic medium (2% dextrose, 6.7% yeast nitrogen base [YNB] plus ammonium sulfate, and the necessary auxotrophic supplements) was used for selection after transformations. In assays monitoring cell wall damage, cells were plated to YPD ⫹ uridine supplemented with 125 ng/ml caspofungin (Merck, Rahway, NJ).
Plasmid Construction
All primers used in this study are listed in Table 1. The SKO1 complementing plasmid (pRM03) was constructed as follows: Primers SKO1compfwd and SKO1comprev were used to amplify a 2.4-kb fragment containing 993 bp of promoter, the entire open reading frame (ORF), and 220 bp of the 3⬘UTR. The recently discovered 109 base pairs of intron sequence in the 5⬘UTR is included the 2.4-kb fragment. The amplicon was ligated to the pGEMT-Easy vector (Promega, Madison, WI) to create pGEMTE-SKO1 and amplified in Escherichia coli. Purified pGEMTE-SKO1 was digested with NgoMIV and AlwNI and inserted through in vivo recombination in S. cerevisiae into a NotI- and EcoRI-digested pDDB78 (Spreghini et al., 2003). The cloned SKO1 insert was verified by DNA sequencing.
The HOG1 complementing plasmid (pRM04) was constructed as follows: Primers HOG1compfwd and HOG1deldet were used to amplify a 2.3-kb fragment containing 1 kb of promoter, the entire ORF, and 189 bp of the 3⬘UTR. The amplicon was ligated to pGEMT–Easy (pGEMTE-HOG1) and inserted into pDDB78 as described above to generate pRM04.
Construction of a SKO1-V5 epitope-tagged plasmid (pRM05) was per-formed as follows: Primers SKO1compfwd and SKO1orfrev were used to generate a fragment containing 993 bp of promoter and the entire ORF without the stop codon. The amplicon was inserted into the pYES2.1/V5-His-TOPO vector (Invitrogen, Carlsbad, CA) to create pYES-SKO1-V5. PCR amplification using primers SKO1-V5 fwdpr and CAS5-V5 78 3⬘ with pYES-SKO1-V5 as a template was done to amplify a fragment containing the V5 epitope tag, His 6x tag, stop codon, and 209 bp of the CYC1 terminator region. This fragment was inserted into linearized pDDB78 as described above.
The PSK1-complementing plasmid (pRM06) was constructed as follows: Primers PSK1compfwd and PSK1comprev were used to generate a 5.3-kb fragment consisting of 965 bp of promoter region, the entire ORF, and 385 bp of the 3⬘UTR. This fragment was ligated into pGEMT-easy to create pGEMTE-PSK1 and amplified in E. coli. Purified pGEMTE-pGEMTE-PSK1 was digested with NgoMIV and SapI and inserted through in vivo recombination in S. cerevisiae into a NotI- and EcoRI-digested pRYS2.
Yeast Strains and Transformation Procedures
C. albicans strains used in this study are listed in Table 2. All strains were derived from strain BWP17 (genotype: ura3⌬::imm434/ura3⌬::imm434 his1::hisG/his1::hisG arg4::hisg/arg4::hisG; Wilson et al., 1999). Strain JMR103, the sko1⌬::ARG4/sko1⌬::URA3 mutant was generated by PCR-directed gene deletion using 120mer oligonucleotides SKO1del5⬘dr and SKO1del3⬘dr, re-spectively, to delete the entire ORF (Wilson et al., 1999). The SKO1-comple-mented strain (JMR109) was generated by transforming JMR103 with NruI-digested pRM03 to direct integration to the HIS1 locus. JMR103 was brought to His prototrophy through transformation with NruI-digested pDDB78 to create strain JMR104. Strain JMR114, the hog1⌬::ARG4/hog1⌬::URA3 mutant, was generated using primers HOG1del5⬘dr and HOG1del3⬘dr as described
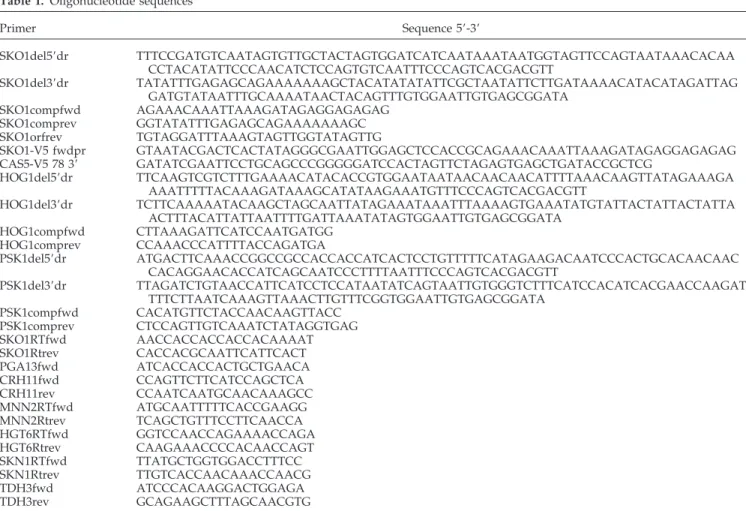
Table 1.
Oligonucleotide sequences
Primer
Sequence 5⬘-3⬘
SKO1del5⬘dr
TTTCCGATGTCAATAGTGTTGCTACTAGTGGATCATCAATAAATAATGGTAGTTCCAGTAATAAACACAA
CCTACATATTCCCAACATCTCCAGTGTCAATTTCCCAGTCACGACGTT
SKO1del3⬘dr
TATATTTGAGAGCAGAAAAAAAGCTACATATATATTCGCTAATATTCTTGATAAAACATACATAGATTAG
GATGTATAATTTGCAAAATAACTACAGTTTGTGGAATTGTGAGCGGATA
SKO1compfwd
AGAAACAAATTAAAGATAGAGGAGAGAG
SKO1comprev
GGTATATTTGAGAGCAGAAAAAAAGC
SKO1orfrev
TGTAGGATTTAAAGTAGTTGGTATAGTTG
SKO1-V5 fwdpr
GTAATACGACTCACTATAGGGCGAATTGGAGCTCCACCGCAGAAACAAATTAAAGATAGAGGAGAGAG
CAS5-V5 78 3⬘
GATATCGAATTCCTGCAGCCCGGGGGATCCACTAGTTCTAGAGTGAGCTGATACCGCTCG
HOG1del5⬘dr
TTCAAGTCGTCTTTGAAAACATACACCGTGGAATAATAACAACAACATTTTAAACAAGTTATAGAAAGA
AAATTTTTACAAAGATAAAGCATATAAGAAATGTTTCCCAGTCACGACGTT
HOG1del3⬘dr
TCTTCAAAAATACAAGCTAGCAATTATAGAAATAAATTTAAAAGTGAAATATGTATTACTATTACTATTA
ACTTTACATTATTAATTTTGATTAAATATAGTGGAATTGTGAGCGGATA
HOG1compfwd
CTTAAAGATTCATCCAATGATGG
HOG1comprev
CCAAACCCATTTTACCAGATGA
PSK1del5⬘dr
ATGACTTCAAACCGGCCGCCACCACCATCACTCCTGTTTTTCATAGAAGACAATCCCACTGCACAACAAC
CACAGGAACACCATCAGCAATCCCTTTTAATTTCCCAGTCACGACGTT
PSK1del3⬘dr
TTAGATCTGTAACCATTCATCCTCCATAATATCAGTAATTGTGGGTCTTTCATCCACATCACGAACCAAGAT
TTTCTTAATCAAAGTTAAACTTGTTTCGGTGGAATTGTGAGCGGATA
PSK1compfwd
CACATGTTCTACCAACAAGTTACC
PSK1comprev
CTCCAGTTGTCAAATCTATAGGTGAG
SKO1RTfwd
AACCACCACCACCACAAAAT
SKO1Rtrev
CACCACGCAATTCATTCACT
PGA13fwd
ATCACCACCACTGCTGAACA
CRH11fwd
CCAGTTCTTCATCCAGCTCA
CRH11rev
CCAATCAATGCAACAAAGCC
MNN2RTfwd
ATGCAATTTTTCACCGAAGG
MNN2Rtrev
TCAGCTGTTTCCTTCAACCA
HGT6RTfwd
GGTCCAACCAGAAAACCAGA
HGT6Rtrev
CAAGAAACCCCACAACCAGT
SKN1RTfwd
TTATGCTGGTGGACCTTTCC
SKN1Rtrev
TTGTCACCAACAAACCAACG
TDH3fwd
ATCCCACAAGGACTGGAGA
TDH3rev
GCAGAAGCTTTAGCAACGTG
above. JMR114 was also brought to His prototrophy through transformation with NruI-digested pDDB78 to create strain JMR121. The HOG1-comple-mented strain (JMR123) was constructed as described above. Strain JMR167, the psk1⌬::ARG4/psk1⌬::URA3 mutant was generated using prim-ers PSK1del5⬘dr and PSK1del3⬘dr as described above. JMR167 was brought to His prototrophy through transformation with SrfI-digested pRYS2 to create strain JMR192. The PSK1-complemented strain (JMR188) was constructed as described above. SKO1-V5 epitope-tagged strains were generated through transformation of NruI-digested pRM05 as described above. Candidate genes related to the transcription process were described previously (Nobile and Mitchell, 2005). Construction of the insertion mu-tant strains followed previously described procedures (Davis et al., 2002; Norice et al., 2007).
Cell Wall Susceptibility Assays
Assays followed previously described procedures (Bruno et al., 2006). Briefly, C. albicans overnight cultures were diluted to a starting OD600 nmof 3.0.
Samples were serially diluted, spotted onto designated plates, incubated at 30°C, and photographed after 1–3 d of growth.
RNA Isolation and Real-Time PCR Analysis
Overnight cultures of designated C. albicans strains were diluted to a starting OD600nmof 0.200 in 100 ml fresh YPD ⫹ uridine media. The cultures were
incubated with shaking at 30°C to an OD600 nmof 1.0 and spilt into two 50-ml
cultures. A total of 125 ng of caspofungin was added to the experimental culture, and dH2O was added to the control culture. The cultures were
incubated for 30 – 60 min. Cells were harvested by vacuum filtration and stored at ⫺80°C. For kinetic assays a starter culture of 400 ml was prepared as described above, and after caspofungin treatment, 50-ml samples were col-lected at each designated time point. Total RNA was isolated using the hot acid phenol method (Nobile and Mitchell, 2005). RNA yield and purity levels were determined spectrophotometrically, and 5 g of RNA was DNase di-gested (RQ1 DNase, Promega; or DNaseI, Ambion, Austin, TX). cDNA was synthesized using the Stratascript first strand synthesis kit (Stratagene, La-Jolla, CA). As a control for DNA contamination each sample was treated without reverse transcriptase. Primers are listed in Table 1 and were designed using primer 3 input software (http://frodo.wi.mit.edu/cgi-bin/primer3/ primer3_www.cgi). PCR efficiency (E) was determined for all primers through amplification of C. albicans genomic DNA. Primer pairs yielding E-values between 99 and 103% were used in subsequent real-time (RT) experiments. RT reactions were prepared in triplicate using iQ SYBR supermix (Bio-Rad), and RT-PCR was performed using the Bio-Rad I Cycler thermocycler equipped with an iQ5 multicolor optical unit (Bio-Rad, Richmond, CA), with a program of 95°C for 5 min and then 40 cycles of 95°C for 45 s, followed by 58°C for 1 min. Melt curve analysis confirmed the specificity of the amplification products. Data analysis was conducted using the Bio-Rad iQ5 standard edition optical system software V2.0. Transcript levels were normalized against TDH3 (which encodes glycer-aldehyde-3-phosphate dehydrogenase) expression, and gene expression changes were calculated by the ⌬⌬CTmethod (Kubista et al., 2006). Target
gene fold changes for treated or untreated cells were determined by comparison to the wild-type (wt) strain. Significant differences between groups were determined in unpaired t tests (http://graphpad.com/quick-calcs/ttest1.cfm?Format⫽SD) with a p value of ⬍ 0.05 considered to be statistically significant.
Microarray Analysis
Cultures of designated C. albicans strains were prepared as described above. Cultures were incubated in the presence of caspofungin for 30 min before harvesting by vacuum filtration. Cells were resuspended in 1.5 ml of ice-cold RNA later (Sigma, St. Louis, MO) to prevent RNA degradation and pelleted. Total RNA was extracted and was DNase treated using the Ribopure yeast kit (Ambion) following manufacturer’s instructions. We performed two hybrid-izations that measured the effects of drug treatment on wt cells, and six hybridizations that compared transcripts from drug-treated mutant cells with drug-treated wt cells. All RNA samples were produced from independent cultures. Transcriptional profiling was performed as previously described (Nantel et al., 2006), and the resulting data were normalized and analyzed in GeneSpring GX version 7.3 (Agilent Technologies, Wilmington, DE). The results of this analysis are listed in Supplementary Dataset 1, which includes significantly modulated genes that exhibited a statistically significant (t test; p ⬍ 0.05) change in transcript abundance of at least 1.5-fold. Gene annotations were determined using the gene ontology term-finder tool for “process” from the Candida Genome Database Web page (http://www.candidagenome.org/ cgi-bin/GO/goTermFinder).
Protein Extraction and In Vivo Sko1 Phosphorylation
Assays
C. albicans overnight cultures were collected and diluted to a starting OD600 nmof 0.200 in 100 ml fresh YPD ⫹ uridine media. The cultures were incubated
with shaking at 30°C to an OD600 nmof 1.0 and spilt into two 50-ml cultures.
The experimental culture was incubated with1.5 M NaCl for 10 min to induce osmotic shock, and the control culture was treated with dH2O. For
experi-ments monitoring cell wall damage, the experimental culture was incubated for 1 h with 125 ng caspofungin, and dH2O was added to the control culture.
For kinetic assays a 400-ml starter culture was prepared as described above, and after caspofungin treatment, 50-ml samples were collected at each des-ignated time point. Cells were harvested by vacuum filtration, resuspended in ice cold 20% TCA, and incubated on ice for 30 min. The cells were pelleted at 14,000 rpm for 20 min. A solution of alkaline-buffered acetone was prepared by mixing three parts of 3 M Tris, pH 8.8, to seven parts acetone and was used to wash the pellet twice. The pellet was air-dried and resuspended in 8 M urea. Approximately 100 l of acid-washed glass beads was added to the cell suspension, and the cells were lysed in a bullet blender (Next Advance, Averill Park, NY). The lysate was pelleted and supernatant was collected. Protein concentration was determined using the Bradford protein assay (Bio-Rad). Cellular lysates were treated with or without calf intestinal phosphatase (New England Biolabs, Beverly, MA) in the presence or absence of phosphatase inhibitors (Sigma). Fifteen micrograms of sample was electrophoresed on 8% SDS polyacrylamide gels, transferred onto PVDF membranes, and stained with Pon-ceau dye to ensure equal sample loading. Sko1-V5 was probed and detected on immunoblots using anti-V5 monoclonal antibodies conjugated to horseradish peroxidase (Invitrogen) at a 1:2500 dilution and the ECL plus Western blotting chemiluminescent detection system (Amersham, Piscataway, NJ), respectively.
RESULTS
Identification of Caspofungin-hypersensitive Transcription
Factor Mutants
To find regulators of the cell wall damage response, we
attempted to create homozygous insertion mutants for 67
genes that were related to the transcription process (Table 3).
Table 2.
Yeast strains used in this study
Strain
Genotype
Reference
DAY286
ura3⌬::imm434/ura3⌬::imm434, ARG4::URA3::arg4::hisG/ arg4::hisG, his1::hisG /his1::hisG
Davis et al. (2002)
DAY185
ura3⌬::imm434/ura3⌬::imm434, ARG4::URA3::arg4::hisG/ arg4::hisG, his1::hisG::pHIS1 /his1::hisG
Davis et al. (2002)
JMR104
ura3⌬::imm434/ura3⌬::imm434, arg4::hisG/ arg4::hisG, his1::hisG::pHIS1/his1::hisG,
sko1::ARG4/ sko1::URA3
This study
JMR109
ura3⌬::imm434/ura3⌬::imm434, arg4::hisG/ arg4::hisG, his1::hisG::pHIS1::SKO1/his1::hisG,
sko1::ARG4/ sko1::URA3
This study
JMR121
ura3⌬::imm434/ura3⌬::imm434, arg4::hisG/ arg4::hisG, his1::hisG::pHIS1/his1::hisG,
hog1::ARG4/ hog1::URA3
This study
JMR123
ura3⌬::imm434/ura3⌬::imm434, arg4::hisG/ arg4::hisG, his1::hisG::pHIS1::HOG1/his1::hisG,
hog1::ARG4/ hog1::URA3
This study
JMR188
ura3⌬::imm434/ura3⌬::imm434, arg4::hisG/ arg4::hisG, his1::hisG::pHIS1::PSK1/his1::hisG,
psk1::ARG4/ psk1::URA3
This study
JMR192
ura3⌬::imm434/ura3⌬::imm434, arg4::hisG/ arg4::hisG, his1::hisG::pHIS1/his1::hisG,
psk1::ARG4/ psk1::URA3
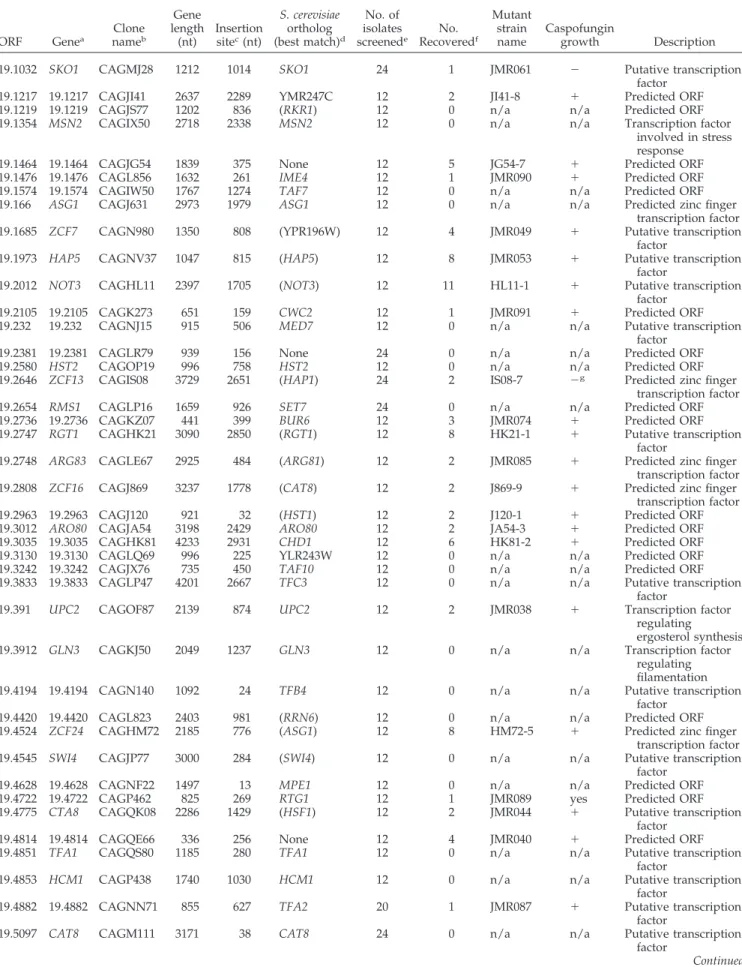
Table 3.
C. albicans insertion mutant summary
ORF
Gene
aClone
name
bGene
length
(nt)
Insertion
site
c(nt)
S. cerevisiae
ortholog
(best match)
dNo. of
isolates
screened
eNo.
Recovered
fMutant
strain
name
Caspofungin
growth
Description
19.1032 SKO1
CAGMJ28
1212
1014
SKO1
24
1
JMR061
⫺
Putative transcription
factor
19.1217 19.1217 CAGJI41
2637
2289
YMR247C
12
2
JI41-8
⫹
Predicted ORF
19.1219 19.1219 CAGJS77
1202
836
(RKR1)
12
0
n/a
n/a
Predicted ORF
19.1354 MSN2
CAGIX50
2718
2338
MSN2
12
0
n/a
n/a
Transcription factor
involved in stress
response
19.1464 19.1464 CAGJG54
1839
375
None
12
5
JG54-7
⫹
Predicted ORF
19.1476 19.1476 CAGL856
1632
261
IME4
12
1
JMR090
⫹
Predicted ORF
19.1574 19.1574 CAGIW50
1767
1274
TAF7
12
0
n/a
n/a
Predicted ORF
19.166
ASG1
CAGJ631
2973
1979
ASG1
12
0
n/a
n/a
Predicted zinc finger
transcription factor
19.1685 ZCF7
CAGN980
1350
808
(YPR196W)
12
4
JMR049
⫹
Putative transcription
factor
19.1973 HAP5
CAGNV37
1047
815
(HAP5)
12
8
JMR053
⫹
Putative transcription
factor
19.2012 NOT3
CAGHL11
2397
1705
(NOT3)
12
11
HL11-1
⫹
Putative transcription
factor
19.2105 19.2105 CAGK273
651
159
CWC2
12
1
JMR091
⫹
Predicted ORF
19.232
19.232
CAGNJ15
915
506
MED7
12
0
n/a
n/a
Putative transcription
factor
19.2381 19.2381 CAGLR79
939
156
None
24
0
n/a
n/a
Predicted ORF
19.2580 HST2
CAGOP19
996
758
HST2
12
0
n/a
n/a
Predicted ORF
19.2646 ZCF13
CAGIS08
3729
2651
(HAP1)
24
2
IS08-7
⫺
gPredicted zinc finger
transcription factor
19.2654 RMS1
CAGLP16
1659
926
SET7
24
0
n/a
n/a
Predicted ORF
19.2736 19.2736 CAGKZ07
441
399
BUR6
12
3
JMR074
⫹
Predicted ORF
19.2747 RGT1
CAGHK21
3090
2850
(RGT1)
12
8
HK21-1
⫹
Putative transcription
factor
19.2748 ARG83
CAGLE67
2925
484
(ARG81)
12
2
JMR085
⫹
Predicted zinc finger
transcription factor
19.2808 ZCF16
CAGJ869
3237
1778
(CAT8)
12
2
J869-9
⫹
Predicted zinc finger
transcription factor
19.2963 19.2963 CAGJ120
921
32
(HST1)
12
2
J120-1
⫹
Predicted ORF
19.3012 ARO80
CAGJA54
3198
2429
ARO80
12
2
JA54-3
⫹
Predicted ORF
19.3035 19.3035 CAGHK81
4233
2931
CHD1
12
6
HK81-2
⫹
Predicted ORF
19.3130 19.3130 CAGLQ69
996
225
YLR243W
12
0
n/a
n/a
Predicted ORF
19.3242 19.3242 CAGJX76
735
450
TAF10
12
0
n/a
n/a
Predicted ORF
19.3833 19.3833 CAGLP47
4201
2667
TFC3
12
0
n/a
n/a
Putative transcription
factor
19.391
UPC2
CAGOF87
2139
874
UPC2
12
2
JMR038
⫹
Transcription factor
regulating
ergosterol synthesis
19.3912 GLN3
CAGKJ50
2049
1237
GLN3
12
0
n/a
n/a
Transcription factor
regulating
filamentation
19.4194 19.4194 CAGN140
1092
24
TFB4
12
0
n/a
n/a
Putative transcription
factor
19.4420 19.4420 CAGL823
2403
981
(RRN6)
12
0
n/a
n/a
Predicted ORF
19.4524 ZCF24
CAGHM72
2185
776
(ASG1)
12
8
HM72-5
⫹
Predicted zinc finger
transcription factor
19.4545 SWI4
CAGJP77
3000
284
(SWI4)
12
0
n/a
n/a
Putative transcription
factor
19.4628 19.4628 CAGNF22
1497
13
MPE1
12
0
n/a
n/a
Predicted ORF
19.4722 19.4722 CAGP462
825
269
RTG1
12
1
JMR089
yes
Predicted ORF
19.4775 CTA8
CAGQK08
2286
1429
(HSF1)
12
2
JMR044
⫹
Putative transcription
factor
19.4814 19.4814 CAGQE66
336
256
None
12
4
JMR040
⫹
Predicted ORF
19.4851 TFA1
CAGQS80
1185
280
TFA1
12
0
n/a
n/a
Putative transcription
factor
19.4853 HCM1
CAGP438
1740
1030
HCM1
12
0
n/a
n/a
Putative transcription
factor
19.4882 19.4882 CAGNN71
855
627
TFA2
20
1
JMR087
⫹
Putative transcription
factor
19.5097 CAT8
CAGM111
3171
38
CAT8
24
0
n/a
n/a
Putative transcription
factor
We were unable to create mutants in 34 of these genes, some
of which may be essential. We note that the S. cerevisiae
orthologues of 13 of these genes are essential, but
homozy-gous C. albicans mutants for another six of these genes have
been made previously by other methods. We screened the
mutants we recovered in 33 genes for altered growth on
caspofungin medium and found a caspofungin-sensitive
strain with an insertion in SKO1 (Table 3).
Sko1 is orthologous to the S. cerevisiae transcription factor
ScSko1, which functions in the osmotic stress response. To
verify that Sko1 governs caspofungin sensitivity in C.
albi-cans, we constructed a sko1⌬/⌬ deletion mutant. Growth of
the sko1⌬/⌬ mutant was drastically reduced on caspofungin
plates compared with nutrient YPD plates (Figure 1). Similar
results were observed using another independent sko1⌬/⌬
mutant (derived from an independent heterozygote; data
not shown). The caspofungin-hypersensitive phenotype of
both mutants was complemented by introduction of a wt
copy of SKO1 (Figure 1 and data not shown), indicating that
the sko1⌬ mutation is the cause of caspofungin
hypersensi-tivity. These findings show that SKO1 is required for normal
caspofungin sensitivity.
Table 3.
Continued
ORF
Gene
aClone
name
bGene
length
(nt)
Insertion
site
c(nt)
S. cerevisiae
ortholog
(best match)
dNo. of
isolates
screened
eNo.
Recovered
fMutant
strain name
Caspofungin
growth
Description
19.5268 19.5268 CAGJM31
513
142
NUT2
12
0
n/a
n/a
Predicted ORF
19.5377 HOS2
CAGK036
1365
1068
HOS2
12
1
K036-9
⫹
Predicted ORF
19.5501 YAF9
CAGLJ16
765
28
YAF9
12
0
n/a
n/a
Predicted ORF
19.5552 19.5552 CAGL213
2208
1315
(CRT10)
12
1
JMR088
0
Predicted ORF
19.5558 RBF1
CAGIR07
1605
654
None
12
0
n/a
n/a
Transcription factor
involved in
filamentous growth
and pathogenesis
19.5666 19.5666 CAGO538
441
159
SUB1
12
3
JMR035
⫹
Predicted ORF
19.5680 19.5680 CAGNU89
1176
1156
None
12
0
n/a
n/a
Predicted ORF
19.5846 19.5846 CAGKB46
1485
1173
TFB2
12
0
n/a
n/a
Predicted ORF
19.5871 19.5871 CAGJC25
2093
253
SNF5
12
3
JC25-6
⫹
Predicted ORF
19.5910 19.5910 CAGMJ07
2280
13
NTO1
12
6
JMR062
⫹
Predicted ORF
19.5917 STP3
CAGJ322
1311
113
(STP2)
12
0
n/a
⫹
Transcription factor
regulating SAP2 &
OPT3
19.5992 WOR2 CAGKZ68
1341
303
(LYS14)
12
0
n/a
n/a
Predicted zinc finger
transcription factor
19.6109 TUP1
CAGKQ96
1545
349
TUP1
12
4
JMR069
n/a
Transcriptional
corepressor
19.6393 19.6393 CAGLA20
1251
776
GTS1
12
0
n/a
n/a
Predicted ORF
19.6414 19.6414 CAGHQ12
1923
205
None
12
7
HQ12-3
⫹
Predicted ORF
19.6649 BRF1
CAGKG39
1662
1306
BRF1
12
0
n/a
n/a
Putative transcription
factor
19.6753 19.6753 CAGJL50
450
27
YBR062C
12
0
n/a
n/a
Predicted ORF
19.6849 ELC1
CAGR528
303
269
ELC1
24
3
JMR046
⫹
Predicted ORF
19.7017 19.7017 CAGK324
1008
413
YOX1
12
3
JMR092
⫹
Predicted ORF
19.7046 MET28 CAGKQ61
522
118
None
12
0
n/a
n/a
Predicted ORF
19.705
19.705
CAGQ353
1350
1330
GCN5
12
0
n/a
n/a
Predicted ORF
19.7234 19.7234 CAGKV55
1686
698
RSC8
8
0
n/a
n/a
Predicted ORF
19.7317 UGA33 CAGKZ33
1450
717
(UGA3)
12
8
JMR077
⫹
Predicted zinc finger
transcription factor
19.7372 ZCF36 CAGIU75
3327
3164
(HAP1)
12
4
IU75-1
⫹
Predicted zinc finger
transcription factor
19.7381 ZCF37 CAGJ793
1875
1144
(LYS14)
12
5
J793-2
⫹
Predicted zinc finger
transcription factor
19.861
19.861
CAGJM52
531
267
(YAP6)
12
0
n/a
n/a
Putative transcription
factor
19.9780 BDF1
CAGKO55
2199
2000
BDF1
12
0
n/a
n/a
Putative transcription
factor
aORF assignments and gene designations are taken from the Candida Genome Database; http://www.candidagenome.org/.
bClone name refers to the insertion clone used to make each mutant (see Materials and Methods).
c
Insertion site is the distance from the ATG initiator of the ORF to the transposon insertion site.
d
S. cerevisiae orthologues or closest homologs (in parentheses) are taken from the Candida Genome Database; http://www.candidagenome.
org/.
e
No. of screened refers to the number of independent transformants from which Arg⫹Ura⫹ segregants were derived to screen for
homozygotes.
f
No. recovered is the number of independent homozygotes identified among the Arg⫹Ura⫹ segregants screened.
Regulation of SKO1 Expression by Cell Wall Damage
Transcription factors are often induced under conditions
that require their biological activity. Thus, we hypothesized
that caspofungin treatment may induce SKO1 expression.
We measured SKO1 transcript levels by RT-PCR after
caspo-fungin treatment. SKO1 was up-regulated sixfold in wt cells
treated with caspofungin (Figure 2A). SKO1 expression was
not detected in the sko1⌬/⌬ deletion mutant, thus
confirm-ing primer specificity, and was restored to wt levels in the
sko1⌬/⌬/⫹-complemented strain (Figure 2B). To monitor
Sko1 protein levels, we constructed a strain carrying a
func-tional epitope-tagged Sko1-V5 (Figure 1). Consistent with
our gene expression results, Western blotting analysis
showed that there was an increase in the amount of Sko1-V5
protein levels after caspofungin treatment (Figure 2C). We
conclude that caspofungin induces SKO1 gene expression
and protein accumulation.
Role of SKO1 in the Transcriptional Response to Cell
Wall Damage
We considered the possibility that Sko1 may be required for
expression of caspofungin-responsive genes. Alternatively,
Sko1 may be required for expression of osmotic stress
re-sponse genes that promote survival after cell wall damage.
0 6.0 2.0 4.0 10.0 8.0 SKO1 nor m aliz ed fol d ex pr e ssio n caspofungin dH20 caspofungin dH20 A hog1∆/∆ wt caspofungin 0 0.2 0.4 0.6 0.8 1.0 1.2 nor m aliz ed fol d ex pr e ssio n B wt SKO1 sko1∆/∆/+ sko1∆/∆ Time (min) Caspofungin Sko1-V5 0 1 30 2 60 3 90 4 C
Figure 2.
SKO1 Expression Analysis. (A) SKO1 expression was
monitored using real-time (RT) PCR analysis in the reference strain
DAY185 and prototrophic hog1⌬/⌬ strain (JMR114) with or without
125 ng caspofungin. (B) RT-PCR analysis of SKO1 expression in the
reference strain DAY185 and prototrophic sko1⌬/⌬ mutant
(JMR104) and sko1⌬/⌬/⫾-complemented strains (JMR109), with or
without 125 ng caspofungin. Transcript levels were normalized to
TDH3 expression, and fold changes between strains were
normal-ized to the wt reference strain adjusted to value of 1.0. (C) Wild-type
cells (strain JMR143) carrying SKO1-V5 were treated for various
times with caspofungin (t ⫽ 0, 30, 60, and 90 min). Sko1-V5 was
detected in an immunoblot.
nor m aliz ed fol d ex pr e s sio n GPD2 wt sko1∆/∆ Time (min) 10 40 0 20 30 50 60 70 0 0.5 1.0 1.5 2.0 2.5 B nor m a liz e d fol d ex pr e ssi o n Time (min) 10 40 0 20 30 50 60 70 wt sko1 ∆ / ∆ / + sko1 ∆ / ∆ 0.4 0.8 1.2 1.4 0 PGA13 A nor m a li z e d f o ld ex p ressio n Time (min) 10 40 0 20 30 50 60 70 wt RHR2 sko1 ∆/∆ 0 0.5 1.0 1.5 2.0 2.5 3.0 3.5 4.0 CFigure 3.
Gene expression response to caspofungin in wt and
sko1⌬/⌬ strains. Kinetic analysis of PGA13 (A), GPD2 (B), and RHR2
(C) expression after caspofungin treatment in reference strain
DAY185 strain (solid line with black squares), the sko1⌬/⌬ mutant
strain (dashed line with gray circles), and the
sko1⌬/⌬/⫾-comple-mented strain (solid line with white diamonds, only in A).
Tran-script levels were normalized to TDH3 expression.
DAY 185 (wt) sko1∆/∆/+ sko1∆/∆/SKO1-V5 hog1∆/∆ sko1∆/∆ Addition: hog1∆/∆/+ Caspofungin None DAY 185 (wt) psk1∆/∆ psk1∆/∆/+ A B
Figure 1.
Caspofungin sensitivity assays. Overnight cultures of
prototrophic C. albicans strains were serially diluted and spotted
onto nutrient YPD medium or YPD supplemented with caspofungin
(125 ng/ml). The wild-type C. albicans reference strain (DAY185),
null mutant (⌬/⌬), and complemented (⌬/⌬/⫹) strains are shown.
Panels A and B show two different plates.
To test these hypotheses, we monitored expression of the
caspofungin-responsive gene PGA13 and the osmotic stress
response genes RHR2 and GPD2. PGA13 specifies a cell wall
protein and is induced in response to cell wall damage
(Bruno et al., 2006) but not in response to osmotic stress
(Enjalbert et al., 2006). Rhr2 and Gpd2 catalyze the synthesis
of glycerol, which is critical in adaptation to osmotic stress
(Fan et al., 2005; Enjalbert et al., 2006). We observed that
PGA13 was induced in the wt and
sko1⌬/⌬/⫹-comple-mented strains, but not in the sko1⌬/⌬ mutant (Figure 3A).
On the other hand, GPD2 and RHR2 expression was similar
in the wt strain and sko1⌬/⌬ mutant (Figure 3, B and C).
Therefore, although caspofungin treatment induces two
os-motic stress-responsive genes, this response is independent
of Sko1 function. In contrast, induction of the cell wall
protein gene PGA13 depends on Sko1 function.
To define Sko1-dependent genes in broader terms, we
performed microarray comparisons of the wt strain and
sko1⌬/⌬ mutant treated with caspofungin (Supplementary
Dataset 1, Worksheet 1 and 2). We found that Sko1 regulates
79 caspofungin-responsive genes, including several cell wall
biogenesis genes (Supplemental Dataset 1, Worksheet 3).
RT-PCR analysis confirmed the reduced expression of cell
wall biogenesis genes CRH11, MNN2, and SKN1 in the
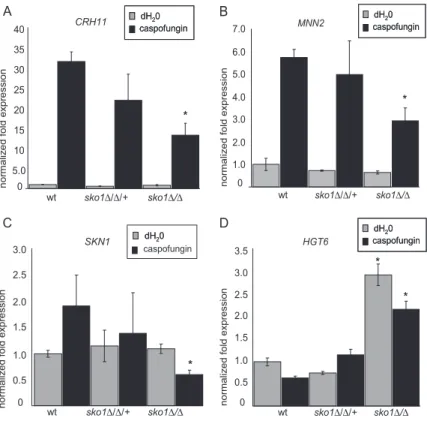
sko1⌬/⌬ mutant treated with caspofungin (Figure 4, A–C).
Gene expression levels were restored to wt in the sko1⌬/⌬/
⫹-complemented strain (Figure 4, A–C). Therefore, Sko1 is
necessary for expression of many caspofungin-responsive
genes.
We noted that carbohydrate metabolic genes, such as the
glucose transporter gene HGT6, were significantly
overex-pressed in the sko1⌬/⌬ mutant (Supplementary Table S1,
Worksheets 1 and 2). These genes are not induced by
caspo-fungin. RT-PCR assays showed that HGT6 is overexpressed
in the sko1⌬/⌬ mutant with or without caspofungin
treat-ment (Figure 4D). These findings indicate that Sko1 is a
negative regulator of carbon metabolic genes.
Identification of Upstream Regulators of SKO1 Expression
To identify upstream regulators of Sko1 activity, we first
considered the S. cerevisiae paradigm. The protein kinase
ScHog1 activates ScSko1 by phosphorylation in response to
osmotic shock, thereby causing a change in ScSko1
electro-phoretic mobility (Proft et al., 2001). Thus, we considered
that C. albicans Hog1 may be a regulator of Sko1 in response
to caspofungin treatment. Prior studies have shown that the
C. albicans the HOG pathway is important for cell wall
biosynthesis and stability (Eisman et al., 2006; Enjalbert et al.,
2006; Munro et al., 2007). However, we observed that a
hog1⌬/⌬ mutant was only slightly hypersensitive to
caspo-fungin compared with the sko1⌬/⌬ mutant (Figure 1), and it
Addition NaCl: Phosphatase: Phosphatase inhibitor: Lane: hog1∆/∆ wt
B
+ -1 -2 + + + 3 + + -4 -3 + 2 + 4 -1A
Addition NaCl: Lane:Figure 5.
Hog1-dependent phosphorylation of Sko1 after osmotic
stress. (A) Sko1-V5 was visualized on an immunoblot of wt cells
(strain JMR143) or hog1⌬/⌬ cells, with or without 1.5 M NaCl
treat-ment for 10 min. (B) Total protein extracts were collected and
treated with 50 U of calf alkaline phosphatase in the presence or
absence of phosphatase inhibitors as indicated. Sko1-V5 was
de-tected on an immunoblot.
CRH11 nor m al iz ed fol d ex pr essi o nA
0 5.0 10 15 20 25 30 wt sko1∆/∆/+ sko1∆/∆ 35 40 caspofungin dH20 caspofungin dH20 * wt sko1∆/∆/+ sko1∆/∆ MNN2 nor m aliz ed fol d ex pre ssio nB
caspofungin dH20 caspofungin dH20 0 1.0 2.0 3.0 4.0 5.0 6.0 7.0 * wt sko1∆/∆/+ sko1∆/∆ SKN1C
0 0.5 1.0 1.5 2.0 2.5 nor mal iz ed fol d ex pr essi o n 3.0 caspofungin dH20 dH20 * wt sko1∆/∆/+ sko1∆/∆ nor m a liz ed fol d ex pr e s sio n HGT6D
caspofungin dH20 caspofungin dH20 0 1.0 1.5 2.0 2.5 3.0 3.5 0.5 * *Figure 4.
Verification of Sko1 target genes identified
through microarray analysis. RT-PCR expression
anal-ysis of SKO1 array target genes CRH11 (A), MNN2 (B),
SKN1 (C), and HGT6 (D) with or without caspofungin
treatment in reference strain DAY185, the sko1⌬/⌬
mu-tant strain (JMR104), and the
sko1⌬/⌬/⫾-comple-mented strain (JMR109). Transcript levels were
normal-ized to TDH3 expression, and fold changes between
strains were normalized to the reference strain, adjusted
to value of 1.0. *p ⬍ 0.05 compared with the reference
strain.
expressed SKO1 normally (Figure 2A). Protein analysis from
wt cells treated with caspofungin showed that Sko1 does not
undergo an electrophoretic shift (Figure 2C). On the other
hand, we observed a Sko1 electrophoretic shift after osmotic
shock in wt cells but not in the hog1⌬/⌬ mutant strain
(Figure 5A). The Sko1 electrophoretic shift was sensitive to
phosphatase treatment (Figure 5B). These results suggest
that Hog1 phosphorylates Sko1 after osmotic stress, but
argue that the HOG pathway does not regulate Sko1 after
caspofungin-induced cell wall damage.
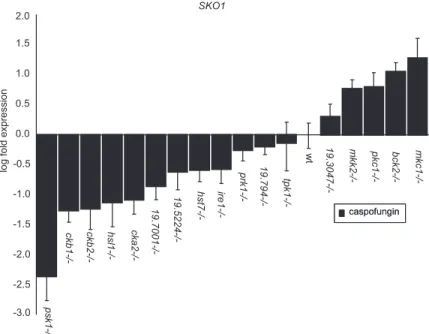
We have recently identified insertion mutants in several
protein kinase–related genes that are hypersensitive to
caspofungin (Blankenship, Fanning, Hamaker, and Mitchell,
unpublished data). Those protein kinases are additional
can-didate SKO1 regulators. We found that SKO1 expression
was similar to wt in eight mutants, reduced about twofold in
four mutants, and increased about twofold in four mutants.
We note that SKO1 expression was increased in all mutants
of the PKC-signaling pathway (Figure 6). SKO1 expression
was most severely reduced in the psk1⫺/⫺ mutant (Figure
6). Indeed, several independent psk1⌬/⌬ deletion strains
were hypersensitive to caspofungin (Figure 1 and data not
shown), a phenotype that was complemented by a wt PSK1
allele (Figure 1). SKO1 was expressed at its uninduced level
in three independent psk1⌬/⌬ mutant deletion mutants,
re-gardless of caspofungin treatment (Figure 7A and data not
shown). Therefore, Psk1 is a positive regulator of SKO1
expression in caspofungin-treated cells.
Our observations predict that a psk1⌬ mutation will
affect expression of Sko1 target genes. RT-PCR assays
showed reduced expression of PGA13 and MNN2 and the
increased expression of HGT6 in psk1⌬/⌬ cells, compared
with wt or complemented strains (Figure 8, A and B).
Interestingly, HGT6 was overexpressed in the psk1⌬/⌬
mutant only after caspofungin treatment (Figure 8C), the
circumstance in which the mutant has reduced expression
of SKO1 (Figure 7). These results support the model that
Psk1 is required for functional expression of SKO1 in
response to caspofungin.
DISCUSSION
The fungal cell wall has vital roles in growth, survival,
morphogenesis, and pathogenicity. Critical for the
coordi-nation of these activities is the dynamic nature of the cell
wall, its ability to respond to external and internal stimuli.
We propose that the distinct evolutionary paths of each
fungal species may be reflected in unique cell wall
regula-tory pathways. Our identification of a C. albicans Psk1-Sko1
pathway (Figure 9) lends support to this idea. Inhibition of
cell wall biogenesis by caspofungin causes an increase in
SKO1 expression. This increase is dependent on the protein
kinase Psk1 and culminates in the expression of diverse
genes that are necessary for cell wall stability. Although
aspects of Sko1 and Psk1 function are conserved in S.
cer-evisiae, the connections among Sko1, Psk1, and cell wall
perturbation may be unique to C. albicans.
Conservation of the Hog1–Sko1 Relationship
Our findings argue that Sko1 functions in the
Hog1-depen-dent osmotic stress response, a relationship well established
in S. cerevisiae (Proft et al., 2001; Rep et al., 2001). This role
n o rm alize d f o ld e x p ression SKO1 psk1∆/∆ psk1∆/∆/+ 0 1.5 1.0 1.5 2.0 2.5 3.0 caspofungin dH20 caspofungin dH20 wt 3.5 4.0
*
Figure 7.
Psk1 Requirement for SKO1 expression. (A) RT-PCR
analysis of SKO1 expression in reference strain DAY185, the
pro-totrophic psk1⌬/⌬ mutant strain (JMR192), and the
psk1⌬/⌬/⫹-com-plemented strain (JMR188) with or without caspofungin treatment.
SKO1 transcript levels were normalized as described in the Figure 4
legend. *p ⬍ 0.05 compared with the reference strain.
SKO1 lo g fo ld e x p re ssi on ckb1-/- ckb2-/- hsl 1 -/- cka2-/-19.7 001-/-19 .5224 -/- prk1-/- ire1-/- tpk1-/-19 .794 -/-19 .3047 -/-m kk2-/- pkc 1 -/-bck 2 -/-m kc1-/- hst7- /-wt psk 1-/ -caspofungin caspofungin -1.0 -0.5 0.0 0.5 1.0 2.0 1.5 -1.5 -2.0 -2.5 -3.0Figure 6.
SKO1 Expression in
caspofungin-hypersen-sitive protein kinase mutants. SKO1 expression was
monitored by RT-PCR in reference strain DAY286 and
in the 17 protein kinase insertion homozygotes
indi-cated. All strains were treated with caspofungin for 60
min. SKO1 transcript levels were normalized as
de-scribed in the Figure 4 legend.
was foreshadowed by microarray analysis (Enjalbert et al.,
2006), which revealed that SKO1 expression is induced
1.5-fold by osmotic stress, dependent on HOG1. Our results
point to a second aspect of this relationship: Sko1 undergoes
Hog1-dependent phosphorylation after osmotic stress. Hog1
may phosphorylate Sko1 directly, as known for the S.
cer-evisiae orthologues, because the ScSko1 phosphoacceptor
se-quence is well conserved in C. albicans Sko1 (Krantz et al.,
2006). Indeed, sko1⌬/⌬ mutants are slightly sensitive to
os-motic stress (our unpublished results), so these modes of
Sko1 regulation may be functionally significant. Therefore,
aspects of the Hog1–Sko1 relationship are conserved in the
C. albicans osmotic stress response.
Role of SKO1 in the Cell Wall Damage Response
Our findings establish that Sko1 is necessary for the cell wall
damage response. In principle, the caspofungin
hypersensi-tivity of the sko1⌬/⌬ mutant might have reflected an aberrant
osmotic stress response. This response is induced by cell
wall perturbation in both S. cerevisiae (Boorsma et al., 2004)
and, as we show here, in C. albicans. However, two C.
albicans osmotic stress genes are induced by caspofungin
independently of Sko1. Furthermore, the major
Sko1-depen-dent genes that are induced by caspofungin, such as CRH11,
PGA13, and MNN2, are not induced by osmotic stress
(En-jalbert et al., 2006). The fact that SKO1 is induced by
caspo-fungin in both wt and hog1⌬/⌬ strains, along with our failure
to detect caspofungin-induced Sko1 phosphorylation,
fur-ther underscore the independence of Sko1 and Hog1
activ-ities after cell wall perturbation. Therefore, the Hog1–Sko1
paradigm does not account for the role of Sko1 in the cell
wall damage response.
Our hypothesis is that the caspofungin-inducible genes
that depend upon Sko1 for full expression contribute to the
sko1⌬/⌬ mutant’s caspofungin hypersensitivity. We have
identified 26 genes of this class in our experiments. This
number includes 25 genes that were induced by caspofungin
in the wt strain, as detected (ⱖ1.5-fold) with our current
array platform, as well as PGA13, for which induction was
detected only by RT-PCR (Supplemental Dataset, Worksheet
4). (Based on the caspofungin-inducible gene set defined by
Bruno et al. (2006) with a different array platform, there are
14 genes of this class, as summarized in the Supplemental
Dataset Worksheet 5). For example, KRE1, SKN1, PHR1,
CRH11, PGA13, PGA31, and MNN2 have all been implicated
in cell wall biogenesis (Boone et al., 1991; Mio et al., 1997;
Popolo and Vai, 1998; De Groot et al., 2003; Pardini et al.,
2006). In addition, we have observed that mnn2 and pga13
homozygous insertion mutants are caspofungin
hypersensi-tive (our unpublished data). These observations suggest that
MNN2 wt psk1∆/∆/+ psk1∆/∆A
nor m a liz ed fol d ex pr e ssio n 0 1.0 1.5 2.0 2.5 3.0 3.5 0.5 4.0 caspofungin dH20 caspofungin dH20*
B
wt psk1∆/∆/+ psk1∆/∆ PGA13 caspofungin dH20 caspofungin dH20 nor m aliz ed fol d ex pre ssio n 0 1.0 1.5 2.0 2.5 3.0 3.5 0.5 4.5 4.0 * HGT6C
nor maliz e d fol d ex pr e s sio n wt psk1∆/∆/+ psk1∆/∆ caspofungin dH20 caspofungin dH20 0 1.0 1.5 2.0 2.5 3.0 3.5 0.5 4.0 *Figure 8.
Expression of SKO1 target genes in psk1⌬/⌬ mutants.
RT-PCR expression analysis of SKO1 target genes PGA13 (A),
MNN2 (B), and HGT6 (C) with or without caspofungin treatment in
reference strain DAY185, the prototrophic psk1⌬/⌬ mutant strain
(JMR192), and the psk1⌬/⌬/⫹-complemented strain (JMR188) with
or without caspofungin treatment. Transcript levels were
normal-ized as described in the Figure 4 legend. *p ⬍ 0.05 compared with
the reference strain.
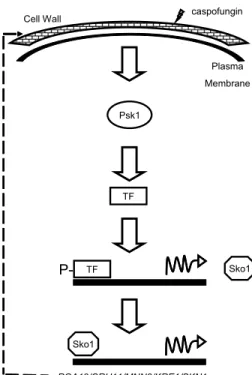
Psk1 Sko1 PGA13/CRH11/MNN2/KRE1/SKN1 Sko1 caspofungin Plasma Membrane Cell Wall TF TF
P-Figure 9.
Model for the C. albicans Psk1-Sko1 signaling pathway.
Cell wall damage induced by caspofungin treatment activates Psk1.
Psk1 acts on an unidentified transcription factor, leading to elevated
SKO1 expression. The Psk1 target is depicted as an activator, but
could equally well be a repressor. Sko1 activates downstream target
genes to restore integrity of the cell wall.
Sko1-dependent induction of these genes may be critical for
an effective response to cell wall damage.
It seems likely that additional Sko1-regulated genes may
also influence the sko1⌬/⌬ mutant’s caspofungin
hypersen-sitivity. Most Sko1-regulated genes are not induced by
caspofungin under our treatment conditions. A major subset
of these genes is involved in carbohydrate metabolism (p ⫽
6.51 ⫻ 10
⫺5for 46/447 genes; http://www.candidagenome.
org/cgi-bin/GO/goTermFinder), such as PFK2 (glycolysis),
PCK1 (gluconeogenesis), and REG1 (carbon regulation).
Sev-eral hexose transporter genes, such as HGT6, are also
regu-lated by Sko1. The cell wall is composed mainly of glucose
polymers, so altered flux through carbon metabolic
path-ways may have significant consequences for cell wall
bio-genesis. Thus we suggest that multiple classes of
Sko1-regulated genes impact the integrity of the cell wall.
Upstream Regulators of SKO1
Although several studies have revealed that transcription
factors have been rewired in C. albicans compared with S.
cerevisiae (Kadosh and Johnson, 2001; Khalaf and Zitomer,
2001; Ihmels et al., 2005; Martchenko et al., 2007; Banerjee et
al., 2008), seldom have the relevant upstream regulators
been identified. Here we have identified protein kinase Psk1
as a regulator of SKO1 expression. Psk1 is a PAS-domain
protein, and PAS-domain proteins of prokaryotes and
eu-karyotes regulate diverse physiological processes (Rutter
et al., 2001; Gilles-Gonzalez and Gonzalez, 2004). The S.
cerevisiae PAS protein kinases ScPsk1 and ScPsk2 control
glucose partitioning. S. cerevisiae ScPsk1/2 phosphorylates
the enzyme UDP-glucose pyrophosphorylase to stimulate
the formation of UDP-glucose, the precursor for glycogen
and glucan synthesis (Smith and Rutter, 2007). Thus,
Scpsk1/2⌬ double mutants are sensitive to cell
wall–perturb-ing agents (Smith and Rutter, 2007). In this context, it is not
surprising that the C. albicans psk1⌬/⌬ mutant is
caspofgin-hypersensitive. However, its connection to Sko1 is
un-expected.
Our conclusion that Psk1 acts upstream of Sko1 is based
on two lines of evidence. First, we found that that psk1
insertion and deletion homozygotes express SKO1 RNA at
its basal level, even after caspofungin treatment. Thus Psk1
is required specifically for the induction of SKO1 by
caspo-fungin. Second, we observed that two Sko1-dependent cell
wall genes, PGA13 and MNN2, are expressed at reduced
levels in psk1⌬/⌬ mutants. In addition, the Sko1-repressed
gene HGT6 is expressed at elevated levels in psk1⌬/⌬
mu-tants. Interestingly, the altered regulation of HGT6 in
psk1⌬/⌬ mutants argues that the induction of SKO1 by the
cell wall damage has functional consequences: HGT6 is
ex-pressed at normal levels in psk1⌬/⌬ mutants in the absence
of caspofungin, when SKO1 is expressed at its basal level.
However, HGT6 is overexpressed in psk1⌬/⌬ mutants in the
presence of caspofungin, when SKO1 induction is defective.
We suggest that caspofungin treatment increases the
de-mand for Sko1 activity, which is limiting in psk1⌬/⌬
mu-tants. Limitation of Sko1 activity may partially recapitulate a
sko1⌬/⌬ mutant phenotype, resulting in elevated HGT6
ex-pression. This observation, along with the caspofungin
hy-persensitivity of the psk1⌬/⌬ mutant, argues that
Psk1-de-pendent induction of SKO1 is critical for an effective
response to cell wall perturbation.
The Psk1–Sko1 relationship represents a new cell wall
damage signaling pathway. Our gene expression data
pro-vide some insight into the outputs of the pathway, though
we have not yet distinguished direct Sko1 target genes. Two
key aspects of the pathway remain to be discovered. One is
the mechanism by which Psk1 regulates Sko1 RNA
accumu-lation. A simple possibility is that Psk1 phosphorylates and
activates another transcription factor, which in turn activates
SKO1 expression. Transcription factor mutant screens, as
reported here and in Bruno et al. (2006), may identify this
component. A second area for future analysis is the
mecha-nism by which Psk1 may sense cell wall perturbation. The
similarity of overall Psk1 biological function in S. cerevisiae
and C. albicans may indicate that upstream signaling
com-ponents are conserved, so that gene discovery strategies
carried out in both organisms may converge upon these
genes. Finally, our results argue that Sko1 lies at the
inter-section of two C. albicans stress response pathways, defined
by Hog1 and Psk1. An interesting possibility is that Sko1
may coordinate these responses.
ACKNOWLEDGEMENTS
We thank members of our lab for their advice and discussions, and Carmelle T. Norice for providing useful preliminary observations. We are grateful to Merck Research Labs for providing caspofungin. This is NRC publication number 49558. This work was supported by NIH grant 5R01AI057804, its supplement S1, and fellowship F32AI71439 to JRB.
REFERENCES
Banerjee, M., Thompson, D. S., Lazzell, A., Carlisle, P. L., Pierce, C., Monteagudo, C., Lopez-Ribot, J. L., and Kadosh, D. (2008). UME6, a novel filament-specific regulator of Candida albicans hyphal extension and virulence. Mol. Biol. Cell 19, 1354 –1365.
Boone, C., Sdicu, A., Laroche, M., and Bussey, H. (1991). Isolation from Candida albicans of a functional homolog of the Saccharomyces cerevisiae KRE1 gene, which is involved in cell wall beta-glucan synthesis. J. Bacteriol. 173, 6859 – 6864.
Boorsma, A., de Nobel, H., ter Riet, B., Bargmann, B., Brul, S., Hellingwerf, K. J., and Klis, F. M. (2004). Characterization of the transcriptional response to cell wall stress in Saccharomyces cerevisiae. Yeast 21, 413– 427.
Braun, B. R., Kadosh, D., and Johnson, A. D. (2001). NRG1, a repressor of filamentous growth in C. albicans, is down-regulated during filament induc-tion. EMBO J. 20, 4753– 4761.
Bruno, V. M., Kalachikov, S., Subaran, R., Nobile, C. J., Kyratsous, C., and Mitchell, A. P. (2006). Control of the C. albicans cell wall damage response by transcriptional regulator Cas5. PLoS Pathog 2, e21.
Davis, D., Edwards, J. E., Jr., Mitchell, A. P., and Ibrahim, A. S. (2000). Candida albicans RIM101 pH response pathway is required for host-pathogen interac-tions. Infect. Immun. 68, 5953–5959.
Davis, D. A., Bruno, V. M., Loza, L., Filler, S. G., and Mitchell, A. P. (2002). Candida albicans Mds3p, a conserved regulator of pH responses and virulence identified through insertional mutagenesis. Genetics 162, 1573–1581. De Groot, P. W., Hellingwerf, K. J., and Klis, F. M. (2003). Genome-wide identification of fungal GPI proteins. Yeast 20, 781–796.
Dranginis, A. M., Rauceo, J. M., Coronado, J. E., and Lipke, P. N. (2007). A biochemical guide to yeast adhesins: glycoproteins for social and antisocial occasions. Microbiol. Mol. Biol. Rev. 71, 282–294.
Eisman, B., Alonso-Monge, R., Roman, E., Arana, D., Nombela, C., and Pla, J. (2006). The Cek1 and Hog1 mitogen-activated protein kinases play comple-mentary roles in cell wall biogenesis and chlamydospore formation in the fungal pathogen Candida albicans. Eukaryot. Cell 5, 347–358.
Enjalbert, B., Smith, D. A., Cornell, M. J., Alam, I., Nicholls, S., Brown, A. J., and Quinn, J. (2006). Role of the Hog1 stress-activated protein kinase in the global transcriptional response to stress in the fungal pathogen Candida albi-cans. Mol. Biol. Cell 17, 1018 –1032.
Fan, J., Whiteway, M., and Shen, S. H. (2005). Disruption of a gene encoding glycerol 3-phosphatase from Candida albicans impairs intracellular glycerol accumulation-mediated salt-tolerance. FEMS Microbiol. Lett. 245, 107–116. Gilles-Gonzalez, M. A., and Gonzalez, G. (2004). Signal transduction by heme-containing PAS-domain proteins. J. Appl. Physiol. 96, 774 –783. Ihmels, J., Bergmann, S., Gerami-Nejad, M., Yanai, I., McClellan, M., Berman, J., and Barkai, N. (2005). Rewiring of the yeast transcriptional network through the evolution of motif usage. Science 309, 938 –940.