Publisher’s version / Version de l'éditeur:
Journal of Building Physics, 31, pp. 125-142, 2007-10-01
READ THESE TERMS AND CONDITIONS CAREFULLY BEFORE USING THIS WEBSITE.
https://nrc-publications.canada.ca/eng/copyright
Vous avez des questions? Nous pouvons vous aider. Pour communiquer directement avec un auteur, consultez la
première page de la revue dans laquelle son article a été publié afin de trouver ses coordonnées. Si vous n’arrivez pas à les repérer, communiquez avec nous à PublicationsArchive-ArchivesPublications@nrc-cnrc.gc.ca.
Questions? Contact the NRC Publications Archive team at
PublicationsArchive-ArchivesPublications@nrc-cnrc.gc.ca. If you wish to email the authors directly, please see the first page of the publication for their contact information.
NRC Publications Archive
Archives des publications du CNRC
This publication could be one of several versions: author’s original, accepted manuscript or the publisher’s version. / La version de cette publication peut être l’une des suivantes : la version prépublication de l’auteur, la version acceptée du manuscrit ou la version de l’éditeur.
For the publisher’s version, please access the DOI link below./ Pour consulter la version de l’éditeur, utilisez le lien DOI ci-dessous.
https://doi.org/10.1177/1744259107081648
Access and use of this website and the material on it are subject to the Terms and Conditions set forth at
Experimental and analytical investigation of moisture movement in
clothing
Takada, S.; Hokoi, S.; Kumaran, M. K.
https://publications-cnrc.canada.ca/fra/droits
L’accès à ce site Web et l’utilisation de son contenu sont assujettis aux conditions présentées dans le site LISEZ CES CONDITIONS ATTENTIVEMENT AVANT D’UTILISER CE SITE WEB.
NRC Publications Record / Notice d'Archives des publications de CNRC:
https://nrc-publications.canada.ca/eng/view/object/?id=1009a1a5-4ef8-4b9c-8c56-02aa1d9ee829 https://publications-cnrc.canada.ca/fra/voir/objet/?id=1009a1a5-4ef8-4b9c-8c56-02aa1d9ee829
http://www.nrc-cnrc.gc.ca/irc
Ex pe rim e nt a l a nd a na lyt ic a l inve st iga t ion of m oist ure m ove m e nt in
c lot hing
N R C C - 4 9 2 3 8
T a k a d a , S . ; H o k o i , S . ; K u m a r a n , M . K .
O c t o b e r 2 0 0 7
A version of this document is published in / Une version de ce document se trouve dans:
Journal of Building Physics, 31, no. 2, pp. 125 - 142, October 01, 2007,
DOI:
10.1177/1744259107081648The material in this document is covered by the provisions of the Copyright Act, by Canadian laws, policies, regulations and international agreements. Such provisions serve to identify the information source and, in specific instances, to prohibit reproduction of materials without written permission. For more information visit http://laws.justice.gc.ca/en/showtdm/cs/C-42
Les renseignements dans ce document sont protégés par la Loi sur le droit d'auteur, par les lois, les politiques et les règlements du Canada et des accords internationaux. Ces dispositions permettent d'identifier la source de l'information et, dans certains cas, d'interdire la copie de documents sans permission écrite. Pour obtenir de plus amples renseignements : http://lois.justice.gc.ca/fr/showtdm/cs/C-42
EXPERIMENTAL AND ANALYTICAL INVESTIGATION
OF MOISTURE MOVEMENT IN CLOTHING
S. Takada
*, S. Hokoi** and M.K.Kumaran***
*Department of Architecture, Graduate School of Engineering, Kobe University, Rokkodaicho, Nada-ku, Kobe, 657-8501 Japan
**Department of Architecture and Architectural Engineering, Graduate School of Engineering, Kyoto University, Kyotodaigakukatsura, Nishikyo-ku, Kyoto, 615-8540 Japan
***Building Envelope and Structure, National Research Council Institute for Research in Construction, Canada, Ottawa, Ontario, K1A 0R6 Canada
Abstract
In order to design an efficient air-conditioning system, the specifics of the transient thermal and physiological responses of a human body to the hygrothermal environment should be taken into account. This response will strongly depend on the behavior of heat and moisture transport, and moisture accumulation in the clothing, especially when sweat exists in and around the clothing. As a basic information on this problem, a model of the moisture transfer in cloth is necessary.
In this paper, a model of the liquid moisture movement in clothing under gravity is developed and applied, based on a diffusion model. Firstly, the moisture diffusivity is determined from the investigation of the moisture absorption process in the horizontal direction where gravity has no influence on the moisture movement. Secondly with the use of the moisture diffusivity thus determined, a moisture absorption process in the upward direction against gravity is investigated. The validity of the parameter related to the gravity effect is examined by comparing the results of numerical calculations with the experimental results obtained from the gamma-ray method. Since the two agree generally well, the parameters viz. liquid moisture diffusivity and sorption isotherm derived here for a sample of broadcloth are considered reliable.
1 Introduction
In order to realize healthy, comfortable and efficient air conditioning, it is important not only to improve the air conditioning systems but also to understand the thermal and physiological responses of human body to the hygrothermal environment. Clothing becomes an important issue then. Several hygrothermal models that describe the response in steady state have been proposed [1,2,3]. These models consider clothing as a hygrothermal resistance. Although the evaluation for the steady state methods is useful for many purposes, there are some cases where the transient characteristics become important. For example, under an environment where regulatory sweating occurs intensively, most of the sweat is absorbed by the clothing as liquid moisture and accumulates. Subsequently the moisture evaporates from the outer surface of the clothing. In such a situation, the rate of evaporation from the clothing surface, which is closely related to the moisture content of the clothing surface, will have a significant influence on the body temperature regulation system [4,5]. Therefore, the models should properly interpret the characteristics of moisture diffusion in the clothing.
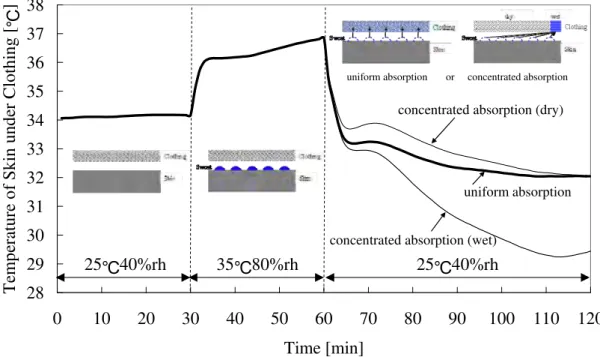
A simulated result of skin temperature under clothing is shown in Figure 1. The simulation is based on the two-node model[2] for the temperature regulation system of human body combined with heat and
moisture transfer model in clothing[4]. The simulation is associated with 2 hours exposure to transient thermal environment in which the operative temperature rises and decreases stepwise. The clothing covers 40 % of body surface and it is a single layered cotton cloth with the thickness 0.5mm. In the calculation, the followings are assumed: (1) At 60th minutes, all the sweat accumulated at the skin surface is absorbed to clothing. (2) For one calculated case, the sweat diffusion is fast and the moisture content in clothing is uniform just after absorption, and for the other case, the sweat diffusion is slower and it is absorbed to one-eighth part of clothing. In the latter case, the skin temperature in wet part continues to decrease for a longer time than in the dry part or in the former case and the skin temperature difference among them reaches 3 K. This will bring significant difference to the body temperature regulation system. The diffusion of liquid moisture transfer in clothing should be predicted properly.
From that viewpoint, the present authors have been studying the liquid moisture movement in clothing materials and have shown the in-plane moisture movement can be described using a diffusion model [6]. In the field of textiles, there are several studies on the liquid moisture transfer in cloth [7,8,9]. Their purpose, however, was to compare the characteristics of moisture uptake between different kinds of cloth and those studies are not sufficient for evaluating the thermal effects of the moisture absorption/adsorption to and evaporation from the clothing.
In this paper, the moisture movement under gravity is investigated based on the moisture content measured using the gamma-ray attenuation method [10,11,12,13], during a moisture uptake process. At the same time, the measurement is analyzed using the diffusion model. The moisture movement in sand under gravity has been investigated by other researchers [14,15], and the validity of applying the same model to the clothing is investigated in the present paper.
This paper also focuses on the sorption isotherm of cloth. While the sorption isotherm is usually determined through a gravimetric measurement for hygroscopic range, it is measured by other methods for the range near saturation. The pressure membrane method [16,17,18] often used for this purpose is inappropriate for a thin material like clothing. In this study, the sorption isotherm in the range near saturation is important for the analysis of the sweat transfer in the clothing and is determined using the moisture content distribution in the equilibrium state, in the same moisture uptake process referred to above.
Kumaran et al. [11,12] have investigated the characteristics of one gamma-ray apparatus and the techniques of the measurement. Since the influence of the area of the gamma-ray beam passing through the specimen has not been quantitatively assessed, it is also investigated in this paper.
2 Basic equations
The moisture flux in a porous material under gravity is expressed in two ways as follows [14,15].
g
y
w
D
q
w w ' μλ
∂
∂
+
−
=
(1-a) org
y
q
w ' ' μ μ∂
λ
μ
∂
λ
+
−
=
(1-b)where, the direction of gravity (vertical coordinate y) is taken as positive, and,
q
w : moisture flux [kg/(m2 s)],w
: volumetric moisture content [m3/m3],
μ
: water chemical potential [J/kg],g
: acceleration of gravity [m/s2],
λ
'
μ: moisture conductivity due toμ
gradient [kg/{(J/kg) m s}].The equilibrium relationship (sorption isotherm) of a cloth is written as equation (2).
)
,
(
w
T
f
=
μ
(2)y
T
T
y
w
w
y
∂
∂
∂
∂
+
∂
∂
∂
∂
=
∂
∂
μ
μ
μ
(3)where,
f
: equilibrium relationship [J/kg],T
: temperature [K].When the dependence of the equilibrium relationship on temperature can be neglected, the second term on the right-hand side of equation (3) becomes zero. By comparing equations (1-a) and (1-b), equation (4) is obtained.
w
D
w∂
μ
∂
λ
'μ=
(4)This equation describes the relationship among three variables: 1) moisture diffusivity
D
w, 2) gradient ofequilibrium relationship to moisture content
∂ /
μ
∂
w
, 3) moisture conductivity due to water chemicalpotential
λ
'
μ.The moisture balance equation in the cloth is written as equation (5).
l
E
a
g
a
y
u
D
y
t
u
w w⋅
−
⋅
+
−
−
=
ρ
λ
ρ
∂
∂
∂
∂
∂
∂
μ1
]
1
[
' (5) where,u
: degree of saturation(=
w /
a
),t
: time [s],a
: porosity of cloth [m3/m3],
ρ
w: density of water [kg/m3],l
: thickness of cloth [m],
E
: evaporation rate at cloth surface [kg/(m2 s)], andD
=
D
w/
ρ
w.In equation (5), the evaporation from the surface of the cloth is taken into account with the following equation.
)
(
' a sP
P
E
=
α
−
(6) where, 'α
P
: moisture transfer coefficient [kg/(m2 s Pa)],
P
s : vapor pressure at cloth surface [Pa],a : vapor pressure of air [Pa].
The vapor pressure at cloth surface is determined from moisture content (degree of saturation) with the sorption isotherm of cotton [19].
Though equation (5) can also be written with the use of water chemical potential, the measurement of this quantity is difficult. Therefore the expression using moisture content is adopted here.
3 Moisture movement in horizontal direction
[6]
3.1 Characteristics of sample of cloth
Broadcloth (material: cotton 100%, thickness: 0.25 mm, the density of thread: weft 23 cm-1 / warp 46
cm-1, thread: 60S ; ‘S’ is a unit used in the field of textile and 10S is equal to 8400 yard/pound.) was
selected as a sample, which most of dress shirts are made of. The moisture movement parallel to weft is focused on in the following experiments and analyses. (The moisture movement vertical to weft was also tested for the present material and the anisotropy in moisture movement was studied quantitatively [6]. Since the anisotropy can be taken into account based on the proposed methodology, the movement
parallel to weft is focused on in this paper.) The boundary of a cloth is not easy to define because the ambient air and the air in the pore of the cloth are connected. If the boundary is regarded as the envelope of threads that constitutes the cloth, the volume of the cloth can be determined by the thickness. The porosity of the sample was found to be 0.67, with the data of the density of the fiber matrix in the
handbook of textiles (1540 kg/m3, for cotton) and also the measured data of the bulk weight of the
sample.
3.2 Experiment
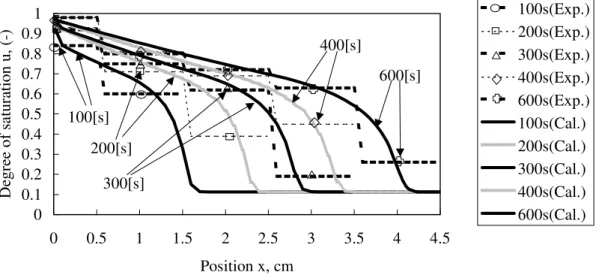
A strip of cotton broadcloth (size: 30 x 200 x 0.25 mm) was laid horizontally on a frame made of fishing line and one of the edges of the strip was dipped into the water at t = 0. The schematic of the setup is shown in Figure 2. The moisture content distribution was measured gravimetrically by cutting the specimen into successive 1 cm pieces. The distribution is measured five times at t = 100 s, 200 s, 300 s, 400 s and 600 s. The results are shown in Figure 3.
3.3 Analysis
Equation (5) is solved numerically, where the acceleration of gravity is set at zero and the vertical coordinate y is replaced with the horizontal coordinate x. The direction of the moisture movement from the water reservoir is taken as positive. For the boundary condition at x = 0 (just near the water reservoir), the measured values of moisture content are used. The moisture diffusivity D is optimized so that the calculated moisture content distribution agrees with the experimental results. The estimated value of the D is given as a function of a moisture content (degree of saturation) by equation (7).
(7)
)
7
.
0
(
]
/
[
10
0
.
2
)
7
.
0
(
]
/
[
)
9
exp(
10
0
.
4
2 6 2 9>
×
=
≤
⋅
×
=
− −u
s
m
u
s
m
u
D
The moisture transfer coefficient in equation (5) is given as 2.95 x 10⁻⁸ [kg/(m2 s Pa)].
The calculated results using the optimized diffusivity also is shown in Figure 3 and agree well with the experimental results, especially in terms of the rate of advance of the moisture front. Thus the diffusion model can be used in describing the horizontal moisture movement in cloth.
4 Moisture movement in vertical direction
4.1 Experiment
In this section, the moisture uptake process under gravity is measured using the gamma-spectrometer at National Research Council, Canada [11]. A gamma-spectrometer provides a non-destructive method for measuring moisture content distributions in materials. It detects the difference in gamma-ray attenuation caused by the difference in moisture content of the material [11,12]. By scanning the specimen, it is possible to measure moisture content distribution continuously.
The experimental setup is shown schematically in Figure 4. The thickness of clothing material being only 0.25 mm, the gamma-ray attenuation was too small to be detected accurately. Therefore multiple layers separated by 1 cm air columns were assembled to form a test specimen and twenty was found to be
enough after conducting several preliminary tests. A volume of 150 cm3 of distilled water was placed in a
width 40mm and length 100 mm hung on a bar were immersed to a depth of 1 cm into the water. The temporal profile of the moisture content was measured at seven heights successively differing by 0.5 cm (arbitrarily designated as -0.8cm to -3.8 cm on the coordinates of the gamma-ray equipment); the origin of coordinate, y, was set at the water surface as shown in Figure 4. The live time [11] for each attenuation measurement was 30 s and the interval between successive measurements in any series was approximately 45 s.
The results from the measurements are shown in Figure 5. The moisture content (degree of saturation) measured at y = -0.8 cm shows a sharp rise just after t = 0 and reaches near saturation. On the other hand, the data measured at y = -3.8cm, the farthest point from the water surface, starts rising at around t = 20 min and rises more slowly. At y = -3.8 cm and -3.3 cm, the moisture contents were measured for 60 min, while at the other points for 30 min only. The scatter in the measured values of the moisture content (degree of saturation) amounts to 10 % of saturation at the maximum and is not insignificant. However, since the fluctuation seems random, the averaged value can be used for subsequent analyses of the data.
4.2 Analysis
Based on the equations (5), the degree of saturation u ( = w/a, w: moisture content, a: porosity) at each time is calculated numerically. The hygrothermal parameters such as equilibrium relationship (sorption isotherm) and moisture diffusivity were determined as follows.
4.2.1 Equilibrium relationship
Many sets of experimental data on the equilibrium relationship of cloth are available from various sources. Very few measurements, however, are done for the moisture content near saturation, the important region in the present analysis. In this study, the equilibrium relationship near saturation was determined by making use of the moisture content distribution in the water uptake experiment by letting it to proceed to an equilibrium state. At the equilibrium state, no moisture flows if the evaporation from the surface of the cloth is negligible, because the uptake moment is balanced with the gravitational force. Thus, by setting the left hand side of equation (1-b) zero, the water chemical potential is given as follows.
y
g
=
μ
(8)The moisture content distribution obtained from the scanning during t = 76 to 109 min was regarded as that of equilibrium state. (See Figure 6.) The experimental setup and the method are the same as in section 4.1. With the use of the data and equation (8), the equilibrium relationship as shown in Figure 7 was obtained. An approximate curve of the data is also drawn in Figure 7. In the strictest sense, the distribution was not in an equilibrium state; the rate of moisture evaporation from the cloth is not zero, although the evaporation rate became smaller in the course of time because the humidity ratio around the specimen became higher. In this study, as mentioned earlier, at the equilibrium state, it is assumed that the influence of the evaporation can be neglected. Using the gradient of the approximation function in Figure
7 (
∂ /
μ
∂
u
), the moisture conductivity is obtained from equation (4). The parameters determinedthrough these procedures are summarized in Figure 8. μ
λ
'
4.2.2 Comparison with experiment
As shown in Figure 5, the calculated moisture contents agree well with the measured results from time t = 0 to 30 min. As for y = -0.8 cm, the calculated moisture contents are lower as a whole and there still
seems to have some room for improvement in determining the parameters for the high moisture content region. Furthermore, the calculated values are too low after t = 30 min at the points far from the water surface, e.g. y = -3.8 cm. This seems to be due to the overestimation of the evaporation from the cloth. In the present calculation, the humidity ratio of the ambient air is given as constant (19.5°C, RH 70%: measured values in the test chamber), while in reality the humidity ratio around the cloth seems to have increased due to the evaporated moisture in the course of time. The calculated result in which the evaporation is neglected is shown in Figure 9. Even at the points far from the water surface, the calculated values agree well with the measured after t = 50 min. Therefore if the humidity ratio of the ambient air is known accurately, the calculated values would become closer to the measured results.
4.2.3 Width of gamma-ray beam passing through specimen, an additional
correction
The source and detector of the gamma-ray equipment are 60 cm apart and the gamma-ray from the source not being precisely collimated diverges gradually until it reaches the detector. In the present case, the specimen is many layers of the same material, and the scanned area in the material changes depending on the distance from the gamma-ray source. Figure 10 shows the schematics of the process. In measuring a specimen whose absorption coefficient distribution is homogeneous or changes linearly in the direction of scanning, the difference between the measured values and the true values at the central part of the measured area will be very little. However, for a specimen with a non-linearly distributed absorptivity, the distance between the source and the specimen will have a significant influence on the results.
From this viewpoint, the relationship between the distance from the source and the width of the beam is estimated by scanning water in a box vertically across a water surface with the distance from the source varied, through the clear contrast of absorptivity between air and water. As shown in Table 1, the scan tests are conducted three times with the different distances from the source to the specimen (near, middle, far). The specimen is an air-distilled water system in a plexiglas box (size: 25 x 125 x 100 mm).
The results are shown in Figure 11 by gamma-ray counts. The larger counts imply that the gamma-ray absorption of the specimen is smaller; in this case the largest count is associated with the air and the smallest the water. Intermediate counts between those for the air and the water are observed (hereafter this region in the specimen is called ‘intermediate zone’), and the larger the distance of the specimen from the source, the wider the intermediate zone becomes, ranging from 6 mm (in ‘near’ case) to 10 mm (in ‘far’ case). The intermediate zone is determined with the procedure shown in Figure 12. As shown schematically in Figure 13, the width of the intermediate zone should coincide with the height of the irradiated area in the specimen.
The relationship between the position of the specimen z and the height of the irradiated area (the intermediate zone) is obtained as shown in Figure 14. In Figure 14, the height of the source window is also plotted (See Table 1). A straight line can be drawn which gives a good fit with the three measured points and also the point indicating the source window. The approximation function which gives the relationship between the height of the irradiated area h (mm) and the position of the specimen z (mm) from the source is as follows.
h = 0.0192z + 4.0751 (9)
By using equation (9), the minimum and maximum heights of the gamma-ray beam as it traverses through a distance of 5.44 cm and 32.76 cm are estimated to be 0.52cm (Sheet No.20 in Figure 10) and 1.07cm (Sheet No.1) respectively. The obtained data must be the summation over all 20 sheets whose scanned width is a function of distance from the gamma-ray source. Using the equation (9), the calculated results in Figure 9 were modified and are shown in Figure 15 with the results not modified. The difference between results modified and not modified is small as a whole, although the rise from the
initial moisture content is more gradual.
5 Conclusions
The liquid moisture movement in the cloth is investigated for a broadcloth made of cotton experimentally and analytically.
In the experiment, the change in moisture content distribution was measured in liquid moisture movement processes in the horizontal direction by gravimetric method and vertical direction by using gamma-ray spectrometer. As the results, the moisture movement was clearly slower in vertical direction due to the gravity effect.
The experimental data were used to optimize the liquid moisture diffusivity and the sorption isotherm, using a diffusion model. Subsequent simulations using the optimized values gave reasonable agreement with the entire set of data in two series of experiments; one that includes the horizontal movement and the other gravitational effects. Hence the optimized values are considered representative of the broadcloth investigated here. Also the diffusion model can be used for further hygrothermal analysis.
The influence of the width of gamma-ray to the measured values in the vertical moisture movement was studied by additional tests, and it was shown the influence was not significant in the present case.
Acknowledgement
This research was partially supported by the Ministry of Education, Science, Sports and Culture of Japan, Grant-in-Aid for Encouragement of Young Scientists, 10750438, 1998, and by The Kyoto University Foundation. Thanks are offered to Mr. R. Marchand, Dr. M. Nofal and Mr. J. Lackey for help with the measurement using gamma-spectrometer at National Research Council, Canada.
References
[1] Fanger, P.O. 1970. "Thermal Comfort", McGraw-Hill.
[2] Gagge, A.P., Stolwijk, J.A.J. and Nishi, Y. 1971. "An effective temperature scale base on a simple model of human physiological regulatory response", ASHRAE Transactions, 77: 247-262.
[3] ASHRAE Handbook, Fundamentals. 2005, Chapter 8.
[4] Takada,S. Hokoi,S. Kawakami,N. and Kudo,M. 1999. "Effect of Sweat Accumulation in Clothing on Transient Thermophysiological Response of Human Body to the Environment", Proceedings of Building Simulation '99, Kyoto, Japan: 385-392.
[5] Takada,S. Hokoi,S. Kawakami,N. and Kudo,M. 1999. "Experimental Study on Thermo-physiological Response of Clothed Subjects Exposed to Thermal Transients - Sweating and Evaporation Process -", Journal of the Human-Environment System 2,1: 57-67.
[6] Takada,S. Hokoi,S. and Umeno,T. 1997. "Heat and Moisture Movement in Clothes", Proceedings of CIB W40 meeting, Kyoto, Japan: 277-290.
[7] Yoneda, M. and Niwa, M. 1992. "Measurement of In-Plane Capillary Water Flow of Fabrics", SEN-I GAKKAISHI 48, 6: 288-298. (in Japanese)
[8] Yoneda, M. and Niwa, M. 1993. "Measurement of Water Absorption Perpendicular to Fabric Plane by Pressure Sensor Method and its Analysis", SEN-I GAKKAISHI 49, 8: 243-253. (in Japanese)
[9] Miller, B. and Tyomkin, I. 1984. "Spontaneous Transplanar Uptake of Liquids by Fabrics", Textile Research Journal 54: 706-712.
[10] Nielsen, A. F. 1972. "Gamma-ray attenuation used for measuring the moisture content and homogeneity of porous concrete ". Building Science 7, H. 4, S. 257- 263.
[11] Kumaran,M.K. and Bomberg,M. 1985. "A gamma-spectrometer for determination of density distribution and moisture distribution in building materials", Proceedings of the International Symposium on Moisture and Humidity, Washington, D.C.: 485-489.
[12] Kumaran,M.K. 1986. "Gamma-spectroscopic Determination of Moisture Distribution in Medium-density Glass Fibre Insulation", Building Research Note BRN 242, National Research Council Canada: 1-13.
[13] Descamps, F. 1990. "Moisture content measurement using gamma ray attenuation", Research Report, Katholieke Universiteit Leuven, Laboratorium Bouwfisica.
[14] Matsumoto,M. Hokoi,S. Yamamoto,M. 1985. "Experimental Study of Water Diffusivity –Effect of Gravity-", Summaries of Technical Papers of Annual Meeting, Architectural Institute of Japan D: 889-890 (in Japanese).
[15] Matsumoto, M. Iwamae, A. 1988. "An Analysis of Temperature and Moisture Variations in the Ground under Natural Climatic Conditions", Energy and Buildings 11, 221-237.
[16] Matsumoto, M. Hokoi, S. Hatano, M. 1999. "Modeling of Freezing and Thawing Processes in Building Materials, Proceedings of Building Simulation '99, Kyoto, Japan: 537-544.
[17] Krus, M. 1996, "Moisture Transport and Storage Coefficients of Porous Mineral Building Materials" Theoretical Principles and New Test Methods, 4. Determination of storage characteristics: 41-51, Fraunhofer IRB Verlag.
[18] Hansen, M. H. 1998. "Retention Curves Measured Using Pressure Plate and Pressure Membrane", Nordtest Technical Report 367, Danish Building Research Institute: 63.
[19] Morton, W.E., Hearle, J.W.S. 1962. "Physical properties of textile fibres", The Textile Institute, Heinemann: London: 169.
28
29
30
31
32
33
34
35
36
37
38
0
10
20
30
40
50
60
70
80
90
100
110
120
Time [min]
Temp
er
atur
e o
f Skin u
nder Clothing
[
℃
]
25
℃40%rh
35
℃80%rh
25
℃40%rh
uniform absorption or concentrated absorption
uniform absorption
concentrated absorption (wet)
concentrated absorption (dry)
Figure 1 Simulated skin temperature under clothing (Influence of liquid moisture diffusion to body temperature regulation system)
x 0 X 0 .5 0 S p ec im en [c m ] S u p p o r t S ta nd 1 0 c m G .L . R es er vo ir W a ter 1 5 c m 1 0 c m
0 0.1 0.2 0.3 0.4 0.5 0.6 0.7 0.8 0.9 1 0 0.5 1 1.5 2 2.5 3 3.5 4 4.5 Position x, cm Degree of saturation u, (-) 100s(Exp.) 200s(Exp.) 300s(Exp.) 400s(Exp.) 600s(Exp.) 100s(Cal.) 200s(Cal.) 300s(Cal.) 400s(Cal.) 600s(Cal.) 100[s] 200[s] 300[s] 400[s] 600[s]
Figure 3 Comparison of experimental and analytical results for horizontal moisture movement process; the dotted lines with markers show experimental results and the continuous lines are obtained from the calculation. Separator Bar Cloth gamma- ray 0 Water y N=1 2 - - - 20
Figure 4 Experimental setup (Moisture movement in vertical direction)
0
0.1
0.2
0.3
0.4
0.5
0.6
0.7
0.8
0.9
1
0
10
20
30
40
50
6
Time, min
Degree of saturation u, (-)
y=-3.8
y=-0.8
y=-1.3
y=-1.8
y=-2.3
y=-2.8
y=-3.3
0
Figure 5 Change in moisture distribution with time at different heights from the water surface; the points represent the experimental data and the continuous curves the calculated results. In these calculations the evaporation rate is included. (Position y is in cm.)
-6
-5
-4
-3
-2
-1
0
0
0.2
0.4
0.6
0.8
1
Degree of Saturation u, (-)
Position y, cm
Figure 6 Distribution of moisture content in equilibrium state; This was obtained by scanning the specimen vertically from y = -0.8 cm to y = -5.6 cm at the interval of 0.2 cm. The scanning started at t = 76 min (y = -0.8 cm) and completed at t= 109 min (y = -5.6 cm).
-0.6
-0.5
-0.4
-0.3
-0.2
-0.1
0
0
0.2
0.4
0.6
0.8
1
Water chemical
potentia
l, J/kg
Experiment
Approximated
Degree of saturation u (-)
Figure 7 Equilibrium relationship (sorption isotherm)
0
0.0002
0.0004
0.0006
0.0008
0.001
0.0012
0.0014
0.0016
0.0018
0
0.2
0.4
0.6
0.8
1
Degree of saturation (-)
MC, kg/{(J/kg) m s}
0
0.1
0.2
0.3
0.4
0.5
0.6
0.7
0.8
0.9
1
GER, J/kg
D×10
5, m
2/s
D×10
5 u ∂ ∂ /μ
μ λ'Moisture
Conductivity
(MC)
Gradient of
Equilibrium Relationship
(GER)
Figure 8 Parameters used in calculation
Figure 9 Change in moisture distribution with time at different heights from the water surface; the points represent the experimental data and the continuous curves the calculated results. In these calculations the evaporation rate is set equal to zero. (Position y is in cm.)
Cloth sheet No.1 2 3 ….. 20 Cloth
1.07cm
0.52cm Source
Irradiated area
Detector
57.3 32.8 5.4
z
y
[cm]
Figure 10 Schematics of gamma-ray propagation; The dimension of the source window is 12 (depth) x 4 (height) mm and the detector window is 25 x 25 mm. The height of the irradiated area is determined from Equation (8).
0
0.1
0.2
0.3
0.4
0.5
0.6
0.7
0.8
0.9
1
0
10
20
30
40
50
6
Time, min
Degree of saturation u, (-)
y=-3.8
y=-0.8
y=-1.3
y=-1.8
y=-2.3
y=-2.8
y=-3.3
0
9000
10000
11000
12000
13000
14000
15000
235
240
245
250
255
P osition y [m m ]
Counts [times/
s
N ear
M iddle
Far
A ir
W ater
Figure 11 Gamma-ray counts obtained through scanning across water surface in vertical direction (y)
9000
10000
11000
12000
13000
14000
15000
235
240
245
250
255
P osition y [m m ]
Counts [times/
s
A ir
W ater
S tep 1: D eciding counts for air side
S tep 1: D eciding counts for w ater side
S tep 2: D eterm ining interpolation
line passing through data points
in interm ediate zone
S tep 3: D eciding tw o boundaries
of interm ediate zone
Interm ediate zone
Counts y Counts y Counts y water air h h h h
Figure 13 Schematics of determining height of irradiated area (h) by intermediate zone
h = 0.0192z + 4.0751
R
2= 0.9993
0
2
4
6
8
10
12
0
50
100
150
200
250
300
350
P osition z [m m ]
Height of irradiated area
h
H eight of source w indow M easured M easured M easuredN ear
Far
M iddle
0
0.1
0.2
0.3
0.4
0.5
0.6
0.7
0.8
0.9
1
0
10
20
30
40
50
6
Time, min
De
gree of satura
tion u, (-)
y=-3.8
y=-0.8
y=-1.3
y=-1.8
y=-2.3
y=-2.8
y=-3.3
0
width of beam considered
width of beam not considered
Calculation
Figure 15 Influence of modification considering width of gamma-ray beam passing through specimen. Change in moisture distribution with time at different heights from the water surface; the calculated results. In these calculations the evaporation rate is set equal to zero. (Position y is in cm.)
Table 1 Details of vertical scan test of air-water system
Position of box Average of counts for water layer Average of counts for air layer Interpolation functions for intermediate zone Position of lower boundary (water layer) Position of upper boundary (air layer) Height of intermediate zone
[mm] [times/s] [times/s] I: counts[times/s]
y: position[mm] yw [mm] ya [mm] (yw–ya) [mm] Near z = 45 to 70 9410.29 (y = 249 to 253) 14145.38 (y = 237 to 242) I = -900.78 y + 232938 248.15 242.89 5.26 Middle z = 170 to 195 9410.27 (y = 250 to 253) 14155.56 (y = 237 to 241) I = -625.27 y + 165251 249.24 241.65 7.59 Far z = 295 to 320 9447.94 (y = 251 to 253) 14156.47 (y = 237 to 240) I = -473.9 y + 128129 250.43 240.50 9.94