Publisher’s version / Version de l'éditeur:
International Journal of Pipeline Systems Engineering and Practice, 1, 4, pp. 156-172, 2010-11-01
READ THESE TERMS AND CONDITIONS CAREFULLY BEFORE USING THIS WEBSITE.
https://nrc-publications.canada.ca/eng/copyright
Vous avez des questions? Nous pouvons vous aider. Pour communiquer directement avec un auteur, consultez la
première page de la revue dans laquelle son article a été publié afin de trouver ses coordonnées. Si vous n’arrivez pas à les repérer, communiquez avec nous à PublicationsArchive-ArchivesPublications@nrc-cnrc.gc.ca.
Questions? Contact the NRC Publications Archive team at
PublicationsArchive-ArchivesPublications@nrc-cnrc.gc.ca. If you wish to email the authors directly, please see the first page of the publication for their contact information.
NRC Publications Archive
Archives des publications du CNRC
This publication could be one of several versions: author’s original, accepted manuscript or the publisher’s version. / La version de cette publication peut être l’une des suivantes : la version prépublication de l’auteur, la version acceptée du manuscrit ou la version de l’éditeur.
For the publisher’s version, please access the DOI link below./ Pour consulter la version de l’éditeur, utilisez le lien DOI ci-dessous.
https://doi.org/10.1061/(ASCE)PS.1949-1204.0000064
Access and use of this website and the material on it are subject to the Terms and Conditions set forth at AC pipe in North America: inventory, breakage and working environments
Hu, Y.; Wang, D. L.; Cossitt, K.; Chowdhury, R.
https://publications-cnrc.canada.ca/fra/droits
L’accès à ce site Web et l’utilisation de son contenu sont assujettis aux conditions présentées dans le site LISEZ CES CONDITIONS ATTENTIVEMENT AVANT D’UTILISER CE SITE WEB.
NRC Publications Record / Notice d'Archives des publications de CNRC:
https://nrc-publications.canada.ca/eng/view/object/?id=eb70be45-a18f-4639-a04e-dc44d1d0a47f https://publications-cnrc.canada.ca/fra/voir/objet/?id=eb70be45-a18f-4639-a04e-dc44d1d0a47f
http://www.nrc-cnrc.gc.ca/irc
AC pipe in N ort h Am e ric a : inve nt ory, bre a k a ge a nd w ork ing
e nvironm e nt s
N R C C - 5 3 5 3 5
H u , Y . ; W a n g , D . L . ; C o s s i t t , K . ; C h o w d h u r y , R .
N o v e m b e r 2 0 1 0
A version of this document is published in / Une version de ce document se trouve dans:
International Journal of Pipeline Systems Engineering and Practice, 1, (4), pp. 156-172, November 01, 2010, DOI: 10.1061/(ASCE)PS.l949-1204.0000064
The material in this document is covered by the provisions of the Copyright Act, by Canadian laws, policies, regulations and international agreements. Such provisions serve to identify the information source and, in specific instances, to prohibit reproduction of materials without written permission. For more information visit http://laws.justice.gc.ca/en/showtdm/cs/C-42
Les renseignements dans ce document sont protégés par la Loi sur le droit d'auteur, par les lois, les politiques et les règlements du Canada et des accords internationaux. Ces dispositions permettent d'identifier la source de l'information et, dans certains cas, d'interdire la copie de documents sans permission écrite. Pour obtenir de plus amples renseignements : http://lois.justice.gc.ca/fr/showtdm/cs/C-42
AC Pipe in North America: Inventory, Breakage and Working
Environments
Yafei Hu1, Dunling Wang2, Karen Cossitt3, and Rudaba Chowdhury4
Abstract: Asbestos cement (AC) pipe constitutes a significant portion of the water
distribution pipes still in service in many North American cities. To understand the state of the AC pipe inventory in North America, a survey was conducted of utilities with a large percentage of AC pipes in their water distribution systems. The survey included questions about pipe inventory, breakage, working environments, rehabilitation/ replacement practices, and safety- and health-related management practices. This paper summarizes data from the inventory, breakage and working environment portions of the survey. The survey obtained relatively complete inventory information for pipe length, size, years of service, breakage condition, and water quality. Information about the nature of the soils surrounding AC pipes was limited. The survey indicated that utility managers’ perceptions of water and soil environments were not always consistent with water and soil test results. Survey data analysis identified pipe age, water quality, and pipe size as important factors contributing to the failure of AC pipes in North America.
1
Research Officer, National Research Council, Suite 301, 6 Research Drive, Regina, SK, Canada S4S 7J7 (corresponding author). E-mail: Yafei.Hu@nrc-cnrc.gc.ca
2
Research Officer, National Research Council, Suite 301, 6 Research Drive, Regina, SK, Canada S4S 7J7. E-mail: Dunling.Wang@nrc-cnrc.gc.ca
3
Senior Engineer, City of Regina, 2476 Victoria Avenue, Regina, SK, Canada S4P 3C8. E-mail: kcossitt@regina.ca
4
Subject headings: Water pipelines; Deterioration; Working conditions; Municipal water;
Introduction
Asbestos cement pipe was first introduced in North America in 1929 when an AC pipe manufacturing machine was installed by Johns-Manville Corporation in Waukegan, Illinois. AC pipe became a common choice for potable water main construction from the 1940s to the 1970s. The use of AC pipe was largely discontinued in North America in the early 1980s due to health concerns during the manufacturing process and the possible release of asbestos fibers from deteriorated pipes. However, AC pipe is still a significant portion of the water distribution systems in many North American cities. It has been estimated that in the early 1990s, 12 to 15% of water distribution pipelines in the United States and Canada are comprised of AC pipes (Kirmeyer et al. 1994; Rajani and McDonald 1995). In some cities, AC pipes comprise the majority of the pipe length in service and, due to their age, require a proactive management plan.
AC pipe was made of a mixture of asbestos fibers and Portland cement, with or without silica. Major oxides in Portland cement, when combined with water and silica, if any, cause a chemical hydration reaction that forms a hardened substance. The complex process of hydration yields a variety of products, including free lime (calcium hydroxide, Ca(OH)2) in the form of thin plates, calcium silicate hydrates and other hydrates. Like pipes made of other materials, AC pipes deteriorate with time. The deterioration is caused by the water conveyed inside the pipes and the soil environment outside the pipes.
AC pipes are known to deteriorate when conveyed water has aggressive chemical characteristics (Eick 1960). Soft and acidic water attacks AC pipe material by leaching lime and calcium silicate hydrates. Strong acidic conditions are relatively rare in the operation of treated drinking water distribution systems. Carbonate and sulphate are the two main corrosion agents. Soft water with very low ion content (low carbonate and bicarbonate content) is aggressive to calcium hydroxide and results in leaching of calcium hydroxide from AC pipe material and a consequent reduction in mechanical strength (Carde and Francois 1997). Sulphates react with calcium silicate hydrate, the main strength-giving mineral of the cement matrix, to form a product that has a much lower strength. Also, sulphates can react with various minerals in the cement to form compounds of greater volume, causing swelling and the subsequent disintegration of the cement matrix (Nebesar and Riley 1983). Key parameters for identifying water aggressiveness include low pH, alkalinity and calcium hardness, as well as high sulphate. An aggressiveness index indicates whether a balance exists between pH, alkalinity and calcium hardness in the water (AwwaRF and DVGW-Technologiezentrum Wasser 1996).
AC pipe is also subject to external corrosion due to aggressive soil environments. Two parameters are listed in ASTM and AWWA standards that can be used to estimate the aggressiveness of soils surrounding AC pipes: acidity and sulphate concentration (ASTM 1998; AWWA 2003). Similar to the deterioration by acidic water and sulphate from inside the pipes, acidic soils can damage AC pipes by leaching lime and calcium silicate hydrates from external pipe surfaces into the surrounding soil. Sulphates in soils also
react with calcium silicate hydrate and other minerals in the cement and cause a reduction in strength or disintegration of the cement matrix (Jarvis 1998).
In addition to deterioration due to chemical attack, AC pipes may also be subjected to adverse construction and operational factors. For example, AC pipes are subjected to loads from backfill weight and, in many cases, roadway traffic. Frost action, soil movement, especially due to swelling and shrinkage of expansive soils, and possibly thermal forces resulting from the differences between the temperature of the water in the pipes and surrounding soils (Rajani and Zhan 1996) can also subject pipes to external loading. External loading can result in bending forces and severe stresses in AC pipes.
Variation in the temperature of conveyed water causes AC pipe to contract and expand and, therefore, tension and compression in the pipe if the movement of the pipe is restricted by surrounding soils. When the water temperature in the pipe falls below 0o C, AC pipe may break due to volume expansion of water as it freezes. Thus, water temperature is a factor that needs to be considered for understanding pipe behaviour.
Although the failure of an AC pipe may be due to a single factor, in most cases, AC pipe breakage occurs as a result of a combination of several factors as the structural integrity of the pipes is gradually compromised. The eventual effect of the combined factors has been witnessed by some utilities with a steadily increased breakage frequency. For instance, during the ten-year period from 1995 to 2004, the City of Regina, SK, Canada, had an average of 27 breaks/100 km/year for AC pipe, which was more than double the
average rate of 13 breaks/100 km/year in the previous 10-year period (1985 to 1994) (Hu and Hubble 2007).
Facing increased pipe failure rates and other challenges such as public demand for higher levels of service and accountability, more stringent water quality and environmental regulations, many water utilities are eager to develop short-term plans and long-term strategies to manage their AC water main assets. The ability to assess and map the present condition of water mains and to forecast future failure is key to the development of such strategies.
To understand the current condition of the AC pipes in North America and the practices used to manage them, a comprehensive survey was carried out of 20 utilities in the United States and Canada. The survey was designed to collect detailed data and information related to current usage and operating/management practices for AC pipes. It included questions about pipe inventory, pipe breakage, pipe working environments, current management practices for AC pipe condition assessment and repair/rehabilitation and replacement procedures, and safety and health issues resulting from repair/rehabilitation and replacement processes. The survey was part of a comprehensive study of the long term performance of AC pipes. This paper summarizes that part of the survey results pertaining to AC pipe inventory, breakages and pipe working environments. The pipe breakage data are analyzed and correlated to pipe inventory and working environment. The rest of the survey results, along with other aspects of the research project, will be published as they become available.
Utilities Participating in the AC Pipe Survey
The survey was sent to 20 utilities that had expressed interest in participating. The participating utilities generally have relatively large inventories of AC pipes in their water distribution systems. Figure 1 shows the geographic location of the utilities that completed the survey. In the United States, most of the survey respondents are located in the western and Pacific states, and two are in New Jersey and Pennsylvania. There are no respondents in other eastern states, or the central and southern states. In Canada, all the participating utilities are located in western Canada, as most of the AC pipes still in use by utilities are found in the west.
Although the survey respondents were not evenly distributed across North America, they do cover several regions with different climatic and soil conditions. Tables 1 and 2 summarize the climate zones and the predominant type of soil environments for the 20 participating utilities. The climate zones range from sub-arctic to arid/semi-arid. The broad soil groups include high-expansive (HE) clay, low-to-medium-expansive (LME) clay, silt, sand/gravel, and peat.
Survey Results
AC pipe inventory
Figure 2 compares the results of the survey with two previous surveys in terms of AC pipe length and AC pipe length as a percentage of total water distribution system length.
A 1992 survey of 1097 utilities in the United States indicated that AC pipes accounted for 15.1% of the total water distribution systems surveyed. The survey was conducted by the American Water Works Association (AWWA) Water Industry Data Base (WIDB) and the American Water Works Association Research Foundation (AwwaRF) (Krimeryer et al. 1994). A later survey of 338 utilities by AWWA confirmed this percentage (AWWA 2004). A similar survey conducted in 1993 for 21 Canadian cities found that AC pipes accounted for 12% of water distribution systems (Rajani and McDonald 1995). The current survey determined that, of the 37,626 km of water distribution pipe operated by the utilities that completed the survey, 43.2% (or 16,238 km) is AC pipe. This high percentage is due to the fact that this survey targeted utilities with high percentages of AC pipes. Thus, the participating utilities have a significant interest in the management of AC water distribution pipes.
AC pipe age
Figure 3 shows the percentage of AC pipe in each five-year age group for the participating utilities. The corresponding percentages of water mains for all materials are also shown. AC pipe percentages vary significantly within each age group. Less than one percent of AC pipes have been in service for more than 60 years (i.e., since before 1948). The installation of AC pipes increased during the post-war construction boom and peaked from 1963 to1967 (i.e., the 40-45-year age group). About half of all AC pipes were installed during this period. There was another increase in the late 1960s that peaked in the late 1970s, just before the gradual phase-out of new AC pipe installation in the early
1980s. Almost 50% of all other pipe types have been in place less than 30 years, meaning that these pipes (e.g., polyvinyl chloride) have an average service age less than AC pipes.
Pipe size
Figure 4 shows the distribution of AC pipe sizes as a percentage of overall AC pipe length. 150 and 200 mm diameter pipes comprised 74% of the AC water mains in the surveyed distribution systems. Six percent of AC pipes were less than 150 mm. Thus, AC pipes with diameters less than 200 mm comprised 80% of the AC water main distribution systems. AC pipe in this diameter range is more vulnerable to uneven support and is the most problematic pipe size for most utilities (Mordak and Wheeler 1988).
Pipe type
There are mainly two types of AC pipes based on the materials used and the manufacturing processes: Type I and Type II (AWWA 2003). Unlike Type I AC pipes, silica was added to the mixture of asbestos fibers and Portland cement during the manufacturing of Type II AC pipes. Due to this difference, free lime in Type I and Type II AC pipe represents 15.5% and 0.4% of the total weight, respectively (Marks and Hutchcroft 1968). As free lime content is a critical factor that affects AC pipe corrosion, the corrosion-resistance of the two types of AC pipes is different (Manson and Blair 1962). Therefore, information about the type of pipe installed is useful for predicting long-term performance of AC pipes. Unfortunately, none of the utilities surveyed were able to provide pipe type information. As Type II AC pipes were introduced in the mid 1930s (Marks and Hutchcroft 1968), the vast majority of AC pipes in service in North
America are likely Type II, as less than 1% of AC pipes reported in the survey were older than 60 years (Figure 3).
Pipe class
Three classes of AC pipes were manufactured - Classes 100, 150 and 200 (AWWA 2003). These classes have different minimum burst, crush, and flexural strength requirements. Class 100 has the least minimum strength requirement and Class 200 has the highest. Of the 20 participating utilities surveyed, only five utilities provided AC pipe class information, and the percentage of each of the classes is shown in Figure 5. Class 150 is the predominant class, constituting 75% of the total AC pipes, while Class 100 is the smallest class with only 2%.
Pipe manufacturer
AC pipes were produced by a number of different manufacturers and pipe specifications allowed for a range in materials in the pipes. Manufacturing processes and chemical compositions varied between manufacturers, as well as over time by the same manufacturer. As the manufacturing processes and chemical compositions affect pipe chemical and mechanical properties, it is very useful to know the name of the manufacturer of a given AC pipe. Six utilities, representing 35% of AC pipes in use by the 20 participating utilities, provided information linking AC pipe in service to the manufacturer. Manufacturers identified include Johns-Manville, Certain Teed, Capco and Atlas. Based on the data reported, Johns-Manville was the biggest supplier with 29% of all AC pipes that could be traced to a manufacturer. Other manufacturers were reported,
but the percentages identified varied from less than 1% to 8% (Figure 6). Fifty-eight percent of the AC pipes reported on by the six utilities could not be linked to a manufacturer. Some utilities indicated that some of their AC pipes were manufactured in Europe.
Pipe lining
Of the 18 utilities that responded to the lining survey, none reported having lined AC pipes in service. This indicates that lining was not a common practice for AC pipes in the United States and Canada.
AC pipe breakage
The survey questions sought information on the number of AC pipe breaks that occurred between 2002 and 2007 and on the mode of failure observed.
Breakage yearly variations
Figure 7 shows the average AC breakage rates for 18 utilities for the six years from 2002 to 2007 (two utilities did not provide break data). The average breakage rate of AC pipe varied from 3.2 to 4.7 breaks/100 km/year, which is comparable to a prior survey of 5.4 to 6.1 breaks/100 km/year by Rajani and McDonald (1995). The average breakage rate for all pipe materials (including AC) was about 8 breaks/100 km/year (Figure 7). This breakage rate for all pipe materials, for the 18 utilities in this study, is lower than the average breakage rates of 14.3 to 16.8 breaks/100 km/year reported for the United States (Krimeyer et al. 1994) and 21 breaks/100 km/year reported for Canada (Rajani and
McDonald 1995). This is understandable, as cast iron (CI) and ductile iron (DI) pipes typically have the highest breakage rates (Rajani and McDonald 1995) and the percentages of CI and DI pipe materials in the previous two surveys were higher than in this survey. The data reported in this study also reflect a general trend of a decreasing breakage rate for all pipe materials, which was not observed for AC pipes for the 18 utilities that provided data for this survey.
Breakage variations among utilities
Figure 8 shows the variations of the average breakage rates in the six years from 2002 to 2007 for the 18 utilities that supplied their break data. The average breakage rate varied significantly, from utility to utility, from as low as 1 break/100 km/year to as high as 29 breaks/100 km/year. The average breakage rate for all utilities was 4 breaks/100 km/year.
AC failure mode
Failure mode can be used to identify the factors that contributed to failure. Pipe breaks can generally be divided into five categories: longitudinal, circumferential, corrosion-through-hole, split bell/bell shear, and joint failure (Makar et al. 2001). The terms circumferential and longitudinal indicate the orientation of a crack in the pipe, with circumferential being perpendicular to the axis of the pipe and longitudinal being along its length parallel to its axis. Circumferential breaks are typically the result of bending stress (beam failure) due to soil differential movement or inadequate bedding support, or thermal contraction (due to low temperature of the water in the pipe and the pipe surroundings) acting on a restrained pipe. Internal pressure and external loads (soil cover,
live loads caused by traffic and frost loads by frozen soils) are possible causes of longitudinal breaks. Chemical attack can also contribute indirectly to breaks by decreasing the wall thickness and making the pipe more susceptible to breaks. Corrosion-through-hole failure is due to chemical attack. Joint failure includes joint leaking, collar splitting, and joint disconnection. Most (75%) of the 20 participating utilities surveyed indicated that failure mode was traced, meaning that the utilities were usually able to match a failure event with a failure mode.
Figure 9 compares the failure mode of AC water mains to those of all other water pipe materials. The predominant failure mode for AC pipe was circumferential failure, while the predominant failure modes for all other water pipe materials were corrosion and circumferential failure. Some of the surveyed utilities also experienced failures due to improper installation, damage from other construction activities, pull-out of corporation stops (fittings used to connect the service lines to a water main), and other types of cracks.
AC pipe working environments
This part of the survey sought to gain an understanding of the working environments of AC pipes by acquiring information about conveyed water quality and surrounding soil properties.
Internal environment
The aggressiveness of conveyed water can be quantified using an aggressiveness index (AI) determined as follows (AWWA 2003):
AI = pH + log(A * H) (1)
where pH = pH of the water, A = total alkalinity in mg/L as CaCO3, and H = total hardness in mg/L as CaCO3. According to AWWA (2003), water is considered very aggressive, when AI < 10; moderately aggressive, when 10 < AI < 12; and non-aggressive, when AI > 12.
The survey obtained water quality information including total alkalinity, total hardness, and pH, and the AI value for each utility was calculated based on Equation (1). Figure 10 shows the AI values for 18 of the 20 utilities. Some utilities had more than one water source and, therefore, had more than one AI value. Four utilities had an AI value less than 10, thus highly aggressive conveyed water. Nine utilities had AIs between 10 and 12 - moderately aggressive water environments.
Water quality – sulphate content
According to AWWA (2003), sulphate content in conveyed water below 150 mg/L is not aggressive to AC pipe. When sulphate content is between 150 and 1500 mg/L, water is mildly aggressive to AC pipe. Figure 11 shows the soluble sulphate content for conveyed water for 18 utilities that responded to this question. Four utilities had sulphate contents greater than 150 mg/L and the highest value was 255 mg/L. Most utilities had low sulphate contents and therefore non-aggressive sulphate environments for AC pipes.
Water sources
To study the effect of conveyed water on AC pipe condition, water quality history should be known as much as possible. Eleven of the 20 surveyed utilities (55%) used surface water, and two (10%) used groundwater. The rest used both surface and groundwater, with ground water representing from 3 to 70% of the total raw water. Six utilities also indicated that their water supply shifted with time from groundwater to surface water. A change in water source is generally expected to bring a change in water quality. Even if a utility’s water source remained constant, some water quality parameters may have changed due to changes in water treatment processes.
Water temperature
Typical annual water temperature values in water distribution systems were obtained from 19 utilities, including the average annual temperature and the range of water temperatures (annual maximum and minimum). The average and the range of water temperatures varied significantly from one utility to another. One utility indicated that its water system experienced water temperature below 0o C at certain periods.
Water pressure
The annual average working water pressures in the water distribution systems were also collected from the 20 utilities. The average working pressures ranged from 360 to 600 kPa. However, water pressures in a water distribution system may vary due to factors such as pressure loss during flow or water hammer. The maximum pressure reported was 1550 kPa.
Soil environments
Given the critical role played by soils in the long-term performance of AC pipes, detailed information was requested from the participating utilities regarding the soil environments in which AC pipes were installed.
Soil type
Figure 12 shows the predominant soil types in which AC pipes were installed by the 20 utilities. The AC pipes in some utilities were exposed to more than one type of soil. Thirty percent of the utilities had pipe buried in high expansive (HE) clays and 45% in low to medium expansive (LME) soils. Expansive clays may affect the performance of AC pipes when soil moisture changes (Hu and Hubble 2007). Sixty percent of utilities had AC pipe buried in gravel, which may be problematic for AC pipe due to possible soil movement and resulting point loading. 15% of the utilities had AC pipe buried in peat. Peat soil may attack AC pipe because it tends to have high sulphate content (Little 2006). Responses for the “Other” category included “glacial tills” and “modified bedrocks”.
Bedding material
Because AC pipes are brittle, good bedding material and a well-prepared bedding environment is crucial for minimizing breakage. The best bedding environment consists of a layer of sand up to the centerline of the pipe and fine gravel up to about 150 mm above the top of the AC pipe. Figure 13 shows the typical bedding soils for AC pipe used by 20 utilities. Some utilities used more than one type of bedding soil for their AC pipes.
Half of the utilities (50%) used native soils for bedding. If native soils used for bedding are medium- to high-expansive clay soils, they may adversely influence the performance of AC pipe as mentioned in the previous sections. Response to the “Other” category included “decomposed granite”.
Buried depth
AC pipes located within a depth of 1.5 m below the ground surface and under roads may be subject to traffic loads (Moser 2001). For utilities in cold climates, freezing may be a factor affecting AC pipe failure (Rajani and Zhan 1996). The typical burial depth for AC pipe was collected from all 20 utilities. Most utilities (13 of 20) had AC pipes buried less than 1.5 m below the surface.
Soil pH
Figure 14 shows the soil pore water pH in the areas where AC pipes were installed for the seven utilities that provided this information. The average pH values were close to or above 6, indicating a non-aggressive soil environment (AWWA 2003). Three utilities reported pH values below 6, a range that may be aggressive to AC pipes.
Soil sulphate content
For neutral or basic soluble sulphates (pH ≥ 7), a sulphate content below 1000 mg/L mg/L indicates a non-aggressive soil to AC pipes, while a content greater than 2000 mg/L indicates a moderately aggressive soil according to AWWA (2003). For sulphate contents between these values, the soil environment is mildly aggressive to
− 2 4 SO − 2 4 SO
AC pipes. Where the pH of an acidic soluble sulphate is below 7, tests by Matti and Al-Adeebt (1985) concluded that AC pipes are vulnerable to sulphate attack depending on the free lime content, the type of cement used, and the permeability and density of the matrix. Type I pipe (high free lime) is the most vulnerable to sulphate attack, whereas Type II pipe (low free lime) has more resistance to moderate amounts of sulphates in the soil.
Figure 15 shows the sulphate content of soils surrounding AC pipes for the five utilities that responded to this question. Three utilities reported low sulphate contents. Two utilities experienced a great variation in sulphate contents, with an average close to 2000 mg/L and the maximum between 5000 and 10000 mg/L. These high sulphate contents constitute a mildly to slightly moderately aggressive environment to AC pipes (AWWA 2003).
Compared to the relatively complete internal water quality data, the information for external soil pH and sulphate environments was limited. While regular testing of treated drinking water quality is mandatory, soil and groundwater testing is not a regulatory requirement, even though the information is very important for evaluating AC pipe condition.
Utilities’ perception of water and soil aggressiveness
It is important to know the perception that a utility has towards possible effects of soil and water quality on its AC pipes as these may influence the measures that the utility adopts to manage its AC water distribution pipes.
When asked “Have you noticed whether the water quality in your water distribution system is aggressive to AC pipe?”, ninety percent of the utilities considered their conveyed water to be non-aggressive. This perception is in contrast to water quality data as shown in Figure 10, which indicates that of the 18 utilities that responded, four (or 22%) reported highly aggressive water and nine (or 50%) utilities had moderately aggressive water as defined by AWWA (2003).
Similarly, when asked “Have you noticed any soils that appears particularly aggressive to AC pipe in your water distribution system, twenty-five percent of utilities indicated aggressive soil environments around their AC pipes, while 65% of utilities perceived no threat to their AC pipes from surrounding soils. However, a high percentage of expansive clays and other adverse soil environments (such as peat) were identified by the utilities as shown in Figure 12, which are closely associated with soil movement and chemical corrosion. These results suggest a significant discrepancy between reported values affecting water and soil aggressiveness and the aggressiveness perceived by the participating utilities.
Analysis and Discussion
In previous sections, the survey results were summarized and the factors that may have contributed to the failure of AC pipes were described. This section correlates the factors with pipe breakage rate to help understand current conditions and forecast the future performance of AC pipes. The correlations are presented and discussed in the following sections.
Effect of pipe age on average pipe breakage rate
The age of a pipe (years since its installation date) is a measure of the time of exposure to environmental conditions and other factors affecting pipe deterioration. During this period of exposure, pipes are subjected to various environmental factors (conveyed water and soil conditions) that may degrade the pipe material. Figure 16 shows the average breakage rates of AC pipes versus the average pipe age for 18 utilities. Although the data are scattered, there is a general trend of increasing average breakage rate with increase in pipe age.
One utility had a particularly high breakage rate (29 breaks/100 km/year). Its water and soil are only moderately aggressive and the high breakage rate was attributed primarily to the soil movement under adverse soil conditions (HE clay) and climate conditions (Hu and Hubble 2007). This utility was excluded from the analysis related to the further chemical effect of water quality and soil pH and sulphate environments for the remaining correlation.
Comparison of internal environments versus average pipe breakage rate
Water quality
Aggressiveness index
Figure 17 plots the aggressiveness indexes (AIs) against the average breakage rates of AC pipes for the six years from 2002 to 2007 for 15 utilities. It can be seen that the breakage rate decreases with an increase in AI for AI values less than 10 (i.e., highly aggressive water) and the trend continues to an AI value around 11 (i.e., moderately aggressive water) and then levels out (from moderately aggressive water to non-aggressive water). The regression curve is also shown on the figure with a coefficient of determination (R2) value of 0.53, indicating a fairly good fit between the average breakage rate and the AI.
Hardness
The effect of the hardness of conveyed water was analyzed to determine whether the trend is similar to the effect of AI on average breakage rate. Figure 18 suggests that a general trend of higher breakage rate with lower hardness (soft) water can be observed with very soft water (below 100 mg/L) being detrimental to the pipes, but that there is not a consistent effect above that level (the data are scattered).
Alkalinity
The effect of the alkalinity of conveyed water on the average breakage rate of AC pipes was also assessed as shown in Figure 19. It suggests that a lower alkalinity causes an
increase in the pipe breakage rate, with very low alkalinity water (below 60 mg/L) being detrimental to the pipes. The effect is not consistent above 60 mg/L. A similar trend was observed by Conroy et al. (2005) with 55 mg/L bicarbonate alkalinity being suggested as a possible threshold in terms of lime leaching. According to their observation, pipes deteriorated much faster in water with alkalinity below the threshold than in water above the threshold.
Sulphate content
Figure 20 shows the breakage rates relative to the sulphate contents of conveyed water. Sulphate contents in most utilities fell into the non-aggressiveness range for AC pipes according to AWWA (2003). Only three utilities had sulphate contents higher than 150 mg/L (i.e., the conveyed water is mildly aggressive to AC pipe). The breakage rates versus sulphate content data are highly scattered. In some cases, utilities with sulphate content below 150 mg/L had higher breakage rates than those with sulphate content above 150 mg/L. There were only three utilities with sulphate values in the mildly aggressive range. For the utilities studied, the sulphate content of the conveyed water does not appear to be a factor controlling the breakage rate.
Water temperature change
Variation in the water temperature causes AC pipe to contract and expand and therefore exerts tensile and compressive forces on pipes when pipe deformation is restrained by surrounding soils. A large temperature change will cause a high thermal deformation and, therefore, possible pipe break. The total temperature variation (i.e., the maximum water
temperature minus the minimum water temperature) was plotted against the average breakage rate of the utilities. However, no obvious relationship between them was observed.
Water pressure
Water mains need to have sufficient strength to withstand the design (and operating) internal pressure for the class of pipe specified and have a margin of safety against failure. However, as pipe deteriorates, the internal pressure-carrying capacity of the water main decreases and the safety margin is reduced. Therefore, it is expected that working pressure values, especially the maximum working water pressure, will affect pipe breakage rates. A general increase in pipe breakage rate was observed with an increase in maximum working water pressure. However, the data are scattered, especially for high water pressures.
Effect of external soil environments on average pipe breakage rate
Chemical environments
Only seven utilities provided soil pore water pH data (Figure 14) and each of the averages were in a range between 6.1 and 8.2. When the pore water pH value was above 6, the soils were not considered to be corrosive. Therefore, there was no need to plot the soil pore water pH against the pipe breakage rates. There were insufficient data to assess the effect of soil suphate content on the average pipe breakage rates as only two utilities’ soil sulphate content values were mildly or moderately aggressive to AC pipes (Figure 15).
Compared to the relatively complete internal water quality data, utilities did not seem to assign a high degree of importance to collecting information about soil conditions. While regular testing of treated drinking water quality is mandatory, soil testing is not a regulatory requirement, even though the information is important for evaluating AC pipe external working environments. Due to the low number of responses regarding soil aggressiveness (pH and sulphate content), it was not possible to assess the effect of soil aggressiveness on pipe breakage rates.
Physical environments
Apart from the chemical effects of the soil environment, structural failure can often occur as a consequence of mechanical stress on pipes. The physical environments of buried pipes, which include burial depth (related to soil weight and live load) and cold weather (related to frost load), can cause pipe damage. External loads can also induce bending of the pipes, which is a common cause of circumferential pipe failure. Circumferential failure accounts for 70 percent of AC pipe failures. “Other” and “unknown” were listed for 11 and 8 percent, respectively, and some of them may be circumferential (see Figure 9). Other conditions that can cause bending include soil movement, especially in expansive clays, which may lead to uneven support of AC pipes buried in the soils, and eventual failure due to high bending moments.
Most of the surveyed utilities reported having AC pipes buried less than 1.5 m below the ground surface and AC pipes located in this depth range under roads are subject to traffic loads (Moser 2001). The average breakage rates were compared to the average burial depth for the AC pipes of the 13 utilities that had typical burial depths of less than 1.5 m. The data scatter was significant and no trend could be observed. Thus, for these utilities, the burial depth of the AC pipes does not appear to affect the breakage rates.
Freezing index
For utilities in cold climates, freezing can cause AC pipe failure (Rajani and Zhan 1996). Freezing index (FI) is usually used to measure the severity of the cold climates and is defined as the cumulative average daily temperature below 0° in a one-year period.
∑
∈ = n i i t T FI (2)where = the average daily temperature of day i, n = all the days with average temperature below 0°C in year t. The freezing indices for the seven surveyed utilities’ locations with freezing indexes greater than 50 °C • day were plotted against their corresponding average breakage rates. The data were fairly scattered and there were no freezing index data in a middle range (300 to 1000 °C • day) to support a correlation between the freezing indices and the average breakage rates. Utilities that are in climatic regions with large freezing indices and also depth of frost penetration have generally placed their water pipes at greater minimum burial depths. Hence, for utilities using those “best practices”, breakage due to depth of freezing is not necessarily a factor.
i
Soil movement
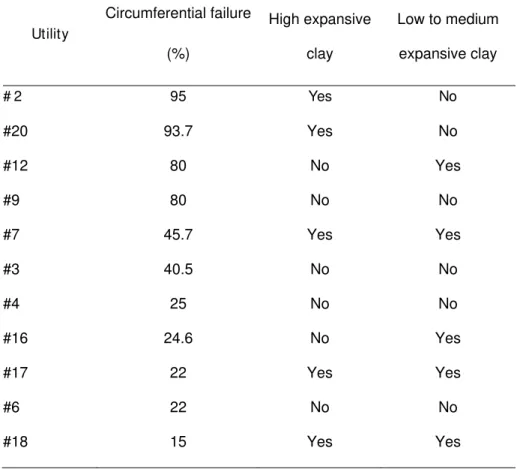
Pipe breaks can result from excessive loads imposed by changes in the soil itself. These may arise from consolidation or subsidence of the underlying soils or from expansion and shrinkage of soils around the pipe. Soil moisture content changes due to precipitation, evaporation, and transpiration. Variations in moisture content cause expansive clay soils to swell and shrink. Due to the heterogeneity of the fill and native expansive soils underlying the pipes, these moisture changes and soil movements can be uneven and thus induce bending moments in buried pipes. Table 3 shows the utilities with high expansive and low-to-medium expansive soils and their corresponding percentage of circumferential failures. It is evident that some utilities (e.g., #2, #20) with high expansive and/or low-to-medium expansive soils have a higher percentage of circumferential failures than those without such soils.
Small diameter pipes with smaller moments of inertia will have larger bending stresses and therefore, will have a higher likelihood of pipe failure. Figure 21 is a plot of the average breakage rates against the percentage of AC pipes with diameter of 150 mm and less for 18 utilities. A general increase in average breakage rate can be observed with the increase in percentage of small diameter AC pipes (from 30 to 60 percent). This indicates that soil movement is a contributing factor to the failure of AC pipes. The good correlation is also consistent with the high percentage of utilities with medium to high expansive soils (Figure 12).
For the soils with movement being associated with the moisture changes, climate zones and weather conditions (as shown in Table 1) are critical factors that influence soil moisture conditions. In order to assess the effect of soil movement, it is important to understand the soil and meteorological conditions. Utilities #17 and #18 have high expansive soils but low circumferential breaks (Table 3). The breakage characteristics for these two utilities need to be further analyzed based on their local soil and meteorological conditions.
Effect of combined internal and soil environments on average pipe breakage rate
Water quality (AI, hardness, alkalinity), pipe diameter and pipe age are three single factors that correlated well with the average breakage rate as indicated in previous sections. These factors were combined to study the correlation between different combinations of the factors and the average breakage rate.
Combined pipe age and AI
A multilinear regression between the average breakage rate and combined pipe age and AI yielded the following equation:
Average breakage rate = - 1.80*AI + 0.25*Age + 14.50 (3)
where Age = pipe age. The coefficient of determination R2 = 0.7, which was improved compared to the fittings between the average breakage rate and the single pipe age (R2 = 0.19, Figure 16) or the single AI (R2 = 0.53, Figure 17), indicating that AC pipe breakage rate was affected by more than one factor.
Combined pipe age and diameter
The alternative model obtained by replacing the AI term by the percentage of small diameter pipes has the following form.
Average breakage rate = 0.47*Age + 0.08*Percentage + 16.93 (4) where Percentage = percentage of AC pipes with diameter of 150 mm and less over the total AC pipe length in a utility. The coefficient of determination R2 = 0.4, which was also improved compared to the fittings between the average breakage rate and the single pipe age (R2 = 0.19, Figure 16) or the single pipe size (R2 = 0.32, Figure 21).
Combined AI, pipe age, and diameter
Multilinear fitting between the average breakage rate and all three factors (AI, pipe age, and pipe size) was also performed.
Average breakage rate = -1.72*AI + 0.27*Age + 0.01*Percentage
+ 12.7186 (5)
The coefficient of determination R2 = 0.7. Compared to the fitting between the average breakage rate and the combined two factors (age and AI, and age and pipe size), an inclusion of AI can improve the fitting, whereas the inclusion of pipe size does not have an effect on the fitting. This indicates the predominant effect of AI on the average breakage rate.
In summary, the average breakage rates of AC pipes for the 18 utilities that participated in the survey are related to pipe age, water quality and the soil environments. Good correlations were obtained between the average breakage rates and the pipe age, pipe diameter, and certain water quality parameters, including aggressiveness index. This
means that these parameters can be important contributors to AC pipe failures. Utilities should examine these factors when AC pipe condition assessments are planned so that effective management strategies can be implemented.
Weak correlation between soil environmental parameters and pipe breakage rate from this survey may be due to insufficient data. More information is needed to assess the effect of soil pore water pH and soil sulphate content.
Also, the regression fitting for combined multiple factors was performed using linear relationships only. Most of the relationships between the average breakage rate and various water quality and soil environmental parameter are nonlinear. Further studies should be performed to assess the nonlinear relationship between the average breakage rate and the combined water quality and soil environmental factors, so that better models can be developed to predict AC pipe breaks.
Conclusions
This paper summarized the results of a part of a survey that queried North American utilities on data pertaining to the inventory, breakage and working environments of AC pipes used in water distribution systems. The survey obtained full or partial responses from 20 participating utilities.
The geographic locations of the participating utilities were not evenly distributed, but did cover a range of climate and soil conditions in the United States and Canada. The average breakage rate for AC pipe varied from 3.4 to 4.7 breaks/100 km/year, half of the average for water mains of all pipe materials. This result indicated that, overall, the North American AC pipe inventory is in reasonably good condition. However, while the general trend of breakage rate for all pipe materials as a whole is decreasing, no such trend is observed for AC pipes.
The survey obtained relatively complete inventory information for pipe installation years and pipe sizes. However, other inventory information including pipe type, class and manufacturer had a low response rate.
Although, utilities have relatively complete water quality data, information about the nature of the soils around the AC pipes is limited, even though it is known that AC pipes may be subjected to chemical attack and mechanical stresses due to corrosive soil environments and active soil movement. In some cases the perceptions of utility managers about water and soil environments were not in agreement with reported water and soil test results from these utilities. The perception of utility managers on the non-aggressiveness of sulphate content in conveyed water agreed with the test data, but in terms of the aggressiveness index, utility managers tended to underestimate the corrosiveness of conveyed water. Expansive soil also presented a much higher threat to pipe breakage than that perceived by utility managers.
An analysis was performed to identify factors that contributed to the failure of AC pipes in North America. The factors considered include pipe properties (age, diameter), water quality, and soil environments. Pipe age, pipe diameter, and water quality in terms of aggressiveness index, were correlated relatively well with pipe breakage rate and are factors that should be considered in assessing AC pipe failure conditions. Very soft water and water with very low alkalinity were identified as important factors that contribute to AC pipe failure. However, the effect of soil conditions, such as soil pore water pH and sulphate contents on AC pipe break require further studies, as there was not enough data available to establish an effect on pipe breakage.
Acknowledgments
The authors wish to acknowledge the financial support of the National Research Council and the Water Research Foundation (formerly AwwaRF). We also thank Dr. Jian Zhang, the project manager of the WRF project, and members of the project advisor committee, Toni Lyons, Steve MacKellar, Showri Nandagiri, and Julie Spacht, for their critiques during the development of the survey questionnaire. We greatly appreciate the cooperation of the 20 participating utilities for submitting detailed AC pipe information.
American Society for Testing and Materials (ASTM). (1998). “Standard test methods for asbestos-cement pipe.” ASTM C500-98, Philadelphia, PA.
American Water Works Association (AWWA). (2003). “Standard for asbestos cement distribution pipe 4” through 16” for water and other liquids.” AWWA C400-03, Denver, CO.
AWWA. (2004). “Water stats 2002 distribution system survey.” AWWA, Denver, CO. American Water Work Association Research Foundation (AwwaRF) and DVGW-Technologiezentrum Wasser. (1996). Internal corrosion of water distribution system. 2nd Edition, AwwaRF, Denver, CO.
Carde, C., and Francois, R. (1997). “Effect of the leaching of calcium hydroxide from cement paste on mechanical and physical properties.” Cement and Concrete Research, 27(4), 539-550.
Conroy, P., Cooke, J., Mills, D. Patel, A., and Russell, A. (2005). “Managing the risks presented by pipeburst, redundant and live asbestos cement water distribution mains: condition assessment methodology for asbestos cement pipe.” UK Water Industry Research, U.K.
Eick, H. (1960). “Korrosionsfragen aus dem transportwasser bei asbestzement-druckrohren.” Vom Wasser, 27.
Hu, Y., and Hubble, D. (2007). “Factors contributing to the failure of AC water mains.” Canadian Journal of Civil Engineering, 34,1-14.
Jarvis, B. (1998). “Asbestos-cement pipe corrosion – interim report.” Customer Services Division, Water Corporation, Western Australia, Australia.
Kirmeyer, G.J., Richards, W., and Smith, C.D. (1994). “An assessment of water distribution systems and associated research needs.” AwwaRF: Distribution Systems, Denver, CO.
Little, R.C. (2006). “Sulphur in soils. III. - A study of the readily soluble sulphate content and of the total sulphur content of soil.” Journal of the Science of Food and Agriculture, 9(5), 273 – 281.
Makar, J.M., Desnoyers, R., and McDonald, S.Z. (2001). “Failure modes and mechanisms in gray cast iron pipes.” Underground Infrastructure Research: Municipal, industrial and Environmental Applications: Proceedings of the International Conference on Underground Infrastructure Research, Kichener, ON, Canada, pp.1-10.
Manson, P.W., and Blair, L.R. 1962. “Sulfate resistance of asbestos-cement pipe.” Materials Research and Standard, 2(10), 828-835.
Matti, M.A., and Al-Adeebt, A. (1985). “Sulfate attack on asbestos pipes.” The International Journal of Cement Composites and Lightweight Concrete, 7, 169-176.
Mordak, J., and Wheeler, J. (1988). “Deterioration of asbestos cement water mains, final report to the department of the environment.” Water Research Center, Wiltshire, UK. Moser, A.P. (2001). Buried pipe design. McGraw-Hill, New York.
Nebesar, B., and Riley, G.W. (1983). “Asbestos/cement pipe corrosion: part 1 – historical, technological, economic and statistical background.” CANMET Report 83-16E, Canada Centre for Mineral and Energy Technology, Energy, Mines and Resources, Ottawa, ON, Canada.
Rajani, B.B., and McDonald, S.E. (1995). “Water mains break data on different pipe materials for 1992 and 1993.” National Research Council Canada, Ottawa, ON, Canada, August 01, pp. 11.
Rajani, B.B., and Zhan, C. (1996). “On the estimation of frost load.” Canadian Geotechnical Journal, 33, 629-641.
Table 1 Climate zones for responded utilities
Climate Zones Regions Weather Pattern
Sub arctic AK (USA)
Moist cold winter, brief cool summer, comparatively less precipitation in summer Sub arctic/Semi
arid/Sub humid
ID (USA)
AB, SK (Canada)
Moist cold winter, low annual precipitation, temperature varies in wide range
Humid Continental PA, NJ (USA)
Temperate, moderately cold
winter, mild summer, abundant precipitation Mediterranean CA (USA) Moist mild winter, dry summer
Marine west coast
WA (USA), BC (Canada)
Mild humid climate with no dry season (mild winter, moderate summer)
Arid/semi arid AZ, NV (USA)
Hot and dry all year (desert climate), very mild winter, very little precipitation
Table 2 Predominant type of soil where AC pipe has been installed
Soil type City/Utilities (USA) City/Utilities (Canada)
Clay (HE) Concord, La Mesa (CA);
Richmond, Nanaimo, Victoria, Burnaby (BC); Regina (SK)
Clay (LME)
Phoenix, Sun City (AZ); Harrisburg (PA); Las Vegas
(NV);
Edmonton (AB), Moose Jaw (SK)
Silt Bellevue (WA); Boise (ID) Surrey (BC)
Sand /Gravel
Brick, Toms River (NJ); Anchorage (AK)
Peat
Nanaimo, Richmond, Burnaby (BC)
Table 3 Circumferential failure as a percent of total failure and presence of
expansive clay soil
Utility Circumferential failure (%) High expansive clay Low to medium expansive clay # 2 95 Yes No #20 93.7 Yes No #12 80 No Yes #9 80 No No #7 45.7 Yes Yes #3 40.5 No No #4 25 No No #16 24.6 No Yes #17 22 Yes Yes #6 22 No No #18 15 Yes Yes
Figure 1. Geographic location of participating utilities
Figure 2. Total length and percentage of AC pipes for two previous surveys and this
survey
Figure 3. Pipe age and installation years of water mains of all materials and AC only
Figure 4. Distribution of AC pipe by size
Figure 5. AC pipe distribution by class (five utilities)
Figure 6. AC pipe manufacturers (identified by six utilities)
Figure 7. Average breakage rates reported in two previous surveys and this survey
Figure 8. Average breakage rates for each participating utility from 2002 to 2007
Figure 9 Failure modes reported for AC and non-AC water pipes
Figure 10. Aggressiveness index of conveyed water (18 utilities)
Figure 11. Sulphate contents of conveyed water (18 utilities)
Figure 12. Soils in which AC pipes are installed (20 utilities)
Figure 15. Suphate content of the soil pore water around AC pipes (5 utilities)
Figure 16. Comparison of pipe age versus average breakage rate
Figure 17. Comparison of AI versus average pipe break rate
Figure 18. Comparison of hardness versus average pipe break rate
Figure 19. Comparison of alkalinity versus average pipe break rate
Figure 20. Comparison of sulphate content versus pipe breakage rate
Figure 21. Comparison of percentage of small diameter pipe versus average
Hu, Wang, Cossitt, and Chowdhury – Figure 2 0 20 40 60 80 100 120
1097 utilities in the United States (1992)
21 Canadian cities (1993) Current survey (2008)
A C w a te r m a in l e ngt h (t hous a nd k il om e te rs ) 0 10 20 30 40 50 60 P e rc e nt a ge of A C pi pe ov e r tot a l p ip e l e ngt h AC pipe length AC pipe percentage
Hu, Wang, Cossitt, and Chowdhury – Figure 3 0% 10% 20% 30% 40% 50% <30 30-35 35-40 40-45 45-50 50-55 55-60 >60 Unknown Pipe age P e rc e n ta ge of to ta l pi pe l e n g th All materials AC only Installation year >1977 1973-77 1968-72 1963-67 1958-62 1953-57 1948-52 <1948
Hu, Wang, Cossitt, and Chowdhury – Figure 4 6% 45% 29% 4% 13% 3% <150 mm 150 mm 200 mm 250 mm 300 mm >300 mm
Hu, Wang, Cossitt, and Chowdhury – Figure 5 3% 75% 19% 3% Class 100 Class 150 Class 200 Unknown
Hu, Wang, Cossitt, and Chowdhury – Figure 6 29% 8% 1% 4% 58%
Hu, Wang, Cossitt, and Chowdhury – Figure 7 0 4 8 12 16 20 24 United States (1992) Canada (1993) 2002 2003 2004 2005 2006 2007 A ver ag e b reakag e rat e ( b reaks/ 100 km /year ) All materials AC only
Hu, Wang, Cossitt, and Chowdhury – Figure 8 0 5 10 15 20 25 30 #1 #2 #3 #4 #5 #6 #7 #8 #9 #10 #11 #14 #15 #16 #17 #18 #19 #20 A ver ag e b reakag e rat e ( b reaks/ 100 km /year )
Hu, Wang, Cossitt, and Chowdhury – Figure 9
0% 10% 20% 30% 40% 50% 60% 70% Circumferential
Longitudinal
Corrosion through hole
Split bell/bell shear
Joint failure
other
unknown
Percentage of total number of breaks Non-AC AC
Hu, Wang, Cossitt, and Chowdhury – Figure 10 0 2 4 6 8 10 12 14 #1 #2 #3 #4 #5 #6 #7 #8 #9 #10 #12 #14 #15 #16 #17 #18 #19 #20 A g ressive n ess In d e x
Hu, Wang, Cossitt, and Chowdhury – Figure 11 0 50 100 150 200 250 300 #1 #2 #3 #4 #5 #6 #7 #8 #9 #10 #11 #14 #15 #16 #17 #18 #19 #20 S ul pha te c on te n t ( m g/ L) Source #1 Source #2
Hu, Wang, Cossitt, and Chowdhury – Figure 12 0% 10% 20% 30% 40% 50% 60% 70% HE Clay LME Clay Silt Sand Gravel Peat Other
Hu, Wang, Cossitt, and Chowdhury – Figure 13
0% 10% 20% 30% 40% 50%
Native soil - left in situ Native soil -reworked backfill Sand Fine gravel Other
Hu, Wang, Cossitt, and Chowdhury – Figure 14 0 2 4 6 8 10 12 #3 #7 #8 #15 #17 #18 #20 S o il p o re w a te r p H
Hu, Wang, Cossitt, and Chowdhury – Figure 15 0 2000 4000 6000 8000 10000 12000 #3 #4 #8 #18 #20 S o il s u lp h a te c o n te n t ( m g /L )
Hu, Wang, Cossitt, and Chowdhury – Figure 16 0 5 10 15 20 25 30 30 32 34 36 38 40 42 44 46 48 Av erage breakage rate (breaks/100 km/y ear)
Average pipe age (year)
Average breakage rate = 0.3616 • Age -9.4555
Hu, Wang, Cossitt, and Chowdhury – Figure 17 0 5 10 15 20 8 9 10 11 12 13 Av erage breakage rate (breaks/100 km/y ear)
Aggressive index (AI)
AI < 10 10< AI < 1 AI > 12
Average breakage rate= 40838 AI-3.9181
Hu, Wang, Cossitt, and Chowdhury – Figure 18 0 5 10 15 20 0 50 100 150 200 250 300 Av erage breakage rate (breaks/100 km/y ear) Hardness (mg/L)
Average breakage rate= 15.134 Hardness
-0.368
Hu, Wang, Cossitt, and Chowdhury – Figure 19 0 5 10 15 20 0 20 40 60 80 100 120 140 Av erage breakage rate (breaks/100 km/y ear) Alkalinity (mg/L)
Average breakage rate= 18.106 Alkalinity
-0.44
Hu, Wang, Cossitt, and Chowdhury – Figure 20 0 5 10 15 20 0 50 100 150 200 250 300
Average breakage rate (breaks/100 km/y
ear)
Sulphate content (mg/L)
Hu, Wang, Cossitt, and Chowdhury – Figure 21 0 5 10 15 20 25 30 30 35 40 45 50 55 60 65 70
Average breakage rate (breaks/100
km/year)
Percentage of AC pipe with diameter of 150 mm and less (%)
Average breakage rate= 0.0062 Percentage2
- 0.3908 Percentage + 7.266