Publisher’s version / Version de l'éditeur:
Annals of glaciology, 44, pp. 154-162, 2006
READ THESE TERMS AND CONDITIONS CAREFULLY BEFORE USING THIS WEBSITE. https://nrc-publications.canada.ca/eng/copyright
Vous avez des questions? Nous pouvons vous aider. Pour communiquer directement avec un auteur, consultez la première page de la revue dans laquelle son article a été publié afin de trouver ses coordonnées. Si vous n’arrivez pas à les repérer, communiquez avec nous à PublicationsArchive-ArchivesPublications@nrc-cnrc.gc.ca.
Questions? Contact the NRC Publications Archive team at
PublicationsArchive-ArchivesPublications@nrc-cnrc.gc.ca. If you wish to email the authors directly, please see the first page of the publication for their contact information.
NRC Publications Archive
Archives des publications du CNRC
This publication could be one of several versions: author’s original, accepted manuscript or the publisher’s version. / La version de cette publication peut être l’une des suivantes : la version prépublication de l’auteur, la version acceptée du manuscrit ou la version de l’éditeur.
Access and use of this website and the material on it are subject to the Terms and Conditions set forth at
A comparison of physical properties and strength of decaying first-year
ice in the Arctic and sub-Arctic
Johnston, M.
https://publications-cnrc.canada.ca/fra/droits
L’accès à ce site Web et l’utilisation de son contenu sont assujettis aux conditions présentées dans le site LISEZ CES CONDITIONS ATTENTIVEMENT AVANT D’UTILISER CE SITE WEB.
NRC Publications Record / Notice d'Archives des publications de CNRC:
https://nrc-publications.canada.ca/eng/view/object/?id=10acc216-bbc9-40d5-a0cc-0088779b2f2a https://publications-cnrc.canada.ca/fra/voir/objet/?id=10acc216-bbc9-40d5-a0cc-0088779b2f2awhereas the bulk salinity and thickness of the ice do not change substantially until later in the season, when the ice becomes isothermal at a temperature of –1.88C. Results show that the seasonal decrease in the strength of first-year sea ice and the temperature-induced increase in brine volume are correlated. Once the ice is devoid of salt in late summer, the air volume continues to increase but has minimal effect on the ice strength.
INTRODUCTION
Usually the strength of sea ice is measured in mid-winter or early spring, when the ice is cold and strong (Sinha, 1986; Blanchet and others, 1997; Spencer and others, 2001). However, it is also important to know about the properties of sea ice during summer because that is when most shipping in the Arctic takes place. Bilello (1960) provides important information about how sea ice at different stations throughout the Canadian Arctic Archipelago grows and decays. Zubov (1945) qualitatively describes the different phases of the weakening and destruction of sea ice. Until relatively recently, however, quantitative informa-tion was not available about how the strength of first-year sea ice changes during the decay process. The 3 years of measurements made by Johnston and others (2001, 2002, 2003), which are summarized in this paper, provide the basis for understanding how the strength of decaying first-year sea ice in the Arctic decreases during spring and summer.
Having conducted 3 years of measurements on decaying first-year ice in the Arctic, questions arose about whether sub-Arctic ice deteriorates in the same manner, and at the same time, as Arctic ice. To help answer that question, measurements were made on first-year ice off sub-Arctic Labrador in spring 2004. Labrador was selected because few ice-property measurements (Weeks and Lee, 1958; Gow, 1987; Cormorant Ltd, 1997; Kirby, 1997) and even fewer ice-strength measurements (Fenco, 1977) had been made in that area, and also because the measurements could be used to extend the Canadian Ice Service’s Ice Strength Charts from first-year ice in the Arctic (Gauthier and others, 2002) to the sub-Arctic (Johnston and Timco, 2005).
SAMPLING SITES
The first two measurement seasons focused upon decaying first-year ice in the Arctic. Level, landfast first-year ice near Truro Island, Nunavut, (Fig. 1a) was sampled from May until July. The ice was sampled several times each week, with the assistance of personnel from University of Manitoba, until the annual base camp on Truro Island was decommissioned
in July. In the third year, the scope of the project was expanded to include ‘distributed’ sampling sites in Barrow Strait and Lancaster Sound, in addition to the ice at Truro Island. Because the distributed sampling sites spanned a distance of about 120 km, it was possible to visit them only three to four times that season. The 3 years of measurements extended from 21 May to 20 July 2000, 14 May to 28 June 2001 and 2 May to 11 August 2002. Air temperatures during the three field seasons were comparable, with minimum temperatures of about –168C in early May and maximum temperatures of +58C in August.
The fourth measurement season focused on decaying first-year sea ice in sub-Arctic Labrador. Six sites in the landfast ice near Nain, Labrador, (Fig. 1b) were sampled four times between 1 February and 14 May 2004. Three of the sites were in Strathcona Run, along the ‘traditional’ shipping route to Nain, and the other three sites were about 15 km south, in Anaktalak Run, along the shipping route to Voisey’s Bay Mine (Rowell and Metcalf, 2005). The air temperatures in sub-Arctic Labrador ranged from –208C to +28C from February to May, but it was not uncommon to have strong winds develop and large changes in air temperature occur over a period of a few hours.
SAMPLING METHODOLOGY
At each sampling site, a fibreglass corer was used to make three 150 mm diameter boreholes in the ice, about 1.5– 2.0 m apart. The snow and ice thickness, air and ice temperature, ice freeboard, ice salinity and ice strength were measured at each borehole. The core from the first hole was used to measure the ice temperature by making small holes along its length, into which a calibrated thermistor probe was inserted. Since measuring temperatures on ice cores can have limited accuracy in spring and summer, when air and ice temperatures differ markedly, whenever possible the in situ temperature of the ice was measured using temperature chains that had been frozen into the ice (Johnston and Timco, 2002, 2005). The core from the second hole was used to measure the ice salinity. Discs about 20 mm thick were cut along the length of the core at depth intervals of 0.20–0.30 m. The discs of ice were double-bagged and
transported to base camp, where the samples were brought to room temperature. A calibrated digital conductivity meter (accuracy 0.5%) was used to measure the salinity of the meltwater. When time permitted, cores from the third borehole were cold-packed and shipped to the National Research Council Canada in Ottawa, where the ice microstructure was examined (results will be published elsewhere). In every case, cores were processed as quickly as possible to minimize the effects of ambient air tempera-tures and solar radiation on the cores. Disruption to the site was minimized by placing unused core fragments back into the boreholes.
After each core had been processed, a borehole jack assembly (Fig. 2) was used to measure the in situ confined compressive strength of the ice. The borehole jack consists of a high-strength, stainless-steel hydraulic cylinder, with laterally acting pistons and two indentor plates that are curved to match the wall of the borehole (Masterson, 1996). Because the ice strength is measured in situ, ambient air temperatures and solar radiation have little effect on the tests, which makes the borehole jack an ideal instrument for measuring the strength of decaying freshwater ice (Prowse and others, 1988; Sinha, 1990) and sea ice, as discussed in this paper.
Strength tests were conducted in up to three boreholes at each sampling site, throughout the full thickness of ice, at depth intervals of 0.30 m. During the tests, a data acquisition system was used to measure the oil pressure and the displacement of the two indentors, each of which had a maximum stroke of 25 mm. The ice strengths in this paper were standardized by reporting the gauge pressure at an indentor penetration of 3 mm (Johnston and others, 2001), compensating for the stress rate effect (Johnston and others, 2003) and reducing the gauge pressure to account for the ratio of the internal piston area to the external indentor area.
SURFACE CONDITIONS
The photographs of Arctic first-year ice at the Truro site in Figure 3a and b show the dramatic changes in the ice surface that occur during the melt season. In mid-May 2000, a 0.30 m thick layer of snow covered the ice, but by mid-June the snow cover had thinned considerably, leaving bare ice in some areas and a slushy layer of snow elsewhere. Melt ponds started forming on the ice around 26 June (Julian day (JD) 177), and just 3 days later some of the ponded areas had drained significantly. By early July, the ice surface was characterized by raised areas of white, drained ice and adjacent melt ponds (Fig. 3b).
The surface of first-year ice in sub-Arctic Labrador also changed significantly during the melt season. Some of the sampling sites in sub-Arctic Labrador were snow-free in March, but the snow cover was up to 0.41 m thick at other sites. Snow in the sub-Arctic was densely packed, as the sculpted chunk of snow that was dislodged during the coring process illustrates in Figure 3c. By mid-May, the snow cover had melted entirely at most sites, exposing the soft ice surface and producing a layer of standing water. By the time the last site visit was made on 14 May, much of the standing water had drained through the ice (Fig. 3d). It should be noted that, had the photo of the ice in Figure 3d been taken 1 day earlier, the ice would have been covered with a 0.30 m thick layer of standing water (personal communication from R. Webb, 2004). Travel on the ice was limited when the ice was covered by standing water; but once the ice surface had drained, the residents of Nain continued to travel on the ice until about 2 weeks after the last property measurements had been made on 14 May. No information is available about the condition of the ice surface in late May.
Fig. 2. Borehole jack in ice, at 0.30 m test depth. Arrows indicate direction of borehole indentors penetrating the ice.
Fig. 1. First-year ice sites sampled during decay measurement programs.
SNOW AND ICE THICKNESS
Figure 4a and b show the seasonal variations in snow and ice thickness in the Arctic and the sub-Arctic, respectively. Data markers in the figure represent the average of the measurements made at three boreholes at each sampling site. Measurements at the Arctic site (Truro) were in good agreement for the three years. In general, ice at that site was about 1.25 m thick in mid-May, and had a 0.30 m thick snow cover. Ice thickness at the Truro site changed very little until mid-June, when the snow cover melted completely and the ice began to ablate. The last measurements at that site were made in mid-July, when the 0.83 m thick ice was covered by melt ponds and raised areas of drained ice.
Figure 4b shows representative data for the snow and ice thicknesses at two of the six sites in sub-Arctic Labrador. The two sampling sites showed different trends: the ice thickness
in Strathcona Run began to decrease in mid-April, but the ice thickness in Anaktalak Run continued to increase until the last measurements were made in mid-May. The in-creased thickness in Anaktalak Run likely did not result from congelation ice forming on the underside of the ice because mean daily temperatures remained above 08C after late April. Rather, the ice thickness increased because the snow burden depressed the ice surface, causing the snow to flood and superimposed snow ice (Michel, 1978) to develop on the top ice surface. The temperature chain in Anaktalak Run provided evidence of that: the marker that had been used to denote the top ice surface when the chain was installed in February was about 150 mm below the top ice surface when the chain was removed in mid-May. Some of the ice cores also confirmed the presence of superimposed snow ice, since the top 100 mm of ice appeared much whiter than, and separated easily from, the rest of the core.
Fig. 3. Ice surface conditions at Truro Island (a, b) vs Labrador (c, d).
IN SITU ICE TEMPERATURES
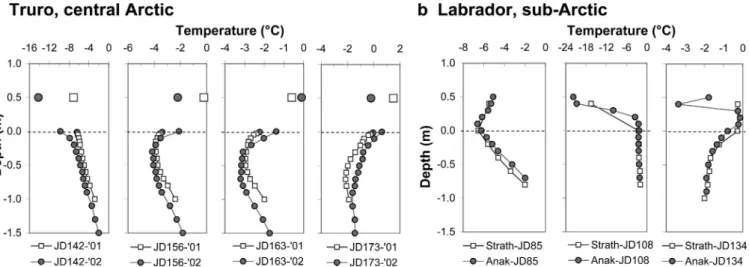
Figure 5a shows the in situ temperatures of Arctic first-year ice at the Truro site in 2001 and 2002. The chains measured ice temperatures only. The air temperatures shown in the figure (plotted at an arbitrary elevation of +0.50 m) were obtained from the nearest weather station in Resolute, courtesy of Environment Canada. All temperatures in Figure 5 were reported at 0600 h. On 22 May (JD142) a linear gradient extended from the colder top ice surface to the warmer bottom ice, a condition that normally char-acterizes sea ice in winter. The full thickness of ice warmed as the season advanced, with the largest temperature increases occurring in the uppermost 0.30 m of ice. By 12 June (JD163), the linear temperature gradient had transformed into a ‘C’ shape, where the warmest ice was at the top and bottom ice surfaces. By 22 June (JD173), the full thickness of ice had reached a temperature of –1.88C or higher. Note that the uppermost sensors of the temperature chain that was used in 2002 measured temperatures higher than 08C after 22 June (JD173) because a melt pond formed around the temperature chain that year.
Both of the temperature chains that were used in sub-Arctic Labrador measured temperatures in the air, snow and ice. Figure 5b shows the in situ temperature profiles of air, snow and ice in Strathcona Run and Anaktalak Run for the three days on which property measurements were made: 26 March (JD85), 18 April (JD108) and 14 May (JD134). The sensor at +0.50 m measured air temperatures throughout the season because snow thicknesses did not exceed 0.50 m at either site. The figure shows the moderating effect that the snow cover had on the underlying ice. For example, on 26 March (JD85), warm air temperatures produced a positive temperature gradient in the snowpack but had little effect on the negative temperature gradient that extended from the cold snow–ice interface (0.0 m) to the warm bottom ice. A different situation occurred on 18 April (JD108), when cold air temperatures affected the snowpack but had little effect on the near-isothermal state of the ice cover. When the chains were removed in mid-May (JD134), the ice surface in Strathcona Run was essentially bare and had a top ice temperature of –0.38C, whereas the ice in Anaktalak Run was covered by a 0.15 m layer of snow and had a top ice
temperature of –0.88C. Below the 0.20 m depth, tempera-tures at both sites ranged from –1.48C to –2.08C on 14 May (JD134).
ICE SALINITY
Figure 6a shows a sequence of salinity profiles for Arctic first-year ice at the Truro site. Two of the three years of Arctic field measurements are used in the figure to illustrate the desalination of sea ice in summer. It should be noted, however, that the figure does not convey the extent to which natural variations in salinity occur in both space and time. When the first measurements were made in late May (JD142), the ice no longer had the classic ‘C’-shaped salinity profile that typifies cold, Arctic first-year ice (Nakawo and Sinha, 1981), where salinities are higher toward the top and bottom ice surfaces. Rather, the salinity of the Arctic ice was constant at about 5% throughout the full thickness of ice in late May, and remained so until mid-June (JD173). By 29 June (JD180), the top and bottom ice surfaces had desalinated, giving the ice a reversed ‘C’-shaped salinity profile. Salinities in the bulk layer of ice did not change considerably until July. By 20 July (JD201), the full thickness of ice was nearly devoid of salt. Tucker and others (1987) also observed that the top layer of first-year ice in Fram Strait had desalinated when it was sampled in June and July, but they did not observe desalination in the bottom layer of ice. Although care was taken in this study to process cores as quickly as possible, the low-salinity bottom ice reported in Figure 6a may have resulted from the loss of brine during sampling.
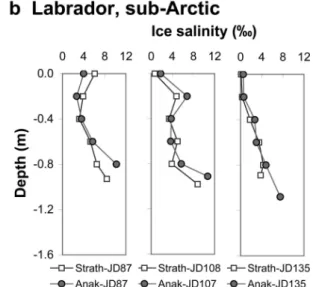
When first-year ice in sub-Arctic Labrador was sampled in mid-March (JD87), the ice had a classic ‘C’-shaped salinity profile, as evidenced by the higher salinities at the top and bottom ice surfaces (Fig. 6b). By mid-April (JD107), the layer of superimposed snow ice that formed on the top ice surface resulted in the uppermost 0.20 m of ice having minimal salinity. Ice below the 0.20 m depth, however, retained its ‘C’-shaped profile. When the last measurements were made on the sub-Arctic ice in mid-May (JD135), the uppermost layers of congelation ice at both the Strathcona Run and Anaktalak Run sites had begun desalinating.
Fig. 5. In situ temperature profiles of first-year ice: (a) Arctic and (b) sub-Arctic. Depth of 0.0 m denotes top ice surface when temperature chains were installed; air temperatures shown at +0.50 m elevation.
ICE BOREHOLE STRENGTH
The borehole strength profiles for Arctic ice at the Truro site and sub-Arctic ice in Strathcona Run, respectively, are shown in Figure 7a and b. Reported in the figure are the average strengths of the tests that were conducted in different boreholes, at the same depths. Early in the season, the standard deviation in strength ranged from 0.2 to 1.3 MPa (not shown) for ice in different boreholes, at the same depth. As the season advanced and it became more difficult to find uniform ice in which to make the boreholes, strength tests needed to be conducted in both melt ponds and the dry areas of hillocked ice. As might be expected, the strengths measured in the non-uniform ice produced a much wider range of standard deviations.
The strength profiles of ice at the Truro site (Fig. 7a) show that the ice was strongest early in the season, when it was coldest (22 May (JD142)). Subsequent measure-ments showed that the strength of the ice at all test depths decreased until early July, although the most notable
decrease in strength occurred in the top layer of ice from 12 to 19 June (JD163–JD170). Once the full thickness of ice had become uniformly weak on 2 July (JD183), with confined compressive strengths of only 3–4 MPa, strengths throughout the ice sheet changed very little. In fact, when the last tests were conducted on 20 July (JD201), the ice strength had not changed appreciably since the tests had been conducted 3 weeks earlier. The distributed sites in Barrow and Lancaster Sound also showed evidence of a late-season ‘plateau’ in strength (Johnston and others, 2003), but the clearest trend was seen in ice from the Truro site, likely because measurements were made more often at that site. It should be noted that 2 July was the last time that measurements could be made by accessing the ice, via snowmobile, from the base camp on Truro Island. The visit to the site on 20 July was made possible by enlisting the assistance of the icebreaker CCGS Louis
S. St-Laurent.
Sub-Arctic ice at the Strathcona Run site also underwent a steady decrease in strength during the melt season (Fig. 7b). On 26 March (JD85), the ice was strongest toward the top surface, and its strength decreased toward the bottom ice. When the next site visit was made on 18 April (JD108), strengths in the top and intermediate layers of ice had decreased substantially. The ice strength had decreased further by mid-May (JD135), but the changes were not as substantial as those observed in mid-April.
COMPARING MELT SEASONS IN THE ARCTIC AND SUB-ARCTIC
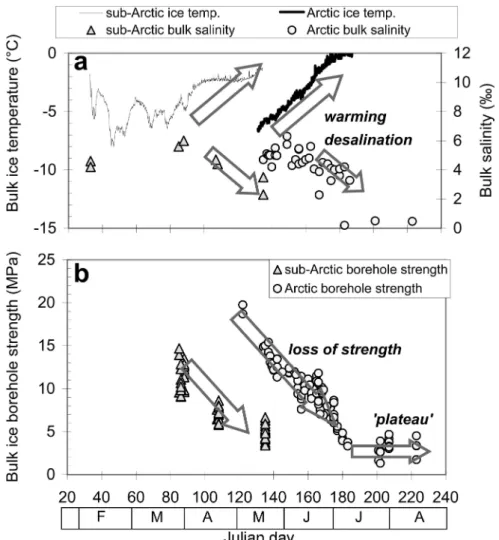
In the previous section, profiles of the temperature, salinity and strength were used to show that first-year ice in the Arctic and sub-Arctic decays in a similar manner. In this section, the depth averages, or bulk values, of the ice properties from both regions are used to illustrate that the strength and salinity of the ice decrease as the temperature of the ice increases (Fig. 8). Notice that decay-related changes in the ice occur about 2 months earlier in the sub-Arctic than in the sub-Arctic: if the temperature, salinity and strength of first-year ice in sub-Arctic Labrador were shifted right by about 60 days, the measurements from the sub-Arctic and sub-Arctic would overlap nicely in Figure 8.
Fig. 7. Profiles of in situ strength of first-year ice in (a) Arctic and (b) sub-Arctic, showing that the strength decreases throughout the full thickness of ice during the decay process.
The ice decay process was already underway when the earliest visit was made to Arctic first-year ice at the Truro site, in mid-May. At that point, temperatures throughout the full thickness of ice had started to increase (Fig. 8a) and the borehole strength of the ice had decreased from its typical winter maximum of 29 MPa (Sinha, 1986; Blanchet and others, 1997) to 20 MPa (Fig. 8b). In the Arctic, the ice strength decreased at a steady rate from mid-May to early July, and then reached a plateau where there was minimal change in strength. The plateau in strength coincided with the stage at which the ice sheet had virtually desalinated and temperatures were close to 08C throughout its thickness (Fig. 8a). The plateau in strength was not observed in the sub-Arctic, but that is likely because the ice was not sampled frequently enough, or late enough.
Figure 8a shows that one of the most notable differences between sub-Arctic and Arctic first-year ice is that the in situ ice temperatures in the sub-Arctic are more variable than in the Arctic. That difference can be attributed to the extreme variability in air temperatures that occurs in the sub-Arctic, as compared to the Arctic. Although snow thicknesses were approximately the same in the two geographic regions, the dramatic changes in weather that occurred in sub-Arctic Labrador likely affected the morphology of the snow, which may have made the sub-Arctic ice more responsive to fluctuations in air temperature.
ICE POROSITY: LINKING THE ICE TEMPERATURE, SALINITY AND STRENGTH
Having shown that sea ice in the Arctic and sub-Arctic decays in a similar manner, 3 years of measurements on Arctic first-year ice are used to explore the relation between the physical and mechanical properties of the ice. Assur (1960) and Weeks and Assur (1967) give a detailed discussion of the relation between the physical and mechanical properties of sea ice. Two factors that contribute to the decreased strength of decaying ice are (i) the strength of the ice lattice itself, which decreases as the ice warms, and (ii) the increased porosity of the ice. While both mechanisms influence the strength of sea ice, there is no easy way to separate the effects of increasing temperature and porosity on strength (Mellor, 1983). For sea ice, it is difficult to distinguish between the effects that temperature and porosity have on the ice strength because much of the pore volume is occupied by brine, so the ice porosity varies as the temperature changes. That said, it is generally conceded that the ice decay process is characterized by melting at the grain boundaries (Knight, 1962), where the embedded impurities cause the selective absorption of radiation (Ashton, 1985). The effect of porosity on ice strength was examined in Timco and Frederking (1990), where the compressive strength of the ice is related to the
Fig. 8. Seasonal trends in the temperature, salinity and strength of first-year ice in the Arctic and sub-Arctic Labrador. As the ice warms, it desalinates and loses strength. Note that decay-induced property changes in sub-Arctic Labrador occur about 2 months earlier than in the Arctic.
calculated total porosity of the ice, i.e. the brine volume plus air volume. The flexural strength of the ice has also been related to the porosity of the ice, in terms of the calculated brine volume, as per the equations developed by Timco and O’Brien (1994). In the latter study, the authors state that it would have been preferable to relate empirical measure-ments of the flexural strength to the calculated total porosity of the ice, rather than to the calculated brine volume, but that was not possible because the corresponding ice densities were not usually reported.
Understanding the relation between the total porosity and ice strength requires an appreciation of how the brine volume and, to a lesser extent, the air volume change as the temperature of the ice increases. Assur (1960) showed that the calculated brine volume is a function of ice temperature, and that it increases very rapidly when the ice reaches near-melting temperatures. Frankenstein and Garner (1967) used Assur’s work to develop equations for calculating the brine volume from the measured temperature and salinity of the ice, for ice temperatures in the range –22.9 to –0.58C. Both of those works assume a constant ice density of 0.926 Mg m–3; but in their review of sea-ice densities, Timco and Frederking (1996) cite densities of first-year sea ice in the range 0.84– 0.91 Mg m–3. Realizing that the density of sea ice is not constant and that it should be taken into account when calculating the total porosity of the ice, Cox and Weeks (1983) developed a set of equations for calculating the brine volume and the air volume using the measured density, temperature and salinity of sea ice. Note that the equations developed by Frankenstein and Garner (1967) and Cox and Weeks (1983) can only be used up to a certain ice temperature: neither set of equations can be used to accurately calculate the exponential increase in brine volume that occurs when the ice temperature increases above about –2.08C. Above that, very small differences in the ice temperature result in large differences in the calculated brine volume. Leppa¨ranta and Manninen (1988) proposed equations for calculating the brine and gas content of sea ice for ice temperatures from –2.08C to 08C, but the authors state that the calculations can have significant errors due to the
difficulty of measuring accurate ice temperatures and, although not explicitly stated, ice densities, at elevated temperatures. In this paper, the equations of Frankenstein and Garner (1967) are used to calculate the brine volume, or brine porosity. Calculating the total porosity of the decaying sea ice would have been preferable, but that was not possible because of the difficulty of accurately measuring ice densities at elevated temperatures, especially under field conditions.
Nowhere is the temperature-induced increase in brine volume, and its effect on ice strength, more apparent than in decaying sea ice. The clear relation between the brine volume and ice strength is shown in Figure 9, using 3 years of data from ten different first-year ice sites in the Arctic. The latest measurements of the season were made on first-year ice near Resolute, on 11 August (JD223) 2002, by accessing the ice from the base at Polar Continental Shelf Project (PCSP), via helicopter. Figure 9 shows that the ice strength steadily decreased until early July (JD182) and that the reduction in strength coincided with the exponential increase in the calculated brine volume. The brine volume increased rapidly until the beginning of July, at which point the full thickness of ice had reached near-melting tempera-tures and was nearly devoid of salt (Fig. 8a). After that, the calculated brine volume, or brine porosity, began to decrease. That should not be construed as a decrease in the total porosity of the ice, however: the volume of air continued to increase even after the brine volume de-creased. Ice cores extracted in late summer provided evidence of that: the tubular drainage features in the decaying cores of ice became more noticeable as the season advanced. Increases in the total porosity that took place after the brine volume began to decrease had little effect on the strength of the ice, as illustrated by the plateau in ice strength that occurred in July and August.
The measurements on freshwater ice reported in Bulatov (1970), Ashton (1985) and Prowse and others (1988) can be used to provide some insight into the strength plateau that was observed in decaying sea ice during this study, keeping in mind that the two ice types are fundamentally different. One of the most significant differences is that the porosities
Fig. 9. Most of the decrease in strength of first-year ice (FYI) results from the exponential increase in brine volume. Once the ice becomes isothermal at –1.88C, salts quickly drain from the ice and there is a decrease in brine volume. After the brine volume decreases, the expanding drainage network causes an increase in air volume (total porosity), but that has minimal effect on the ice strength.
of decaying freshwater ice and sea ice increase for different reasons: the total porosity of sea ice increases primarily because of the temperature-related increase in brine volume, whereas the porosity of freshwater ice increases because of the expanding network of air-filled cavities. Despite those differences, measurements on both types of ice indicate that an inverse, non-linear relation exists between the strength and porosity, that the greatest decrease in strength occurs during the early stages of porosity development and that the ice strength changes very little after the porosity has exceeded about 15–20%.
CONCLUSIONS
Three summers of measurements in the Arctic and one measurement season in the sub-Arctic showed that first-year ice at both geographic locations decayed in a similar manner. Changes in sub-Arctic Labrador sea ice preceded the decay-related changes in the Arctic ice by about 2 months. During the melt season, temperatures throughout the full thickness of ice increased, the ice desalinated and the in situ borehole strength of the ice decreased. Although the temperature and strength of the ice changed throughout the season, the bulk ice salinity did not change substantially until the mean daily air temperature increased to 08C, the snow cover melted completely and the ice was isothermal at a temperature of –1.88C. In the Arctic, the strength of the ice decreased steadily from mid-May to early July, after which there was minimal change in strength until the last measure-ments were made in mid-August. The greatest decrease in ice strength coincided with the rapid increase in brine volume, indicating that the exponential increase in brine volume was likely the primary driver of the decrease in strength for decaying first-year sea ice. After the calculated brine volume had reached about 20% in late summer, and began to decrease, the ice strength changed very little. Results showed that, for first-year sea ice, increases in the total porosity that occurred after its brine volume decreased had little effect on the ice strength. A similar trend has been observed in freshwater ice, after the expansion of air-filled cavities has increased the calculated total porosity of the ice to about 15–20%.
ACKNOWLEDGEMENTS
Many people helped make the measurements on decaying ice successful. The study was supported by Transport Canada; the interest and enthusiasm of V. Santos-Pedro are sincerely appreciated. The University of Manitoba helped sample Arctic ice during the three field seasons and also provided in situ ice-temperature measurements for the 2000 and 2001 seasons. Canadian Ice Service, Polar Continental Shelf Project, Hunters and Trappers Association in Resolute and the Canadian Coast Guard were an integral part of the Arctic fieldwork. G. Dicker and R. Webb of Sikumiut Environmental Management, and J. Rowell formerly of the Labrador Inuit Association made fieldwork in Labrador possible. The provision of equipment by Sandwell Inc., T. Prowse, M. Demuth and N. Sinha is also gratefully acknowledged, as is the support provided by the RPSO Design and Fabrication Service of National Research Council Canada. The helpful comments of the two anony-mous reviewers and the valuable input of J.-L. Tison, G. Timco and R. Frederking are appreciated.
REFERENCES
Ashton, G.D. 1985. Deterioration of floating ice covers. J. Energy
Resour. Technol., 107(2), 177–182.
Assur, A. 1960. Composition of sea ice and its tensile strength.
CRREL Res. Rep. 44.
Bilello, M.A. 1960. Formation, growth, and decay of sea ice in the Canadian Arctic Archipelago. SIPRE Res. Rep. 65.
Blanchet, D., R. Abdelnour and G. Comfort. 1997. Mechanical properties of first-year sea ice at Tarsiut Island. J. Cold Reg. Eng., 11(1), 59–83.
Bulatov, S.N. 1970. Calculating the strength of thawing ice cover and the beginning of wind-activated ice drift. CRREL Transl. IR-799. Cormorant Ltd. 1997. Voisey’s Bay ice monitoring program:
program report. St John’s, Voisey’s Bay Nickel Company Ltd.
Cox, G.F.N. and W.F. Weeks. 1983. Equations for determining the gas and brine volumes in sea-ice samples. J. Glaciol., 29(102), 306–316.
Fenco Consultants Ltd. 1977. 1977 winter field ice survey offshore
Labrador. Calgary, Alb., Fenco Consultants Ltd.
Frankenstein, G. and R. Garner. 1967. Equations for determining the brine volume of sea ice from –0.58C to –22.98C. J. Glaciol., 6(48), 943–944.
Gauthier, M.F., R. de Abreu, G.W. Timco and M. Johnston. 2002. Ice strength information in the Canadian Arctic: from science to operations. In Squire, V.A. and P. Langhorne, eds. Proceedings of
the 16th IAHR International Symposium on Ice, 2–6 December 2002, Dunedin, New Zealand, Vol. 2. Dunedin, International
Association of Hydraulic Engineering and Research, 203–210. Gow, A.J. 1987. Crystal structure and salinity of sea ice in Hebron
Fiord and vicinity, Labrador. CRREL Rep. 87-4.
Johnston, M. and G.W. Timco. 2002. Temperature changes in first year Arctic sea ice during the decay process. In Squire, V.A. and P. Langhorne, eds. Proceedings of the 16th IAHR International
Symposium on Ice, 2–6 December 2002, Dunedin, New Zealand, Vol. 2. Dunedin, International Association of
Hy-draulic Engineering and Research, 194–202.
Johnston, M. and G. Timco. 2005. Validating the strength algorithm
for sub-Arctic ice with field measurements from Labrador.
Ottawa, Ont., National Research Council Canada. Canadian Hydraulics Centre. (Tech Rep. CHC-TR-032.)
Johnston, M., R. Frederking and G. Timco. 2001. Decay-induced changes in the physical and mechanical properties of first year ice. In Proceedings of the 16th International Conference on Port
and Ocean Engineering under Arctic Conditions, Vol. 3. Ottawa,
Ont., National Research Council Canada, 1395–1404. Johnston, M., R. Frederking and G. Timco. 2002. Properties of
decaying first year sea ice: two seasons of field measurements. In
Proceedings of the 17th International Symposium on Okhotsk Sea and Sea Ice. Ottawa, Ont., National Research Council
Canada, 303–311.
Johnston, M., R. Frederking and G.W. Timco. 2003. Properties of decaying first year sea ice at five sites in Parry Channel. In
Proceedings of the 17th International Conference on Port and Ocean Engineering under Arctic Conditions, Vol. 1. Ottawa,
Ont., National Research Council Canada, 131–140.
Kirby, C. 1997. Voisey’s Bay ice probe 1997 on CCGS Henry Larsen. Ottawa, Ont., National Research Council Canada. Institute for Marine Dynamics. (TR-1997-26.)
Knight, C.A. 1962. Studies of Arctic lake ice. J. Glaciol., 4(33), 319–335.
Leppa¨ranta, M. and T. Manninen. 1988. The brine and gas content
of sea ice, with attention to low salinities and high tempera-tures. Helsinki, Finnish Institute of Marine Research. (Internal
Report 88-2.)
Masterson, D.M. 1996. Interpretation of in situ borehole ice strength measurement tests. Can. J. Civil Eng., 23(1), 165–179. Mellor, M. 1983. Mechanical behavior of sea ice. CRREL Rep. 83-1. Michel, B. 1978. Ice mechanics. Que´bec, Que´., Les Presses de
l’Universite´ Laval.
Arctic Engineering (OMAE) Symposium, April 13–18, 1986, Toyko, Japan, Vol. 4. New York, American Society of
Mechan-ical Engineers, 328–335.
Sinha, N.K. 1990. Ice cover strength decay using borehole indentor.
In Proceedings of the 10th IAHR International Symposium on Ice, 20–23 August 1990, Espoo, Finland, Vol. 2. Espoo,
International Association for Hydraulic Research, 735–744.
Weeks, W.F. and A. Assur. 1967. The mechanical properties of sea ice. CRREL Monogr. II-C3.
Weeks, W.F. and O.S. Lee. 1958. Observations on the physical properties of sea-ice at Hopedale, Labrador. Arctic, 11(3), 134–155.
Zubov, N.N. 1945. L’dy Arktiki [Arctic ice]. Moscow, Izdatel’stvo Glavsevmorputi.