EUROPEAN ORGANISATION FOR NUCLEAR RESEARCH (CERN)
JHEP 05 (2019) 123
DOI:10.1007/JHEP05(2019)123
CERN-EP-2018-295 14th November 2019
Search for top-quark decays
t → H q with 36 fb
−1
of
p p collision data at
√
s
= 13 TeV with the ATLAS
detector
The ATLAS Collaboration
A search for flavour-changing neutral current decays of a top quark into an up-type quark (q = u, c) and the Standard Model Higgs boson, t → Hq, is presented. The search is based on a dataset of pp collisions at
√
s = 13 TeV recorded in 2015 and 2016 with the ATLAS detector at the CERN Large Hadron Collider and corresponding to an integrated luminosity of 36.1 fb−1. Two complementary analyses are performed to search for top-quark pair events in which one top quark decays into W b and the other top quark decays into Hq, and target the H → b ¯b and H → τ+τ−decay modes, respectively. The high multiplicity of b-quark jets, or the presence of hadronically decaying τ-leptons, is exploited in the two analyses respectively. Multivariate techniques are used to separate the signal from the background, which is dominated by top-quark pair production. No significant excess of events above the background expectation is found, and 95% CL upper limits on the t → Hq branching ratios are derived. The combination of these searches with ATLAS searches in diphoton and multilepton final states yields observed (expected) 95% CL upper limits on the t → Hc and t → Hu branching ratios of 1.1 × 10⁻³(8.3 × 10⁻⁴) and 1.2 × 10⁻³(8.3 × 10⁻⁴), respectively. The corresponding combined observed (expected) upper limits on the |λt cH| and |λtuH| couplings
are 0.064 (0.055) and 0.066 (0.055), respectively.
© 2019 CERN for the benefit of the ATLAS Collaboration.
1 Introduction
Following the observation of the Higgs boson by the ATLAS and CMS experiments [1,2] at the Large Hadron Collider (LHC), a comprehensive programme of measurements of its properties is underway. An interesting possibility is the presence of flavour-changing neutral-current (FCNC) interactions between the Higgs boson, the top quark, and a u- or c-quark, tqH (q = u, c). Since the Higgs boson is lighter than the top quark [3], such interactions would manifest themselves as FCNC top-quark decays [4], t → Hq. In the Standard Model (SM), such decays are suppressed relative to the dominant t → W b decay mode, since tqH interactions are forbidden at the tree level and suppressed even at higher orders in the perturbative expansion due to the Glashow–Iliopoulos–Maiani (GIM) mechanism [5]. As a result, the SM predictions for the t → Hq branching ratios (B) are exceedingly small, B(t → Hu) ∼ 10−17 and B(t → Hc) ∼ 10−15[6–9], making them undetectable in the foreseeable future. In contrast, large enhancements of these branching ratios are possible in some scenarios beyond the SM. Examples include quark-singlet models [10], two-Higgs-doublet models (2HDM) of type I, with explicit flavour conservation, and of type II, such as the minimal supersymmetric SM (MSSM) [11–14], supersymmetric models with R-parity violation [15], composite Higgs models with partial compositeness [16], or warped extra dimensions models with SM fermions in the bulk [17]. In these scenarios, branching ratios can be as high as B(t → Hq) ∼ 10−5. An even larger branching ratio of B(t → Hc) ∼ 10−3can be reached in 2HDM without explicit flavour conservation (type III), since a tree-level FCNC coupling is not forbidden by any symmetry [18–25]. While other FCNC top couplings (tqγ, tqZ , tqg) are also enhanced in these scenarios beyond the SM, the largest enhancements are typically found for the tqH couplings, and in particular the tcH coupling [4].
Searches for t → Hq decays have been performed by the ATLAS and CMS collaborations, taking advantage of the large samples of top-quark pair (t ¯t) events collected in proton-proton (pp) collisions at centre-of-mass energies of
√
s = 7 TeV and 8 TeV [26–28] during Run 1 of the LHC, as well as at √
s = 13 TeV [29–31] using early Run 2 data. In these searches, one of the top quarks is required to decay into W b, while the other top quark decays into Hq, yielding t ¯t → W bHq.1 The Higgs boson is assumed to have a mass of mH = 125 GeV and to decay as predicted by the SM. The simplifying
assumption of SM-like Higgs boson branching ratios is motivated by the fact that measurements of the flavour-diagonal Higgs boson couplings by the ATLAS and CMS collaborations are in agreement with the SM prediction within about 10% [32,33]. Furthermore, typical beyond-the-SM scenarios that predict significant enhancements to B(t → Hq), also predict modifications to the Higgs boson branching ratios at the few percent level or below, well beyond the current experimental precision. Some of the most sensitive single-channel searches have been performed in the H → γγ decay mode, which has a small branching ratio of B(H → γγ) ' 0.2%, but benefits from having a very small background contamination and excellent diphoton mass resolution. Searches targeting signatures with two same-charge leptons or three leptons (electrons or muons), generically referred to as multileptons, are able to exploit a branching ratio that is significantly larger for the H → WW∗, ττ decay modes than for the H → γγ decay mode, and are also characterised by relatively small backgrounds. Finally, searches have also been performed exploiting the dominant Higgs boson decay mode, H → b ¯b, which has a branching ratio of B(H → b ¯b) ' 58%. Compared with Run 1, the Run 2 searches benefit from the increased t ¯t cross section at
√
s= 13 TeV, as well as the larger integrated luminosity. Using 36.1 fb−1of data at
√
s= 13 TeV, the ATLAS Collaboration has derived upper limits at 95% confidence level (CL) of B(t → Hc) < 0.22% using H → γγ decays [29],
1 In the following, W bHq is used to denote both W+bH ¯q and its charge conjugate, HqW−b. Similarly, W bW b is used to denote¯ +
and of B(t → Hc) < 0.16% based on multilepton signatures resulting from H → WW∗, H → τ+τ−in which both τ-leptons decay leptonically, or H → Z Z∗[30]. These upper limits are derived assuming that B(t → Hu) = 0. Similar upper limits are obtained for B(t → Hu) if B(t → Hc) = 0. The CMS Collaboration has performed a search using H → b ¯b decays [31] with 35.9 fb−1of data at
√
s = 13 TeV, resulting in upper limits of B(t → Hc) < 0.47% and B(t → Hu) < 0.47%, in each case neglecting the other decay mode. Compared with previous searches, the search in Ref. [31] considers in addition the contribution to the signal from pp → t H production [34].
The searches presented in this paper are focussed on fermionic decay modes of the Higgs boson. Therefore, they help to complete the ATLAS experiment’s programme of searches for t → Hq decays based on pp collision data at
√
s = 13 TeV recorded in 2015 and 2016. The corresponding integrated luminosity is 36.1 fb−1. Two analyses are performed, searching for t ¯t → W bHq production (ignoring pp → t H production) and targeting the H → b ¯b and H → τ+τ−decay modes, which this paper refers to as “tqH(b ¯b) search” and “tqH(ττ) search”, respectively. The tqH(b ¯b) search selects events with one isolated electron or muon from the W → `ν decay, and multiple jets, several of which are identified with high purity as originating from the hadronisation of b-quarks. The tqH(ττ) search selects events with two τ-lepton candidates, at least one of which decays hadronically, as well as multiple jets. The latter requirement aims to select events with a hadronically decaying W boson, since this allows an improved reconstruction of the event kinematics. Both searches employ multivariate techniques to discriminate between the signal and the background on the basis of their different kinematics. These two searches are combined with previous ATLAS searches in the diphoton and multilepton final states using the same dataset [29,30], and bounds are set on B(t → Hc) and B(t → Hu), as well as on the corresponding non-flavour-diagonal Yukawa couplings. The combination is performed after verifying the overall consistency of the results obtained by the different searches, which exploit very different experimental signatures and thus are affected by different backgrounds and related systematic uncertainties. By combining all searches, the expected sensitivity is improved by about a factor of two relative to the most sensitive individual results.
2 ATLAS detector
The ATLAS detector [35] at the LHC covers almost the entire solid angle around the collision point,2 and consists of an inner tracking detector surrounded by a thin superconducting solenoid producing a 2 T axial magnetic field, electromagnetic and hadronic calorimeters, and a muon spectrometer incorporating three large toroid magnet assemblies with eight coils each. The inner detector contains a high-granularity silicon pixel detector, including the insertable B-layer [36–38], installed in 2014, and a silicon microstrip tracker, together providing a precise reconstruction of tracks of charged particles in the pseudorapidity range |η| < 2.5. The inner detector also includes a transition radiation tracker that provides tracking and electron identification for |η| < 2.0. The calorimeter system covers the pseudorapidity range |η| < 4.9. Within the region |η| < 3.2, electromagnetic (EM) calorimetry is provided by barrel and endcap high-granularity lead/liquid-argon (LAr) sampling calorimeters, with an additional thin LAr presampler covering |η| < 1.8, to correct for energy loss in material upstream of the calorimeters. Hadronic
2ATLAS uses a right-handed coordinate system with its origin at the nominal interaction point (IP) in the centre of the detector.
The x-axis points from the IP to the centre of the LHC ring, the y-axis points upward, and the z-axis coincides with the axis of the beam pipe. Cylindrical coordinates (r,φ) are used in the transverse plane, φ being the azimuthal angle around the beam pipe. The pseudorapidity is defined in terms of the polar angle θ as η = − ln tan(θ/2). Angular distance is measured in units of ∆R ≡p(∆η)2+ (∆φ)2.
calorimetry is provided by a steel/scintillator-tile calorimeter, segmented into three barrel structures within |η| < 1.7, and two copper/LAr hadronic endcap calorimeters. The solid angle coverage is completed with forward copper/LAr and tungsten/LAr calorimeter modules optimised for electromagnetic and hadronic measurements, respectively. The calorimeters are surrounded by a muon spectrometer within a magnetic field provided by air-core toroid magnets with a bending integral of about 2.5 Tm in the barrel and up to 6 Tm in the endcaps. The muon spectrometer measures the trajectories of muons with |η| < 2.7 using multiple layers of high-precision tracking chambers, and is instrumented with separate trigger chambers covering |η| < 2.4. A two-level trigger system [39], consisting of a hardware-based level-1 trigger followed by a software-based high-level trigger, is used to reduce the event rate to a maximum of around 1 kHz for offline storage.
3 Event reconstruction
The event reconstruction is affected by multiple pp collisions in a single bunch crossing and by collisions in neighbouring bunch crossings, referred to as pile-up. Interaction vertices from the pp collisions are reconstructed from at least two tracks with transverse momentum (pT) larger than 400 MeV that are
consistent with originating from the beam collision region in the x–y plane. If more than one primary vertex candidate is found, the candidate whose associated tracks form the largest sum of squared pT[40] is
selected as the hard-scatter primary vertex.
Electron candidates [41,42] are reconstructed from energy clusters in the EM calorimeter that are matched to reconstructed tracks in the inner detector; electron candidates in the transition region between the EM barrel and endcap calorimeters (1.37 < |ηcluster| < 1.52) are excluded. In the tqH(b¯b) (tqH(ττ))
search, electron candidates are required to have pT > 30 (15) GeV and |ηcluster| < 2.47, and to satisfy
tight (medium) likelihood-based identification criteria [41] based on calorimeter, tracking and combined variables that provide separation between electrons and jets.
Muon candidates [43] are reconstructed by matching track segments in different layers of the muon spectrometer to tracks found in the inner detector; the resulting muon candidates are re-fitted using the complete track information from both detector systems. In the tqH(b ¯b) (tqH(ττ)) search, muon candidates are required to have pT > 30 (10) GeV and |η| < 2.5 and to satisfy medium identification criteria [43].
Electron (muon) candidates are matched to the primary vertex by requiring that the significance of their transverse impact parameter, d0, satisfies |d0/σ(d0)| < 5 (3), where σ(d0) is the measured uncertainty in
d0, and by requiring that their longitudinal impact parameter, z0, satisfies |z0sin θ | < 0.5 mm. To further reduce the background from non-prompt leptons, photon conversions and hadrons, lepton candidates are also required to be isolated in the tracker and in the calorimeter. A track-based lepton isolation criterion is defined by calculating the quantity IR = Í ptrkT , where the scalar sum includes all tracks (excluding the lepton candidate itself) within the cone defined by ∆R < Rcutaround the direction of the lepton. The value
of Rcutis the smaller of rminand 10 GeV/p `
T, where rminis set to 0.2 (0.3) for electron (muon) candidates,
and p`Tis the lepton pT. The tqH(b ¯b) search requires lepton candidates to satisfy IR/p`T< 0.06, while the
tqH(ττ) search makes pT-dependent requirements on IR/p`
T. Additionally, the tqH(ττ) search requires
leptons to satisfy a calorimeter-based isolation criterion: the sum of the transverse energy within a cone of size ∆R < 0.2 around the lepton, after subtracting the contributions from pile-up and the energy deposit of the lepton itself, is required to be less than a pT-dependent fraction of the lepton energy.
Candidate jets are reconstructed with the anti-kt algorithm [44,45] with a radius parameter R = 0.4, as implemented in the FastJet package [46]. Jet reconstruction in the calorimeter starts from topological clustering [47] of individual calorimeter cells calibrated to the electromagnetic energy scale. The reconstructed jets are then calibrated to the particle level by the application of a jet energy scale derived from simulation and in situ corrections based on
√
s = 13 TeV data [48]. The calibrated jets used in the tqH(b ¯b) search are required to have pT > 25 GeV and |η| < 2.5, while the tqH(ττ) search uses jets
with pT > 30 GeV and |η| < 4.5. Jet four-momenta are corrected for pile-up effects using the jet-area
method [49].
Quality criteria are imposed to reject events that contain any jets arising from non-collision sources or detector noise [50]. To reduce the contamination due to jets originating from pile-up interactions, additional requirements are imposed on the jet vertex tagger (JVT) [51] output for jets with pT < 60 GeV and |η| < 2.4,
or on the forward JVT [52] output for jets with pT < 50 GeV and |η| > 2.5.
Jets containing b-hadrons are identified (b-tagged) via an algorithm [53,54] that uses multivariate techniques to combine information about the impact parameters of displaced tracks and the topological properties of secondary and tertiary decay vertices reconstructed within the jet. For each jet, a value for the multivariate b-tagging discriminant is calculated. In the tqH(ττ) search, a jet is considered b-tagged if this value is above the threshold corresponding to an average 70% efficiency to tag a b-quark jet, with a light-jet3 rejection factor of about 380 and a charm-jet rejection factor of about 12, as determined for jets with pT > 20 GeV and |η| < 2.5 in simulated t¯t events. In contrast, the tqH(b¯b) search employs a tighter b-tagging requirement, corresponding to an average efficiency of 60% to tag a b-quark jet, and light-jet and charm-jet rejection factors of about 1500 and 34, respectively.
Hadronically decaying τ-lepton (τhad) candidates are reconstructed from energy clusters in the calorimeters
and associated inner-detector tracks [55]. Candidates are required to have either one or three associated tracks, with a total charge of ±1. Candidates are required to have pT > 25 GeV and |η| < 2.5, excluding the
EM calorimeter’s transition region. A boosted decision tree (BDT) discriminant [56–58] using calorimeter-and tracking-based variables is used to identify τhadcandidates and reject jet backgrounds. Three working
points labelled loose, medium and tight are defined, and correspond to different τhadidentification efficiency
values, with the efficiency designed to be independent of pT. The tqH(ττ) search uses the medium working
point for the nominal selection, while the loose working point is used for background estimation. The medium working point has a combined reconstruction and identification efficiency of 55% (40%) for one-prong (three-prong) τhaddecays [59], and an expected rejection factor against light-jets of 100 [55].
Electrons that are reconstructed as one-prong τhad candidates are removed via a BDT trained to reject
electrons. Any τhadcandidate that is also b-tagged is rejected.
Overlaps between reconstructed objects are removed sequentially. In the tqH(b ¯b) search, firstly, electron candidates that lie within ∆R = 0.01 of a muon candidate are removed to suppress contributions from muon bremsstrahlung. Overlaps between electron and jet candidates are resolved next, and finally, overlaps between remaining jet candidates and muon candidates are removed. Energy clusters from identified electrons are not excluded during jet reconstruction. In order to avoid double-counting of electrons as jets, the closest jet whose axis is within ∆R = 0.2 of an electron is discarded. If the electron is within ∆R = 0.4 of the axis of any jet after this initial removal, the jet is retained and the electron is removed. The overlap removal procedure between the remaining jet candidates and muon candidates is designed to remove those muons that are likely to have arisen in the decay of hadrons and to retain the overlapping jet instead. Jets and muons may also appear in close proximity when the jet results from high-pTmuon bremsstrahlung,
and in such cases the jet should be removed and the muon retained. Such jets are characterised by having very few matching inner-detector tracks. Selected muons that satisfy ∆R(µ, jet) < 0.04 + 10 GeV/pµTare rejected if the jet has at least three tracks originating from the primary vertex; otherwise the jet is removed and the muon is kept. The overlap removal procedure in the tqH(ττ) search is similar to that of the tqH(b ¯b) search, except that the first step is the removal of τhadcandidates within ∆R = 0.2 of electrons or muons,
and the last step is the removal of jets whose axis lies within ∆R = 0.2 of the leading (highest-pT) τhad
candidate or the two leading τhadcandidates (depending on the search channel). In addition, the muon–jet
overlap removal is slightly different: if a muon lies within ∆R = 0.2 of the axis of a jet, the jet is removed if either it has fewer than three tracks originating from the primary vertex or it has a small pTcompared
with that of the muon (the pTof the jet is less than 50% of the pTof the muon, or the scalar sum of the pT
of the tracks associated with the jet is less than 70% of the pTof the muon).
The missing transverse momentum ®pTmiss(with magnitude ETmiss) is defined as the negative vector sum of the pTof all selected and calibrated objects in the event, including a term to account for momentum
from soft particles in the event which are not associated with any of the selected objects. This soft term is calculated from inner-detector tracks matched to the selected primary vertex to make it more resilient to contamination from pile-up interactions [60].
4 Data sample and event preselection
Both searches are based on a dataset of pp collisions at √
s = 13 TeV with 25 ns bunch spacing collected in 2015 and 2016, corresponding to an integrated luminosity of 36.1 fb−1. Only events recorded with a single-electron trigger, a single-muon trigger, or a di-τ trigger under stable beam conditions and for which all detector subsystems were operational are considered. The number of pp interactions per bunch crossing in this dataset ranges from about 8 to 45, with an average of 24.
Single-electron and single-muon triggers with low pT thresholds and lepton isolation requirements are
combined in a logical OR with higher-threshold triggers but with a looser identification criterion and without any isolation requirement. The lowest pTthreshold used for muons is 20 (26) GeV in 2015 (2016),
while for electrons the threshold is 24 (26) GeV. For di-τ triggers, the pTthreshold of the leading (trailing)
τhadcandidate is 35 (25) GeV. In both searches, events satisfying the trigger selection are required to have at least one primary vertex candidate.
Events selected by the tqH(b ¯b) search are recorded with a single-electron or single-muon trigger and are required to have exactly one electron or muon that matches, with ∆R < 0.15, the lepton reconstructed by the trigger. Furthermore, at least four jets are required, of which at least two must be b-tagged.
In the tqH(ττ) search, events are classified into τlepτhadand τhadτhadchannels depending on the multiplicity
of selected leptons. Events in the τlepτhad channel are recorded with a single-electron or single-muon
trigger and are required to have exactly one selected electron or muon and at least one τhadcandidate. The
selected electron or muon is required to match, with ∆R < 0.15, the lepton reconstructed by the trigger and to have a pT exceeding the trigger pT threshold by 1 GeV or 2 GeV (depending on the lepton trigger
and data-taking conditions). In addition, its electric charge is required to be of opposite sign to that of the leading τhadcandidate. Events in the τhadτhadchannel are recorded with a di-τ trigger, and are required to
have at least two τhadcandidates and no selected electrons or muons. The two leading τhadcandidates are
required to have charges of opposite sign. In addition, in both tqH(ττ) search channels, trigger matching for τ candidates, at least three jets and exactly one b-tagged jet are required.
Table 1: Summary of preselection requirements for the tqH(b ¯b) and tqH(ττ) searches. The leading and trailing τhad
candidates are denoted by τhad,1and τhad,2respectively.
Preselection requirements
Requirement tqH(b ¯b) search tqH(ττ) search
τlepτhadchannel τhadτhadchannel
Trigger single-lepton trigger single-lepton trigger di-τ trigger
Leptons =1 isolated e or µ =1 isolated e or µ no isolated e or µ
– ≥1 τhad ≥2 τhad
Electric charge (q) – q`× qτhad, 1 < 0 qτhad, 1× qτhad, 2 < 0
Jets ≥4 jets ≥3 jets ≥3 jets
b-tagging ≥2 b-tagged jets =1 b-tagged jets =1 b-tagged jets
The above requirements apply to the reconstructed objects defined in Section3. These requirements, which ensure a negligible overlap between the tqH(b ¯b) and tqH(ττ) searches, are referred to as the preselection and are summarised in Table1.
5 Signal and background modelling
Signal and most background processes are modelled using Monte Carlo (MC) simulation. After the event preselection, the main background is t ¯t production, often in association with jets, denoted by t ¯t+jets in the following. Small contributions arise from single-top-quark, W /Z +jets, multijet and diboson (WW, W Z, Z Z ) production, as well as from the associated production of a vector boson V (V = W, Z ) or a Higgs boson and a t ¯t pair (t ¯tV and t ¯tH). All backgrounds with prompt leptons, i.e. those originating from the decay of a W boson, a Z boson, or a τ-lepton, are estimated using samples of simulated events and initially normalised to their theoretical cross sections. In the simulation, the top-quark and SM Higgs boson masses are set to 172.5 GeV and 125 GeV, respectively, and the Higgs boson is allowed to decay into all SM particles with branching ratios calculated using Hdecay [61]. Backgrounds with non-prompt electrons or muons, with photons or jets misidentified as electrons, or with jets misidentified as τhadcandidates, generically
referred to as fake leptons, are estimated using data-driven methods. The background prediction is further improved during the statistical analysis by performing a likelihood fit to data using several signal-depleted analysis regions, as discussed in Sections6and7.
5.1 Simulated signal and background processes
Samples of simulated t ¯t → W bHq events were generated with the next-to-leading-order (NLO) generator4 Madgraph5_aMC@NLO 2.4.3 [62] (referred to in the following as MG5_aMC) with the NNPDF3.0 NLO [63] parton distribution function (PDF) set and interfaced to Pythia 8.212 [64] with the NNPDF2.3
4In the following, the order of a generator should be understood as referring to the order in the strong coupling constant at which
LO [65] PDF set for the modelling of parton showering, hadronisation, and the underlying event. The A14 [66] set of tuned parameters in Pythia controlling the description of multiparton interactions and initial- and final-state radiation, referred to as the tune, was used. The signal sample is normalised to the same total cross section as used for the inclusive t ¯t → W bW b sample (see discussion below) and assuming an arbitrary branching ratio of Bref(t → Hq) = 1%. The case of both top quarks decaying into Hq is
neglected in the analysis given the existing upper limits on B(t → Hq) (Section1).
The nominal sample used to model the t ¯t background was generated with the NLO generator Powheg-Box v2 [67–70] using the NNPDF3.0 NLO PDF set. The Powheg-Box model parameter hdamp, which
controls matrix element to parton shower matching and effectively regulates the high-pTradiation, was set
to 1.5 times the top-quark mass. The parton showers, hadronisation, and underlying event were modelled by Pythia 8.210 with the NNPDF2.3 LO PDF set in combination with the A14 tune. Alternative t ¯t simulation samples used to derive systematic uncertainties are described in Section8.3. The generated t ¯t samples are normalised to a theoretical cross section of 832+46−51pb, computed using Top++ v2.0 [71] at next-to-next-to-leading order (NNLO), including resummation of next-to-next-to-leading logarithmic (NNLL) soft gluon terms [72–76].
The t ¯t background selected by the tqH(b ¯b) search is enriched in t ¯t+heavy-flavour production, and thus requires a more sophisticated treatment than provided by the nominal t ¯t sample; this treatment is briefly outlined below. A detailed discussion can be found in Ref. [77]. The simulated t ¯t events are categorised depending on the flavour content of additional particle jets not originating from the decay of the t ¯t system. Events labelled as either t ¯t+≥1b or t ¯t+≥1c are generically referred to in the following as t ¯t+HF events, where HF stands for heavy flavour. The remaining events are labelled as t ¯t+light-jets events, including those with no additional jets. A finer categorisation of t ¯t+≥1b events is considered for the purpose of applying further corrections and assigning systematic uncertainties associated with the modelling of heavy-flavour production in different event topologies [77]. In particular, the t ¯t+≥1b events are reweighted to an NLO prediction in the four-flavour (4F) scheme of t ¯t+≥1b production including parton showering [78], based on Sherpa+OpenLoops [79,80] (referred to as SherpaOL in the following) using the CT10 4F PDF set. This reweighting is performed in such a way that the inter-normalisations of the t ¯t+≥1b categories are at NLO accuracy, while preserving the t ¯t+≥1b cross section of the nominal t ¯t sample. This reweighting is also applied to the alternative t ¯t samples that are used to study systematic uncertainties.
Samples of single-top-quark events corresponding to the t-channel production mechanism were generated with the Powheg-Box v1 [81] generator, using the 4F scheme for the NLO matrix-element calculations and the fixed 4F CT10f4 [82] PDF set. Samples corresponding to the tW - and s-channel production mechanisms were generated with Powheg-Box v1 using the CT10 PDF set. Overlaps between the t ¯t and tW final states were avoided by using the diagram removal scheme [83]. The parton showers, hadronisation and the underlying event were modelled using Pythia 6.428 [84] with the CTEQ6L1 [85,86] PDF set in combination with the Perugia 2012 tune [87]. The single-top-quark samples are normalised to the approximate NNLO theoretical cross sections [88–90].
Samples of W /Z +jets events were generated with the Sherpa 2.2.1 [79] generator. The matrix element was calculated for up to two partons at NLO and up to four partons at LO using Comix [91] and OpenLoops [80]. The matrix-element calculation is merged with the Sherpa parton shower [92] using the ME+PS@NLO prescription [93]. The PDF set used for the matrix-element calculation is NNPDF3.0 NNLO [63] with a dedicated parton shower tuning developed for Sherpa. Separate samples were generated for different W /Z+jets categories using filters for a b-jet (W/Z+≥1b+jets), a c-jet and no b-jet (W/Z+≥1c+jets), and with a veto on b- and c-jets (W /Z +light-jets), which are combined into the inclusive W /Z +jets samples.
Both the W +jets and Z +jets samples are normalised to their respective inclusive NNLO theoretical cross sections calculated with FEWZ [94].
Samples of WW /W Z /Z Z +jets events were generated with Sherpa 2.2.1 using the CT10 PDF set and include processes containing up to four electroweak vertices. In the case of WW /W Z +jets (Z Z +jets) the matrix element was calculated for zero (up to one) additional partons at NLO and up to three partons at LO using the same procedure as for the W /Z +jets samples. The final states simulated require one of the bosons to decay leptonically and the other hadronically. All diboson samples are normalised to their NLO theoretical cross sections provided by Sherpa.
Samples of t ¯tV and t ¯tH events were generated with MG5_aMC 2.2.1, using NLO matrix elements and the NNPDF3.0 NLO PDF set, and interfaced to Pythia 8.210 with the NNPDF2.3 LO PDF set and the A14 tune. Instead, the t ¯tV samples used in the tqH(b ¯b) search are based on LO matrix elements computed for up to two additional partons using the NNPDF3.0 NLO PDF set, and merged using the CKKW-L approach [95]. The t ¯tV samples are normalised to the NLO cross section computed with MG5_aMC, while the t ¯tH sample is normalised using the NLO cross section recommended in Ref. [96].
All generated samples, except those produced with the Sherpa [79] event generator, utilise EvtGen 1.2.0 [97] to model the decays of heavy-flavour hadrons. To model the effects of pile-up, events from minimum-bias interactions were generated using Pythia 8.186 [64] in combination with the A2 tune [98], and overlaid onto the simulated hard-scatter events according to the luminosity profile of the recorded data. The generated events were processed through a simulation [99] of the ATLAS detector geometry and response using Geant4 [100]. A faster simulation, where the full Geant4 simulation of the calorimeter response is replaced by a detailed parameterisation of the shower shapes [101], was adopted for some of the samples used to estimate systematic uncertainties in background modelling. Simulated events were processed through the same reconstruction software as the data, and corrections were applied so that the object identification efficiencies, energy scales and energy resolutions match those determined from data control samples.
5.2 Backgrounds with fake leptons
5.2.1 Fake electrons and muons
In the tqH(b ¯b) search, the background from multijet production (multijet background in the following) contributes to the selected data sample via several production and misreconstruction mechanisms. In the electron channel, it consists of non-prompt electrons (from semileptonic b- or c-hadron decays) as well as misidentified photons (from a conversion of a photon into an e+e−pair) or jets with a high fraction of their energy deposited in the EM calorimeter. In the muon channel, the multijet background originates mainly from non-prompt muons. The multijet background normalisation and shape are estimated directly from data by using the matrix method technique [102,103], which exploits differences in lepton identification and isolation properties between prompt leptons and leptons that are either non-prompt or result from the misidentification of photons or jets.
5.2.2 Fakeτ-lepton candidates
In the tqH(ττ) search, the background with one or more fake τhadcandidates mainly arises from t ¯t or
extent. Studies based on the simulation show that, for all the above processes, fake τhadcandidates primarily
result from the misidentification of light-quark jets, with the contribution from b-quarks and gluon jets playing a subdominant role. It is also found that the fake rate decreases for all jet flavours as the τhad
candidate pTincreases.
This background is estimated directly from data by defining control regions (CR) enriched in fake τhad
candidates via loosened τhad requirements or flipped charge. These CRs do not overlap with the main
search regions (SRs), discussed in Section7. The CR selection requirements are analogous to those used to define the different SRs, except that the leading (trailing) τhadcandidate in the τlepτhad(τhadτhad) channel
is required to fail the medium τhadidentification but pass the loose identification, or the two τhadcandidates
have the same charge.
The fake τhad background prediction in a given SR is modelled by the distribution (referred to as the
fake τhadtemplate) derived from data in the corresponding CR. The fake τhad template is defined as the
data distribution from which the contributions from the simulated backgrounds with real τhadcandidates,
originating primarily from W (→ τν)+jets and Z (→ ττ)+jets, are subtracted. In the τlepτhad channel,
simulation studies indicate that the fake τhadbackground composition is consistent between the SR and
the CR, and dominated by t ¯t production. In the τhadτhad channel, the fake τhad background is expected
to be dominated by multijet production. However, simulation studies indicate that the contribution of t ¯t events to the fake τhadbackground is higher in the SR than in the CR. Therefore, an appropriate number of
simulated t ¯t events with fake τhadcandidates in the CR is added to the fake τhadtemplate to match the fake
τhadbackground composition in the SR. In both the τlepτhadand τhadτhadchannels, the fake τhadtemplate in each SR is initially normalised to the estimated fake τhadbackground yield, defined as the data yield
minus the contributions from the simulated backgrounds with real τhad candidates (assuming no signal
contribution). During the statistical analysis, the normalisation of the fake τhad background in each SR is
allowed to vary freely in the fit to data, as discussed in Section10.2.
6 Strategy for the
t qH(b ¯
b) search
This section presents an overview of the analysis strategy adopted in the tqH(b ¯b) search, which closely follows that of the previous search performed on the Run 1 dataset [27].
6.1 Event categorisation
Given that the W → `ν and H → b ¯b decay modes are chosen, the t ¯t → W bHq signal is expected to have four jets in the final state, three of them originating from b-quarks, which can be effectively exploited to suppress the background. Additional jets can also be present because of initial- or final-state radiation. However, the use of the 60% b-tagging efficiency operating point, characterised by a low mistag rate for c-and light-jets, results in both the t ¯t → W bHc c-and t ¯t → W bHu signals having a similar b-tag multiplicity distribution, with a very small fraction of events having four or more b-tagged jets.
In order to optimise the sensitivity of the search, the selected events are categorised into different analysis regions depending on the number of jets (4, 5 and ≥6) and on the number of b-tagged jets (2, 3 and ≥4). Therefore, a total of nine analysis regions are considered: (4j, 2b), (4j, 3b), (4j, 4b), (5j, 2b), (5j, 3b), (5j, ≥4b), (≥6j, 2b), (≥6j, 3b), and (≥6j, ≥4b), where (nj, mb) indicates n selected jets and m b-tagged jets.
4j, 2b 5j, 2b 6j, 2b≥ 4j, 3b 5j, 3b 6j, 3b≥ 4j, 4b 4b ≥ 5j, 4b ≥ 6j, ≥ Data / Bkg 0.5 0.75 1 1.25 1.5 Events 10 2 10 3 10 4 10 5 10 6 10 7 10 ATLAS -1 = 13 TeV, 36.1 fb s ) search b tqH(b Pre-Fit ℬ ℬ Data WbHc ( =1%) → t t WbHu ( =1%) → t t +light-jets t t 1c ≥ + t t 1b ≥ + t t t Non-t Total Bkg unc.
Figure 1: tqH(b ¯b) search: Comparison between the data and predicted background for the event yields in each of the analysis regions considered before the fit to data (“Pre-Fit”). All events satisfy the preselection requirements, whereas those with exactly two b-tagged jets are in addition required to have a value of the likelihood discriminant above 0.6 (see Section6.2). Backgrounds are normalised to their nominal cross sections. The small contributions from W /Z +jets, single-top-quark, diboson and multijet backgrounds are combined into a single background source referred to as “Non-t ¯t”. The expected t ¯t → W bHc and t ¯t → W bHu signals (dashed histograms) are shown separately normalised to B(t → Hq) = 1%. The bottom panel displays the ratio of data to the SM background (“Bkg”) prediction. The hashed area represents the total uncertainty of the background, excluding the normalisation uncertainty of the t ¯t+ ≥ 1b background, which is determined via a likelihood fit to data.
The overall rate and composition of the t ¯t+jets background strongly depends on the jet and b-tag multiplicities, as illustrated in Figure1. Regions with exactly two b-tagged jets are dominated by t ¯t+light-jets, while regions with at least four b-tagged jets are dominated by t ¯t+≥1b. Intermediate compositions are found in regions with exactly three b-tagged jets. Most of the t ¯t+light-jets background events in these regions have a b-tagged charm jet from the hadronic W boson decay, in addition to the two b-jets from the top-quark decays.
In the regions with four or five jets and exactly three b-tagged jets, which dominate the sensitivity of this search, the selected signal events have a H → b ¯b decay in more than 97% of the events. The other regions have significantly lower signal-to-background ratios, but they are used to improve the t ¯t+jets background prediction and constraining the related systematic uncertainties through a likelihood fit to data. Because of a somewhat larger fraction of t ¯t → W bHc signal in the regions with exactly three b-tagged jets, resulting from the higher mistag rate for c-jets than for light-jets, this analysis is expected to have slightly better sensitivity to a t ¯t → W bHc signal than to a t ¯t → W bHu signal.
6.2 Likelihood discriminant
After event categorisation, the signal-to-background ratio is insufficient even in the best cases to achieve sensitivity, and a suitable discriminating variable between signal and background needs to be constructed in order to improve the sensitivity of the search. Since both signal and background result from the t ¯t decay, their discrimination is a challenge and it is based on a few measured quantities. The most prominent features are the different resonances present in the decay (the Higgs boson in the case of the t ¯t → W bHq signal and a hadronically decaying W boson in the case of the t ¯t → W bW b background), and the different flavours of the jets forming those resonances. However, the large number of jets in the final state causes ambiguities in the calculation of these kinematic variables to discriminate signal events from background events.
This search uses a likelihood (LH) discriminant similar to that developed in Ref. [27]. The LH variable for a given event is defined as:
L(x)= P
sig(x)
Psig(x)+ Pbkg(x),
where Psig(x) and Pbkg(x) represent the probability density functions (pdf) of a given event under the signal hypothesis (t ¯t → W bHq) and under the background hypothesis (t ¯t → W bW b), respectively. Both Psigand Pbkgare functions of x, representing the four-momentum vectors of all final-state particles at
the reconstruction level: the lepton, the missing transverse momentum, and the selected jets in a given analysis region. The value of the multivariate b-tagging discriminant for each jet is also included in x. As in Ref. [27], Psigand Pbkgare approximated as a product of one-dimensional pdfs over the set of two-body and three-body invariant masses that correspond to the expected resonances in the event (the leptonically decaying W boson, the Higgs boson or the hadronically decaying W boson, and the corresponding parent top quarks) and averaged over all possible parton–jet matching combinations. Combinations are weighted using the per-jet multivariate b-tagging discriminant value to suppress the impact from parton–jet assignments that are inconsistent with the correct flavour of the parton candidates. The invariant masses are computed from the reconstructed lepton, missing transverse momentum, and jets. After a suitable transformation of the three-body invariant masses (see Ref. [27]), all considered invariant mass variables are largely uncorrelated, thus making possible the factorisation of Psigand Pbkgas discussed above.
Two background hypotheses are considered, corresponding to the dominant backgrounds in the analysis: t ¯t+light-jets and t ¯t+≥1b. Thus, Pbkgis computed as the average of the pdfs for the two hypotheses, weighted
by their relative fractions found in simulated t ¯t+jets events, which depend on the analysis region considered. Furthermore, in a significant fraction of t ¯t → W bHq simulated events (about 40–50% in regions with exactly three b-tagged jets), the light-quark jet from the hadronic top-quark decay is not among the selected jets. Similarly, in about 30–40% (50–90%) of simulated t ¯t+light-jets (t ¯t+ ≥ 1b) background events in regions with exactly three b-tagged jets, the light-quark jet originating from the W boson decay is also not selected. Thus, the calculation of Psigand Pbkgalso includes an additional hypothesis to account for this topology, again weighted by the corresponding fractions. In this case, the invariant masses involving the missing jet are computed using the highest-pTjet not matched to a decay product from the t ¯t system.
Figure2shows a comparison between data and prediction in the most sensitive analysis region, (4j, 3b), for several kinematic variables associated with the reconstructed lepton, jets, and missing transverse momentum. The distributions shown correspond to the lepton pT, the ETmiss, the scalar sum of the transverse
momenta of the jets, and the invariant mass distribution of the two b-tagged jets with lowest ∆R separation. The variables displayed do not correspond directly to those used internally in the evaluation the LH
jet permutation. Instead, these distributions are shown to demonstrate that a good description of the data by the background prediction is observed in several kinematic variables related to the information used in the LH discriminant construction.
Figure3compares the shape of the LH discriminant distribution between the t ¯t → W bHc and t ¯t → W bHu signals and the t ¯t → W bW b background in each of the analysis regions considered. Since this analysis has higher expected sensitivity to a t ¯t → W bHc signal than to a t ¯t → W bHu signal, in order to allow probing of the B(t → Hu) versus B(t → Hc) plane, the LH discriminant optimised for t ¯t → W bHc is used for both decay modes. It was verified that using the t ¯t → W bHc discriminant for the t ¯t → W bHu search does not result in a significant sensitivity loss.
[GeV] T Lepton p 50 100 150 200 250 300 Data / Bkg 0.5 0.75 1 1.25 1.5 Events / 20 GeV 0 1000 2000 3000 4000 5000 6000 ATLAS -1 = 13 TeV, 36.1 fb s ) search b tqH(b 4j, 3b Pre-Fit ℬ Data WbHc ( =1%) → t t +light-jets t t 1c ≥ + t t 1b ≥ + t t t Non-t Total Bkg unc. (a) [GeV] miss T E 0 50 100 150 200 250 300 Data / Bkg 0.5 0.75 1 1.25 1.5 Events / 20 GeV 0 500 1000 1500 2000 2500 3000 3500 4000 4500 ATLAS -1 = 13 TeV, 36.1 fb s ) search b tqH(b 4j, 3b Pre-Fit ℬ Data WbHc ( =1%) → t t +light-jets t t 1c ≥ + t t 1b ≥ + t t t Non-t Total Bkg unc. (b) [GeV] had T H 100 150 200 250 300 350 400 450 500 550 600 Data / Bkg 0.5 0.75 1 1.25 1.5 Events / 50 GeV 0 1000 2000 3000 4000 5000 ATLAS -1 = 13 TeV, 36.1 fb s ) search b tqH(b 4j, 3b Pre-Fit ℬ Data WbHc ( =1%) → t t +light-jets t t 1c ≥ + t t 1b ≥ + t t t Non-t Total Bkg unc. (c) [GeV] R ∆ min bb m 0 50 100 150 200 250 300 Data / Bkg 0.5 0.75 1 1.25 1.5 Events / 20 GeV 0 500 1000 1500 2000 2500 3000 ATLAS -1 = 13 TeV, 36.1 fb s ) search b tqH(b 4j, 3b Pre-Fit ℬ Data WbHc ( =1%) → t t +light-jets t t 1c ≥ + t t 1b ≥ + t t t Non-t Total Bkg unc. (d)
Figure 2: tqH(b ¯b) search: Comparison between the data and predicted background after preselection for several kinematic distributions in the (4j, 3b) region before the fit to data (“Pre-Fit”). The distributions are shown for (a) lepton pT, (b) ETmiss, (c) scalar sum of the transverse momenta of the jets (HThad), and (d) the invariant mass of the
two b-tagged jets with lowest ∆R separation (mmin∆Rbb ). The small contributions from t ¯tV , t ¯tH, single-top-quark, W /Z+jets, diboson, and multijet backgrounds are combined into a single background source referred to as “Non-t ¯t”. The expected t ¯t → W bHc signal (solid red) corresponding to B(t → Hc) = 1% is also shown, added to the background prediction. The last bin in all figures contains the overflow. The bottom panel displays the ratio of data to the SM background (“Bkg”) prediction. The blue triangles indicate points that are outside the vertical range of the figure. The hashed area represents the total uncertainty of the background, excluding the normalisation uncertainty of the t ¯t+ ≥ 1b background, which is determined via a likelihood fit to data.
LH discriminant 0 0.1 0.2 0.3 0.4 0.5 0.6 0.7 0.8 0.9 1 Fraction of events / 0.1 0 0.02 0.04 0.06 0.08 0.1 0.12 0.14 0.16 0.18 0.2 0.22 4j, 2b ) search b tqH(b =13 TeV s Simulation ATLAS tt→WbWb WbHc → t t WbHu → t t (a) LH discriminant 0 0.1 0.2 0.3 0.4 0.5 0.6 0.7 0.8 0.9 1 Fraction of events / 0.1 0 0.05 0.1 0.15 0.2 0.25 4j, 3b ) search b tqH(b =13 TeV s Simulation ATLAS tt→WbWb WbHc → t t WbHu → t t (b) LH discriminant 0 0.1 0.2 0.3 0.4 0.5 0.6 0.7 0.8 0.9 1 Fraction of events / 0.1 0 0.2 0.4 0.6 0.8 1 1.2 4j, 4b ) search b tqH(b =13 TeV s Simulation ATLAS tt→WbWb WbHc → t t WbHu → t t (c) LH discriminant 0 0.1 0.2 0.3 0.4 0.5 0.6 0.7 0.8 0.9 1 Fraction of events / 0.1 0 0.05 0.1 0.15 0.2 0.25 5j, 2b ) search b tqH(b =13 TeV s Simulation ATLAS tt→WbWb WbHc → t t WbHu → t t (d) LH discriminant 0 0.1 0.2 0.3 0.4 0.5 0.6 0.7 0.8 0.9 1 Fraction of events / 0.1 0 0.05 0.1 0.15 0.2 0.25 5j, 3b ) search b tqH(b =13 TeV s Simulation ATLAS tt→WbWb WbHc → t t WbHu → t t (e) LH discriminant 0 0.1 0.2 0.3 0.4 0.5 0.6 0.7 0.8 0.9 1 Fraction of events / 0.1 0 0.2 0.4 0.6 0.8 1 4b ≥ 5j, ) search b tqH(b =13 TeV s Simulation ATLAS tt→WbWb WbHc → t t WbHu → t t (f) LH discriminant 0 0.1 0.2 0.3 0.4 0.5 0.6 0.7 0.8 0.9 1 Fraction of events / 0.1 0 0.05 0.1 0.15 0.2 0.25 6j, 2b ≥ b) search tqH(b =13 TeV s Simulation ATLAS tt→WbWb WbHc → t t WbHu → t t (g) LH discriminant 0 0.1 0.2 0.3 0.4 0.5 0.6 0.7 0.8 0.9 1 Fraction of events / 0.1 0 0.05 0.1 0.15 0.2 0.25 0.3 0.35 6j, 3b ≥ b) search tqH(b =13 TeV s Simulation ATLAS tt→WbWb WbHc → t t WbHu → t t (h) LH discriminant 0 0.1 0.2 0.3 0.4 0.5 0.6 0.7 0.8 0.9 1 Fraction of events / 0.1 0 0.2 0.4 0.6 0.8 1 4b ≥ 6j, ≥ b) search tqH(b =13 TeV s Simulation ATLAS tt→WbWb WbHc → t t WbHu → t t (i)
Figure 3: tqH(b ¯b) search: Comparison of the distributions of the LH discriminant after preselection of the t ¯t → W bHc (red dashed) and t ¯t → W bHu (blue dotted) signals, and the t ¯t → W bW b background (black solid) in different regions considered in the analysis: (a) (4j, 2b), (b) (4j, 3b), (c) (4j, 4b), (d) (5j, 2b), (e) (5j, 3b), (f) (5j, ≥4b), (g) (≥6j, 2b), (h) (≥6j, 3b), and (i) (≥6j, ≥4b). In the regions with ≥4 b-tagged jets, the signal acceptance is small, which translates into a small number of events for the simulated samples. Therefore, only two bins are used for these distributions.
7 Strategy for the
t qH(ττ) search
The analysis strategy adopted in the tqH(ττ) search closely follows that developed in Ref. [104] and is summarised in this section.
7.1 Event categorisation and kinematic reconstruction
In the tqH(ττ) search, the t ¯t → W bHq signal being probed is characterised by the presence of τ-leptons from the decay of the Higgs boson and at least four jets, only one of which originates from a b-quark. If one of the τ-leptons decays leptonically, an isolated electron or muon and significant ETmissis also expected. However, in a significant fraction of the events the lowest-pTjet from the W boson decay fails the minimum
pTrequirement of 30 GeV, resulting in signal events with only three jets reconstructed. In order to optimise the sensitivity of the search, the selected events are categorised into four SRs depending on the number of τlepand τhadcandidates, and on the number of jets: (τlepτhad, 3j), (τlepτhad, ≥4j), (τhadτhad, 3j), and (τhadτhad,
≥4j).
This event categorisation is primarily motivated by the different quality of the event kinematic reconstruction, depending on the amount of ETmissin the event (larger in τlepτhadevents compared with τhadτhadevents),
and whether a jet from the hadronic top-quark decay is missing or not (events with exactly three jets or at least four jets). The event kinematic reconstruction is based on the strategy used in Ref. [104], and is summarised below.
Events with exactly three jets that are compatible with having a fully reconstructed hadronically decaying top quark (t → W b → qqb) are rejected, as the t → Hq decay cannot be reconstructed due to the missing light-quark jet. This compatibility is assessed via a likelihood function that depends on the reconstructed mass of the three-jet system and the two non-b-tagged jets. For the remaining events, the selected jets are assigned to the different top-quark decay products via a criterion based on minimising a sum of angular distances between objects. Finally, the four-momenta of the invisible decay products for each τ-lepton decay are estimated by minimising a χ2function based on the probability density functions for the angular distance of the visible and invisible products of the τ-lepton decay, and including Gaussian constraints on the τ-lepton mass, the Higgs boson mass and the measured ETmisswithin their expected resolutions. The resolution on the τ-lepton mass and the Higgs boson mass are taken to be 1.8 GeV and 20 GeV, respectively, while the resolution on the measured ETmiss is parameterised as a linear function of
√
Í ET, withÍ ET
denoting the scalar sum of the pT of all physics objects contributing to the ETmiss reconstruction [60].
After the χ2 minimisation, the Higgs boson four-momentum, and hence its invariant mass, as well as the four-momentum of the parent top quark, are determined with better resolution. Following the event kinematic reconstruction, several kinematic variables that discriminate between signal and background are defined. These variables are used in the multivariate analysis discussed in the next section.
7.2 Multivariate discriminant
Boosted decision trees are used in each SR to improve the separation between signal and background. In the training, only t ¯t → W (qq)bH(ττ)q signal events are used against the total SM background (including both real and fake τhadcontributions), whereas to obtain the result the contributions from t ¯t → W (`ν)bHq
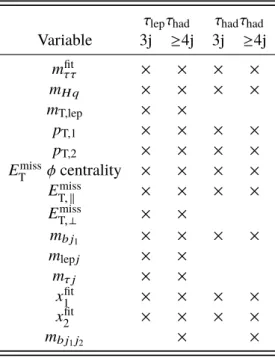
Table 2: tqH(ττ) search: Discriminating variables used in the training of the BDT for each search region (denoted by ×). The description of each variable is provided in the text.
τlepτhad τhadτhad
Variable 3j ≥4j 3j ≥4j mfit ττ × × × × mH q × × × × mT,lep × × pT,1 × × × × pT,2 × × × × Emiss T φ centrality × × × × Emiss T, k × × × × Emiss T,⊥ × × mb j1 × × × × mlep j × × mτ j × × xfit 1 × × × × xfit 2 × × × × mb j1j2 × ×
A large set of potential variables were investigated in each SR separately, and only those variables that led to better discrimination by the BDT were kept. The discrimination of a given variable was quantified by the “separation" and “importance" measures provided by the TMVA package [105]. The BDT input variables in each SR are listed in Table2and defined in the following:
• mττfit: the invariant mass of the two τ-lepton candidates after the reconstruction of the neutrinos, indicating the reconstructed Higgs boson mass.
• mH q: the invariant mass of the reconstructed Higgs boson and the associated light-quark jet in the t → Hq decay, corresponding to the reconstructed mass of the parent top quark.
• mT,lep: the transverse mass calculated from the lepton and ®pTmissin the τlepτhadchannel.
• pT,1 and pT,2: the transverse momenta of the lepton and τhadcandidate (referred to as particles 1 and
2 respectively) in the τlepτhad channel, or the transverse momenta of the leading and trailing τhad
candidates (referred to as particles 1 and 2 respectively) in the τhadτhadchannel.
• ETmiss φ centrality: a variable that quantifies the angular position of ®pTmissrelative to the visible τ-lepton decay products in the transverse plane. It is defined as:
Emiss
T φ centrality =
sin(φmiss−φ1)+ sin(φmiss−φ2)
p
sin2(φmiss−φ1)+ sin2(φmiss−φ2)
where φmissdenotes the azimuthal angle of ®pTmiss, and φ1and φ2denote the azimuthal angles the two
τ-lepton candidates (the lepton and τhadcandidate in the τlepτhadchannel, or the leading and trailing
• Emiss
T, k : the magnitude of the projection of the original ®p miss
T vector parallel to the fitted ®p miss T vector,
minus the magnitude of the fitted ®pTmissvector.
• ET,⊥miss: the magnitude of the projection of the original ®pTmissvector perpendicular to the fitted ®pTmiss vector.
• mb j1: the invariant mass of the b-jet and the leading jet candidate from the hadronically decaying W
boson.
• mlep j: the invariant mass of the lepton and the jet that has the smallest angular distance to the τlep
candidate.
• mτ j: the invariant mass of the τhadcandidate and the jet that has the smallest angular distance to the
τhadcandidate.
• x1fitand x2fit: the momentum fractions carried by the visible decay products from the two τ-lepton candidates (whether τlepor τhad) per event. It is based on the best-fit four-momentum of the neutrino(s)
according to the event reconstruction procedure outlined in Section7.1.
• mb j1j2: the invariant mass of the b-jet and the two jets originating from the W boson in the
t → W b → j1j2b decay, corresponding to the reconstructed mass of the parent top quark. This variable is only defined for events with at least four jets.
Among these variables, the most discriminating are mfitττ, pT,2, x1fitand x2fit. A comparison between data and
the predicted background for some of these variables in each of the SRs considered is shown in Figures4
and5. A good description of the data by the background model is observed in all cases. The level of discrimination between signal and background achieved by the BDTs is illustrated in Figure6.
[GeV] fit τ τ m 40 60 80 100 120 140 160 Data / Bkg 0.5 0.75 1 1.25 1.5 Events / 5 GeV 0 200 400 600 800 1000 1200 1400 ATLAS -1 = 13 TeV, 36.1 fb s ) search τ τ tqH( , 3j had τ lep τ Pre-Fit ℬ Data WbHc ( =1%) → t t had τ Fake ) had τ Top (real τ τ → Z Other Total Bkg unc. (a) [GeV] fit τ τ m 40 60 80 100 120 140 160 Data / Bkg 0.5 0.75 1 1.25 1.5 Events / 5 GeV 0 200 400 600 800 1000 1200 ATLAS -1 = 13 TeV, 36.1 fb s ) search τ τ tqH( 4j ≥ , had τ lep τ Pre-Fit ℬ Data WbHc ( =1%) → t t had τ Fake ) had τ Top (real τ τ → Z Other Total Bkg unc. (b) [GeV] T,2 p 30 40 50 60 70 80 90 100 Data / Bkg 0.5 0.75 1 1.25 1.5 Events / 5 GeV 0 500 1000 1500 2000 2500 3000 ATLAS -1 = 13 TeV, 36.1 fb s ) search τ τ tqH( , 3j had τ lep τ Pre-Fit ℬ Data WbHc ( =1%) → t t had τ Fake ) had τ Top (real τ τ → Z Other Total Bkg unc. (c) [GeV] T,2 p 30 40 50 60 70 80 90 100 Data / Bkg 0.5 0.75 1 1.25 1.5 Events / 5 GeV 0 500 1000 1500 2000 2500 ATLAS -1 = 13 TeV, 36.1 fb s ) search τ τ tqH( 4j ≥ , had τ lep τ Pre-Fit ℬ Data WbHc ( =1%) → t t had τ Fake ) had τ Top (real τ τ → Z Other Total Bkg unc. (d)
Figure 4: tqH(ττ) search: Comparison between the data and predicted background after preselection for the distributions of two of the most discriminating BDT input variables in the τlepτhadchannel before the fit to data
(“Pre-Fit”). The distributions are shown for mττfit in (a) the (τlepτhad, 3j) region and (b) the (τlepτhad, ≥4j) region, and
for pT,2in (c) the (τlepτhad, 3j) region and (d) the (τlepτhad, ≥4j) region. The contributions with real τhadcandidates
from t ¯t, t ¯tV , t ¯tH, and single-top-quark backgrounds are combined into a single background source referred to as “Top (real τhad)”, whereas the small contributions from Z → `+`
−
(` = e, µ) and diboson backgrounds are combined into “Other”. The expected t ¯t → W bHc signal (solid red) corresponding to B(t → Hc) = 1% is also shown, added to the background prediction. The first and the last bins in all figures contain the underflow and overflow respectively. The bottom panel displays the ratio of data to the SM background (“Bkg”) prediction. The hashed area represents the total uncertainty of the background, excluding the normalisation uncertainty of the fake τhadbackground, which is
[GeV] fit τ τ m 40 60 80 100 120 140 160 Data / Bkg 0.5 0.75 1 1.25 1.5 Events / 10 GeV 0 50 100 150 200 250 300 350 400 ATLAS -1 = 13 TeV, 36.1 fb s ) search τ τ tqH( , 3j had τ had τ Pre-Fit ℬ Data WbHc ( =1%) → t t had τ Fake ) had τ Top (real τ τ → Z Other Total Bkg unc. (a) [GeV] fit τ τ m 40 60 80 100 120 140 160 Data / Bkg 0.5 0.75 1 1.25 1.5 Events / 10 GeV 0 50 100 150 200 250 300 350 400 450 ATLAS -1 = 13 TeV, 36.1 fb s ) search τ τ tqH( 4j ≥ , had τ had τ Pre-Fit ℬ Data WbHc ( =1%) → t t had τ Fake ) had τ Top (real τ τ → Z Other Total Bkg unc. (b) fit 1 x 0.2 0.3 0.4 0.5 0.6 0.7 0.8 0.9 1 Data / Bkg 0.5 0.75 1 1.25 1.5 Events / 0.1 0 50 100 150 200 250 300 350 400 450 ATLASs = 13 TeV, 36.1 fb-1 ) search τ τ tqH( , 3j had τ had τ Pre-Fit ℬ Data WbHc ( =1%) → t t had τ Fake ) had τ Top (real τ τ → Z Other Total Bkg unc. (c) fit 1 x 0.2 0.3 0.4 0.5 0.6 0.7 0.8 0.9 1 Data / Bkg 0.5 0.75 1 1.25 1.5 Events / 0.1 0 50 100 150 200 250 300 350 400 ATLAS -1 = 13 TeV, 36.1 fb s ) search τ τ tqH( 4j ≥ , had τ had τ Pre-Fit ℬ Data WbHc ( =1%) → t t had τ Fake ) had τ Top (real τ τ → Z Other Total Bkg unc. (d)
Figure 5: tqH(ττ) search: Comparison between the data and predicted background after preselection for the distributions of two of the most discriminating BDT input variables in the τhadτhadchannel before the fit to data
(“Pre-Fit”). The distributions are shown for mfitττin (a) the (τhadτhad, 3j) region and (b) the (τhadτhad, ≥4j) region, and
for x1fitin (c) the (τhadτhad, 3j) region and (d) the (τhadτhad, ≥4j) region. The contributions with real τhadcandidates
from t ¯t, t ¯tV , t ¯tH, and single-top-quark backgrounds are combined into a single background source referred to as “Top (real τhad)”, whereas the small contributions from Z → `+`
−
(` = e, µ) and diboson backgrounds are combined into “Other”. The expected t ¯t → W bHc signal (solid red) corresponding to B(t → Hc) = 1% is also shown, added to the background prediction. The first and the last bins in the figures in (a) and (b) contain the underflow and overflow respectively. The bottom panel displays the ratio of data to the SM background (“Bkg”) prediction. The hashed area represents the total uncertainty of the background, excluding the normalisation uncertainty of the fake τhadbackground, which is determined via a likelihood fit to data.
BDT discriminant 1 − −0.8−0.6−0.4−0.2 0 0.2 0.4 0.6 0.8 1 Fraction of events / 0.2 0 0.1 0.2 0.3 0.4 0.5 0.6 0.7 , 3j had τ lep τ ττ) search tqH( =13 TeV s Simulation
ATLAS Total background
WbHc → t t WbHu → t t (a) BDT discriminant 1 − −0.8−0.6−0.4−0.2 0 0.2 0.4 0.6 0.8 1 Fraction of events / 0.2 0 0.1 0.2 0.3 0.4 0.5 0.6 0.7 4j ≥ , had τ lep τ ττ) search tqH( =13 TeV s Simulation
ATLAS Total background
WbHc → t t WbHu → t t (b) BDT discriminant 1 − −0.8−0.6−0.4−0.2 0 0.2 0.4 0.6 0.8 1 Fraction of events / 0.2 0 0.1 0.2 0.3 0.4 0.5 0.6 , 3j had τ had τ ττ) search tqH( =13 TeV s Simulation
ATLAS Total background
WbHc → t t WbHu → t t (c) BDT discriminant 1 − −0.8−0.6−0.4−0.2 0 0.2 0.4 0.6 0.8 1 Fraction of events / 0.2 0 0.1 0.2 0.3 0.4 0.5 4j ≥ , had τ had τ ττ) search tqH( =13 TeV s Simulation
ATLAS Total background
WbHc → t t WbHu → t t (d)
Figure 6: tqH(ττ) search: Comparison of the distributions of the BDT discriminant after preselection of the t ¯t → W bHc (red dashed) and t ¯t → W bHu (blue dotted) signals, and the total background (black solid) in the different search regions considered: (a) (τlepτhad, 3j), (b) (τlepτhad, ≥4j), (c) (τhadτhad, 3j), and (d) (τhadτhad, ≥4j).
8 Systematic uncertainties
Several sources of systematic uncertainty that can affect the normalisation of signal and background and/or the shape of their corresponding discriminant distributions are considered. Each source is considered to be uncorrelated with the other sources. Correlations of a given systematic uncertainty are maintained across processes and channels as appropriate. The following sections describe the systematic uncertainties considered.
8.1 Luminosity
The uncertainty in the integrated luminosity is 2.1%, affecting the overall normalisation of all processes estimated from the simulation. It is derived, following a methodology similar to that detailed in Ref. [106], and using the LUCID-2 detector for the baseline luminosity measurements [107], from a calibration of the luminosity scale using x–y beam-separation scans.
8.2 Reconstructed objects
Uncertainties associated with electrons, muons, and τhadcandidates arise from the trigger, reconstruction,
identification and isolation (in the case of electrons and muons) efficiencies, as well as the momentum scale and resolution. These are measured using Z → `+`−and J/ψ → `+`−events (` = e, µ) [41,43] in the case of electrons and muons, and using Z → τ+τ−events in the case of τhadcandidates [59].
Uncertainties associated with jets arise from the jet energy scale and resolution, and the efficiency to pass the JVT requirements. The largest contribution results from the jet energy scale, whose uncertainty dependence on jet pTand η, jet flavour, and pile-up treatment, is split into 21 uncorrelated components that
are treated independently [48].
Uncertainties associated with energy scales and resolutions of leptons and jets are propagated to ETmiss. Additional uncertainties originating from the modelling of the underlying event, in particular its impact on the pTscale and resolution of unclustered energy, are negligible.
Efficiencies to tag b-jets and c-jets in the simulation are corrected to match the efficiencies in data by pT-dependent factors, whereas the light-jet efficiency is scaled by pT- and η-dependent factors. The b-jet
efficiency is measured in a data sample enriched in t ¯t events [108], while the c-jet efficiency is measured using t ¯t events [109] or W +c-jet events [53]. The light-jet efficiency is measured in a multijet data sample enriched in light-flavour jets [110]. Since the t ¯t sample used to measure the c-jet tagging efficiency overlaps with the analysis sample, the tqH(b ¯b) search uses instead the W+c-jet scale factors. In the case of the tqH(b ¯b) (tqH(ττ)) search, the uncertainties in these scale factors include a total of 6 independent sources affecting b-jets, 1 (2) source(s) affecting c-jets, and 17 sources affecting light-jets. These systematic uncertainties are taken as uncorrelated between b-jets, c-jets, and light-jets. An additional uncertainty is included due to the extrapolation of these corrections to jets with pTbeyond the kinematic reach of the data
calibration samples used (pT > 300 GeV for b- and c-jets, and pT > 750 GeV for light-jets); it is taken to
be correlated among the three jet flavours. Since the fraction of signal and background in this kinematic regime is very small, these uncertainties have a negligible impact in the analyses. Finally, an uncertainty related to the application of c-jet scale factors to τ-jets is considered, which also has a negligible impact.
8.3 Background modelling
A number of sources of systematic uncertainty affecting the modelling of t ¯t+jets are considered. An uncertainty of 6% is assigned to the inclusive t ¯t production cross section [71], including contributions from varying the factorisation and renormalisation scales, as well as from the top-quark mass, the PDF and αS. The latter two represent the largest contribution to the overall theoretical uncertainty in the cross
section and were calculated using the PDF4LHC prescription [111] with the MSTW 2008 68% CL NNLO, CT10 NNLO [82,112] and NNPDF2.3 5F FFN [65] PDF sets. The uncertainty associated with the choice of NLO generator is derived by comparing the nominal prediction from Powheg-Box+Pythia 8 with a prediction from Sherpa 2.2.1. For the latter, the matrix-element calculation is performed for up to two partons at NLO and up to four partons at LO using Comix and OpenLoops, and merged with the Sherpa parton shower using the ME+PS@NLO prescription. The uncertainty due to the choice of parton shower and hadronisation (PS & Had) model is derived by comparing the predictions from Powheg-Box interfaced either to Pythia 8 or Herwig 7. The latter uses the MMHT2014 LO [113] PDF set in combination with the H7UE tune [114]. The uncertainty in the modelling of additional radiation is assessed with two alternative Powheg-Box+Pythia 8 samples: a sample with increased radiation (referred to as radHi) is obtained by decreasing the renormalisation and factorisation scales by a factor of two, doubling the hdampparameter,
and using the Var3c upward variation of the A14 parameter set; a sample with decreased radiation (referred to as radLow) is obtained by increasing the scales by a factor of two and using the Var3c downward variation of the A14 set [115].
In the case of the tqH(b ¯b) search, where the t ¯t+HF background plays a prominent role (see Fig.1), a more detailed treatment of its associated systematic uncertainties is used. In particular, since several analysis regions have a sufficiently large number of t ¯t+≥1b background events, its normalisation is determined in the fit to data. In the case of the t ¯t+≥1c normalisation, an uncertainty of 50% is assumed, as the fit to the data is unable to precisely determine it, and the analysis has very limited sensitivity to this uncertainty. Since the diagrams that contribute to t ¯t+light-jets, t ¯t+≥1c, and t ¯t+≥1b production are different, all above uncertainties in t ¯t+jets background modelling (NLO generator, PS & Had, and radHi/radLow), except the uncertainty of the inclusive cross section, are considered to be uncorrelated among these processes. Additional uncertainties of the t ¯t+≥1b background are considered associated with the NLO prediction from SherpaOL, which is used for reweighting the nominal Powheg-Box+Pythia 8 prediction. These include three different scale variations, a different shower-recoil model scheme, and two alternative PDF sets (MSTW 2008 NLO and NNPDF2.3 NLO). Additional uncertainties are assessed for the contributions to the t ¯t+≥1b background originating from multiple parton interactions. Finally, an additional uncertainty is assigned to the t ¯t+≥1b background by comparing the predictions from Powheg-Box+Pythia 8 and SherpaOL 4F (5F vs 4F). In the derivation of the above uncertainties, the overall normalisations of the t ¯t+≥1c and t ¯t+≥1b backgrounds at the particle level are fixed to the nominal prediction. In order to maintain the inclusive t ¯t cross section, the normalisation of the t ¯t+light-jets background at the particle level is adjusted accordingly.
Uncertainties affecting the normalisation of the V +jets background are estimated for the sum of W +jets and Z+jets, and separately for V+light-jets, V+≥1c+jets, and V+≥1b+jets subprocesses. The total normalisation uncertainty of V +jets processes is estimated by comparing the data and total background prediction in the different analysis regions considered, but requiring exactly zero b-tagged jets. Agreement between data and predicted background in these modified regions, which are dominated by V +light-jets, is found to be within approximately 30%. This bound is taken to be the normalisation uncertainty, correlated across all V +jets subprocesses. Since Sherpa 2.2 has been found to underestimate V+heavy-flavour production by