HAL Id: hal-02146154
https://hal.archives-ouvertes.fr/hal-02146154v2
Submitted on 15 Nov 2019
HAL is a multi-disciplinary open access archive for the deposit and dissemination of sci-entific research documents, whether they are pub-lished or not. The documents may come from teaching and research institutions in France or abroad, or from public or private research centers.
L’archive ouverte pluridisciplinaire HAL, est destinée au dépôt et à la diffusion de documents scientifiques de niveau recherche, publiés ou non, émanant des établissements d’enseignement et de recherche français ou étrangers, des laboratoires publics ou privés.
Climatic niche shift of an invasive shrub (gorse, Ulex
europaeus): a world scale comparison in native and
introduced regions
Mathias Christina, Fawziah Limbada, Anne Atlan
To cite this version:
Mathias Christina, Fawziah Limbada, Anne Atlan. Climatic niche shift of an invasive shrub (gorse, Ulex europaeus): a world scale comparison in native and introduced regions. Journal of Plant Ecology, Wiley, 2020, 13 (1), pp.42-50. �10.1093/jpe/rtz041�. �hal-02146154v2�
1
Climatic niche shift of an invasive shrub (Ulex europaeus): a global scale comparison in native and introduced regions
Journal of Plant Ecology, rtz041, https://doi.org/10.1093/jpe/rtz041
Published: 16 August 2019
Mathias Christina1,2, Fawziah Limbada3, Anne Atlan3,4
1 UMR ISPA, INRA, Bordeaux, France
2 present address:UPR AIDA, CIRAD, Saint-Denis, La Réunion, France 3 UMR ECOBIO, CNRS/Université Rennes 1, France
4 present address:UMR ESO, CNRS/Université Rennes 2, France
Corresponding author: mathias.christina@cirad.fr
ABSTRACT
Aims. Invasive species, which recently expanded, may help understand how climatic niche can shift at the time scale of the current global change. Here, we address the climatic niche shift of an invasive shrub (common gorse, Ulex europaeus) at the world and regional scales to assess how it could contribute to increasing invasibility.
Methods. Based on a 28,187 occurrences database, we used a combination of 9 species distribution models (SDM) to assess regional climatic niche from both the native range (Western Europe) and the introduced range in different parts of the world (North-West America, South America, North Europe, Australia and New Zealand).
Important Findings. Despite being restricted to annual mean temperature between 4 and 22 °C, as well as annual precipitation higher than 300 mm yr-1, the range of bioclimatic conditions suitable for gorse was very large. Based on a native vs introduced SDM comparison, we highlighted a niche expansion in North-West America, South America and to a lesser degree in Australia, while a niche displacement was assessed in North Europe. These niche changes induced an increase in potential occupied areas by gorse by 49, 111, 202 and 283% in Australia, North Europe, North-West America and South America, respectively. On the contrary, we found no evidence of niche change in New Zealand, which presents similar climatic condition to the native environment (Western Europe). This study highlights how niche expansion and displacement of gorse might increase invasibility at regional scale. The change in gorse niche toward new climatic conditions may result from adaptive plasticity or genetic evolution and may explain why it has such a high level of invasibility. Taking into account the possibility of a niche shift is crucial to improve invasive plants management and control.
2
Résumé :
Objectifs : Les espèces envahissantes peuvent aider à comprendre comment la niche climatique peut évoluer à une échelle temporelle de l'ordre de celle du changement global en cours. La prise en compte de cette possibilité d'un changement de niche est cruciale pour améliorer la gestion et le contrôle des plantes envahissantes. Ici, nous abordons le changement de niche climatique d'un arbuste envahissant (l'ajonc Ulex europaeus) à l'échelle mondiale et régionale. Méthodes : Sur la base d'une base de données de 28 187 occurrences, nous avons utilisé une combinaison de 9 modèles de distribution d'espèces (SDM) pour évaluer la niche climatique régionale de la zone native native (Europe occidentale) et des zones introduites (Amérique du Nord-Ouest, Amérique du Sud, Europe du Nord, Australie et Nouvelle-Zélande).
Principaux résultats : La gamme des conditions bioclimatiques adaptées aux ajoncs est très large, bien qu'elle soit limitée par une température annuelle moyenne comprise entre 4 et 22 °C, et des précipitations annuelles supérieures à 300 mm an. Nous avons mis en évidence plusieurs changemenbts de niche : une expansion de niche en Amérique du Nord-Ouest, en Amérique du Sud et dans une moindre mesure en Australie, un déplacement de niche en Europe du Nord. Ces changements de niche ont entraîné une augmentation de 49, 111, 202 et 283 % des zones potentiellement colonisables par l'ajonc en Australie, Europe du Nord, Amérique du Nord et Amérique du Sud, respectivement. Nous n'avons trouvé aucun indice de changement de niche en Nouvelle-Zélande, pays qui présente des conditions climatiques similaires à celles de la zone native. Le changement de niche des ajoncs vers de nouvelles conditions climatiques peut résulter de la plasticité adaptative ou de l'évolution génétique de l'espèce, et contribue à expliquer pourquoi elle est si invasive.
INTRODUCTION
Predicting invasive species distribution is challenging, since they were introduced only recently in a new geographic area, where climatic and environmental conditions may be out of the range of those present in the area of origin (Barbet-Massin et al., 2018). On the other hand, they provide good examples of recent species expansion that may help understand whether and how climatic niche can shift at the time scale of current global change (Barbet-Massin et al., 2018). In addition, assessing the ecological niche of invasive species is a way of improving the efficiency of control programs by focusing on key areas whose climatic conditions are suitable under current or future climate (Srivastava et al., 2019). Increasing this efficiency is important since biological invasions are considered as one of the most serious global environmental threats (e.g. Sala et al. 2000; Thuiller et al. 2007). Plant invaders can alter the native species biodiversity and abundance modifying ecosystem processes and negatively impact human health or economic activities (Coutts-Smith and Downey 2006; Villa et al. 2006; Vitousek 1996;). Many countries have planned huge and costly programs to try to eliminate or control
3
invasive species once they are established (Hill and Sandrey 1986) and the efficiency of these programs is a major issue (e.g. Andersen et al., 2004). Anticipation appears the most efficient management strategy, and assessing the areas that are climatically suitable to a given invasive species is thus a key step (Leung et al. 2002).
At large geographical scales, climate is considered to act as the main initial coarse filter of invasive species distribution (Vicente et al. 2010 ; Cabra-Rivas et al. 2016). Niche conservatism, the tendency of species to maintain ancestral ecological requirements in native and invasive ranges (Wiens and Graham 2005), is often assumed to assess the risk of invasion (Pearman et al. 2008, Liu et al. 2017). However this assumption of climatic niche is still in debate nowadays for climatic niche. Evidence of climatic niche shifts have been raised for various plant invaders (Gallagher et al. 2010; Broennimann et al. 2007; Cornuault et al. 2015; Hernandez-Lambraño et al. 2016). A recent review, however, argues that niche shift can only be assessed when analog climates are compared between regions - otherwise they correspond to filling of preadapted niche - and concluded that ~85% of terrestrial plant invaders did not shift their climatic niche (Petitpierre et al. 2012). Webber et al (2012) disagree with this argument. They consider that a species can expand its niche in two ways, either by infilling novel combinations of variables within the range present in the area of origin, or by expanding into environmental variables beyond those previously experienced. They therefore suggest that niche conservation for invasive species would be the exception rather than the rule. In any case, not taking into account climatic niche shifts of invasive population could lead to underestimate current and future biological invasions (Beaumont et al. 2009).
Ecological niche models (ENMs) (Guisan and Thuiller, 2005), or species distribution models (SMDs) are traditionally calibrated using native distributions and then projected onto other continents to highlight areas susceptible to invasions (Thuiller et al. 2005; Shah et al. 2012), assuming niche conservatism. Recent studies also tend to calibrate models with distribution of invaded regions, to take into account potential niche shifts and avoid underestimation of potential spread of the species. Furthermore, detecting significant deviations from niche conservatism may highlight invasive species that are characterized by ecological (Klironomos et al. 2002) or evolutionary changes (Xu et al. 2010; Fenesi and Botta-Dukat, 2012) during invasions, helping us understand when such changes are likely to occur, which is crucial in an area of rapid climate change.
In this study, we focused on the climatic niche of Ulex europaeus (common gorse), a shrub originating from Western Europe that has been introduced in many parts of the world during the 19th century. It has now been recorded in more than 50 countries and islands, and is
considered as a major invasive plants, one of the 30 most noxious weed species in the world (UICN). The potential niche of gorse is considered to be unfilled and the species is still in expansion (Hill et al. 2008). Its geographic and climatic distribution is very wide, since it can be found at latitudes ranging from 0 to 60°N, 0 to 54°S and at altitudes ranging from sea level to 3,550 m asl (Hornoy 2012). This world-scale distribution contrasts with the relatively
4
restricted distribution in the area of origin (from 35 to 50 °N and from 0 to 300m asl), and suggests potentially niche expansion with respect to climatic variables. Such niche expansion of gorse was recently demonstrated by Hernandez-Lambraño et al. (2016) in mountain regions of South America. Here we modeled the climatic niche of gorse at a global scale, in its whole area of present distribution. This allows to compare climatic niches and its potential shift in different invaded regions.
The objectives of this study were i) To assess climatic niche of Ulex europaeus at the world and regional scale based on a SDM approach, ii) to assess whether climatic niche shift occurred between native and introduced populations depending on the region and iii) to provide information for the evaluation of the degree of invasibility of introduced areas.
METHODS
Gorse presence and environmental data
Common gorse (Ulex Europeaus) is a highly studied invasive species, furthermore, its bright yellow flowering makes it very visible in the landscape, and it easy to identify. As a consequence, numerous data of gorse occurrence (geo-localized gorse presence) are available from various sources (made available in Atlan and Limbada, 2019). Three main sources were used: online database, bibliography, and personal observations or communications (detailed in supplementary information, Table S1). In short, main online sources were from scientific network and information systems in natural sciences, biodiversity and ecology (CABI, GBIF, iNaturalist, CalFlora, Atlas of Living Australia and herbariums). Bibliographic sources include scientific papers, PhD and master thesis flora, websites of local invasive species management, online reports and gray literature, amateur naturalist websites. Personal observations by our group include systematic survey in Reunion Island and Brittany, and visual observations of geolocated photos on websites such as Panoramio and Flickr. Personal communications include unpublished occurrences transmitted by professional workers on botany, ecology and nature conservation. In total, more than 100,000 records were collected. After eliminating double records, validity of the points was assessed through 3 criteria, spatial coherence (e.g. suppression of geo-localization in the sea), date of registration (only points recorded after 1950 were retained, to be coherent with current climatic data), formal identification of the species (in case of doubt, we verified with georeferenced photos). Points corresponding to samples stocked in Herbarium or Museums were also identified and discarded. We retained 28,180 points geo-referenced around the world (see Table S2 for more details). This constitutes a quasi-exhaustive distribution of gorse at the present time. The dataset will be available in the database of the CNRS.
To homogenize sample effort, we converted the geo-referenced points into a 5 arc min (10 km) grid of presence around the world. We obtained 2365 grids with gorse presence. Data on current climatic conditions (average climate for 1950–2000; Hijmans et al. 2005), represented by 19 bioclimatic variables, were obtained from the WorldClim dataset (Hijmans
5
et al. 2005, Table S3). We used the same spatial resolution of current climate data for gorse presence: 5 arc min. Previous results have shown that such a broad resolution can fairly represent the climatic niche of gorse and that a finer grid did not improve the resolution of the model (Hernandez-Lambraño et al. 2016). To limit the set of variables used as SDM predictors and improve the accuracy of the model, we performed a Pearson correlation analysis and eliminated the most correlated variables, above a threshold of R>0.7 (Barbet-Massin and Jetz, 2014). According to previous knowledge on gorse ecology, we retained 14 different combinations of 8 to 11 uncorrelated variables (Table S3).
World niche modeling and selection of the combination of climatic variables
To model species distributions at the global scale for a given climatic combination, we used nine different modeling techniques implemented within the Biomod2 (v3.3-7) package (Thuiller et al. 2009) in R 3.4 (R Development Core Team 2017): three regression methods (GLM, MARS and GAM), a recursive partitioning method (CTA), four machine-learning methods (ANN, GBM, RF and MAXENT) and two rectilinear envelope methods (SRE, BIOCLIM). To evaluate the predictive performance of the SDMs, we used a random subset of 70% of the data to calibrate the model, and then used the remaining 30% for evaluation, using the area under the relative operating characteristic curve (AUC, Fielding and Bell, 1997). The data splitting approach was replicated five times and was the basis for calculating the mean AUC of the cross-validation. The final calibration of each model used for making projections used 100% of the available data. A current consensus distribution was obtained by calculating the weighted mean distributions across SDMs: the nine models were ranked according to their predictive performance, and a decay proportional to the evaluation score gave the relative importance of the weight.
We ran the model for the 14 different combinations of bioclimatic variables retained. The evaluation of the 14 distributions was based on AUC, sensitivity, specificity and true skill statistics (TSS; Allouche et al. 2006) described in Table S4. The four combinations with the best results were selected (1, 4, 7 and 9) and visually compared. After eliminating models predicting gorse presence in areas where gorse was introduced but not established (e.g. North East America), we kept the combined SDM obtained with the climatic combination n°9. It combines 9 climatic variables: annual mean temperature (Bio1), mean diurnal range (Bio2), maximum temperature of the warmest month (Bio5), minimum temperature of the coldest month (Bio6), mean temperature of wettest quarter (Bio8), mean temperature of driest quarter (Bio9), annual precipitation (Bio12), precipitation of the wettest month (Bio13) and precipitation of the driest month (Bio14). This combination was used for all further modeling. Regional niche modeling and projections
Based on the map of U. Europeaus occurrences, we selected 6 regional areas: the native area (Western Europe) and five introduced areas (North Europe, North-West America, South America, Australia and New Zealand, Fig. 1) with 672, 237, 60, 74, 1019 and 215 cell presence respectively. The case of North Europe is unique: it is not part of the natural range of distribution, but gorse was introduced there before the 19th century, and it is the only introduced
6
area where gorse is not considered as invasive (Atlan et al. 2015a). First a principal component analysis (PCA) was performed on these occurrences to compare climatic data in native area and invasive areas. Kernel smooth densities were plotted for visual purpose (Fig. S1). Analyses were performed with R packages FactoMineR (v1.35), factoextra (v1.0.4) and ks (v1.11.4).
Regional SMDs were built for each area (the native and the introduced areas) following the same approach as described previously at the global scale. A first model was built using only the occurrences from Western Europe and then used to project the probability of gorse presence in introduced area (i.e. as if the species would behave like in the native area). We will refer to this model as "native model". The projections of the native model were compared with models built with the occurrence of each introduced area described previously. We will refer to these models as "introduced models". In order to transform the probabilistic consensus distribution to a presence/absence distribution, we preserved the suitability values for pixels above the sensitivity–specificity sum maximization threshold, and set the suitability for pixels under the threshold to zero (Liu et al. 2005; Jimenez-Valverde and Lobo, 2007, R package SDMtools v1.1-221.1). Using the simulated presence given by the models, proportion of presence depending on 4 climatic variables were calculated (Fig 3): annual mean temperature (TMEAN) maximum temperature (TMAX) of the warmest month, minimum temperature (TMIN) of
the coldest month and annual precipitation (PPT). A PCA was performed on simulated presence to compare native and introduced climatic niche in the different introduced areas (Fig 4) following the same method as described for observed presences.
Niche change analyses
We used a threshold-independent niche change index to assess the difference in niche between native and introduced populations. We assess a niche overlap based on Schoener’s D metric (Schoener 1968) which expresses an overall fit between niches over the full environmental space and determines whether we can infer the characteristics of the introduced niche from the native niche. Based on this metric we define a global niche change index (INC) which ranges
from a value of 0, where two distributions are identical, to 1, where two distributions have no overlap: 𝐼𝑁𝐶 = 1 − 𝐷 =1 2∑ | 𝑃𝐼𝑁𝑇,𝑖 ∑ 𝑃𝑗 𝐼𝑁𝑇,𝑗− 𝑃𝑁𝐴𝑇,𝑖 ∑ 𝑃𝑗 𝑁𝐴𝑇,𝑗| 𝑖 − 1 (1)
where PINT,i is the probability of presence for Ulex in the cell i in the introduced model and
PNAT,i the probability in the native model. Moreover, we quantify the potential variation in
occupied area by the invasive species due to niche change: 𝐼𝑁𝐶_𝑎𝑟𝑒𝑎 =
∑ 𝑃𝑖 𝐼𝑁𝑇,𝑖 𝐶𝑎𝑟𝑒𝑎,𝑖− ∑ 𝑃𝑖 𝑁𝐴𝑇,𝑖 𝐶𝑎𝑟𝑒𝑎,𝑖 ∑ 𝑃𝑖 𝑁𝐴𝑇,𝑖 𝐶𝑎𝑟𝑒𝑎,𝑖
(2) where Carea,i is the area of the cell i.
Multivariate environmental similarity surface (MESS; Zurell et al., 2012) analyses were conducted to examine where analog (similar) versus non-analog (novel) climate exists in geographic space between each introduced region and the native region (Western Europe).
7
RESULTS
Global scale U. europaeus distribution
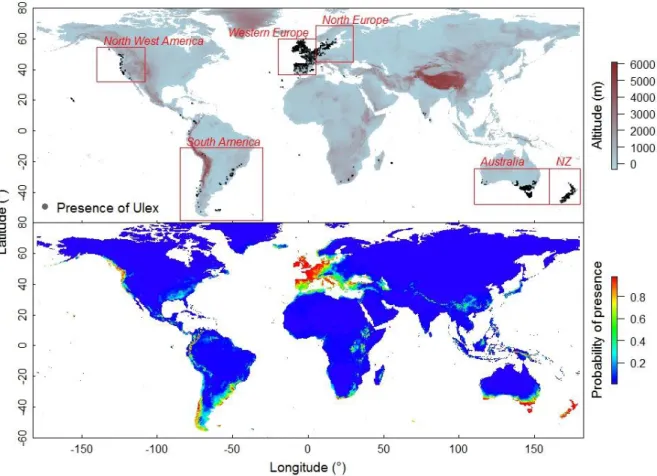
The global scale U. europaeus (common gorse) distribution model built in this study was accurate (AUC 0.992 ±0.002, TSS 0.941 ±0.01, sensitivity 0.976 ±0.009 and specificity 0.963 ± 0.008). The presence probability threshold calculated using the sensitivity-specificity sum maximization threshold in the model was P = 0.48. Only 2 % of gorse real occurrences were present in areas represented by the model below that threshold. The model predicted suitable climatic conditions in regions where gorse was effectively observed, such as Western and North Europe, North West, central and South America, South Africa, South Australia and New Zealand (Fig. 1). The model also predicted suitable climatic conditions in areas where gorse was not observed, such as East Africa or Papua New Guinea. The gorse potential distribution is globally wide and mostly along oceanic costs. At low longitude, suitable conditions were found in high altitude while in high longitude suitable conditions were found in low altitude near the costs.
Global scale climatic niche
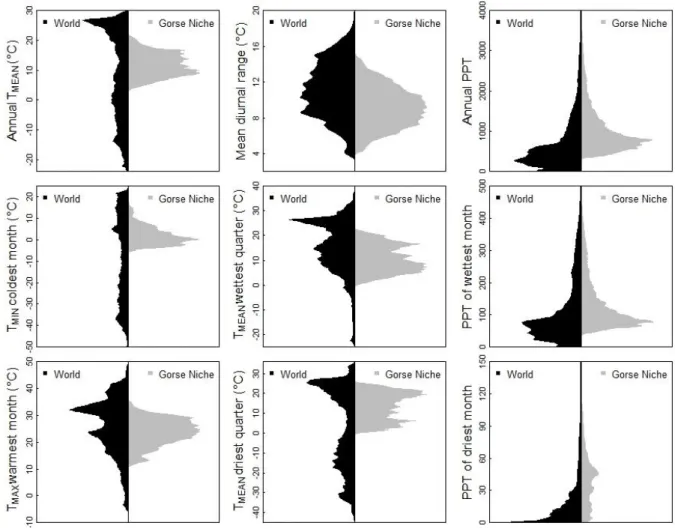
Suitable climatic conditions for U. europaeus presence were wide (Fig. 2). Suitable mean annual temperatures ranged from 4 to 22°C, but the presence of gorse was limited by low temperature (below -6°C for the coldest month) and high temperature (above 32°C for the warmest month). In terms of precipitation, U. europaeus was not observed when annual precipitation was below 300 mm per year. Nevertheless, it was found in environments with no precipitation over the driest month, indicating that the species can support a short period of drought.
Estimation of climatic niche shift between native and introduced areas
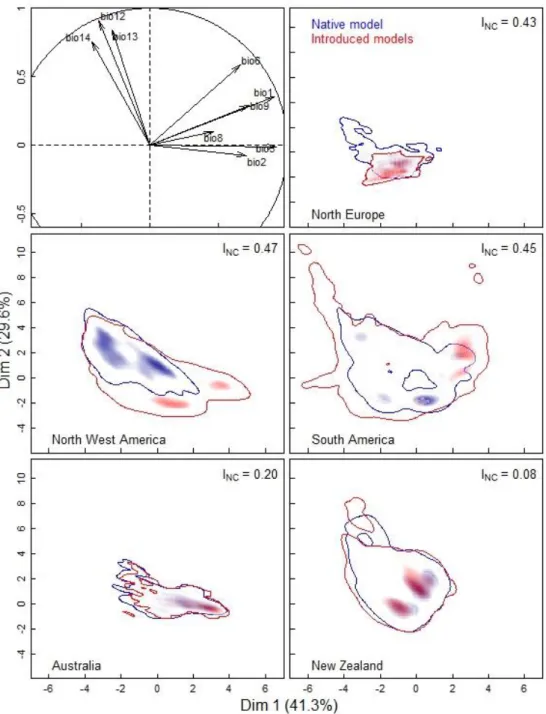
The geographic projections of the probabilities distribution of gorse presence, as predicted by the native model (calibrated from gorse occurrence in Western Europe) and by the introduced models (calibrated from gorse occurrences in each introduced region) will be referred hereafter as "native niche" and "introduced niche" (Fig. 3A). To compare these distributions, a kernel-smoothed PCA was performed in each introduced region, after applying the presence probability threshold (Fig. 4). The highest differences between native and introduced niches were found in North Europe, North-West America and South America. On the contrary, native and introduced niche were similar in Australia and New Zealand. In agreement with the previous results, the niche change index (INC) for North Europe, North-West America and South
America were high, 0.43, 0.47 and 0.45, respectively, while the INC for Australia and New
Zealand were low, 0.20 and 0.08, respectively (Fig. 4).
Comparison between climatic niche in native and introduced areas.
In regions with high niche change index, the introduced niches were larger (Fig. 3A) and included a larger range of climatic values (Fig. 3B) than in the native niche. In North Europe, gorse population were found in colder environments (lower temperature of the coldest month)
8
than those predicted by the native niche. In North-West America and South America, gorse populations were found in both colder and warmer environments, particularly in regard of the warmest and coldest month. In North-West America, gorse populations were found in much drier environments than those predicted by the native niche. In regions with low change index, native and introduced niche covered similar areas, but the level of probability was higher for the introduced niche (Fig. 3A). In New Zealand, gorse populations were found in the similar range of climatic values than those predicted by the native niche. In Australia, gorse populations were found in warmer environments than those predicted by the native niche, particularly in regard of the warmest month (Fig. 3B).
Accordingly, to niche change, the potential occupied area by gorse was larger when estimated by the introduced model than when estimated by the native model for all regions but New Zealand (INC_area, Fig. 5). In regions with the highest niche expansions (South America,
INC_area = 283% and North West America, INC_area = 202%), this expansion mainly occurred in
climates dissimilar to the native niche (Fig. 5, MESS <0). In regions with moderate niche expansion (North Europe, INC_area = 111% and Australia, INC_area = 49%), this expansion
occurred in both similar (MESS>0) and dissimilar climatic conditions (MESS<0). The geographical details of the MESS analyses between the climate of the native and introduced areas are presented in Fig. S2.
DISCUSSION
Model simulations and limitations
The species distribution model built for world gorse distribution using 9 bioclimatic variables was accurate and predicted 98% of real occurrences. The potential bioclimatic niche estimated by the model was larger than the present gorse distribution, and in agreement with the assumption than the species is still expanding (Hill et al. 2008). We have chosen not to build a regional model in South Africa, due to the limited number of presence data, which is incompatible with the calibration of a species distribution model. For the same reason, a regional model was not built in Central America. In addition, we did not include data on the presence of the northern part of the South American continent in the regional model "South America" because we considered that the area would be too large to have a common history between populations.
Bioclimatic conditions suitable for gorse establishment
The range of bioclimatic conditions suitable for gorse was very large. The presence of the species is restricted by annual mean temperature below 4°C and above 22°C, which corresponds to the sea level in temperate or cold regions, where it is found until 54° South and 60° North. Tropical and equatorial regions may also correspond to temperature requirements of the species, but only at high altitudes (the lower the latitude, the higher the altitude when suitable conditions can be met). The link between altitude and latitude was already observed on real distributions (Hornoy, 2011). The annual extremums. i.e. temperatures of the warmer and coldest months
9
are also limiting. Climates suitable for gorse are those with relatively low seasonal fluctuations of temperature, which correspond to oceanic climates. As a consequence, the species is found almost only in coastal regions, and in the North Hemisphere, on the Western sides of the continents.
Annual precipitation is more limiting, since the climatic niche excludes areas where annual precipitations are lower than 300 mm per year. However, the precipitation of the driest month is not limiting, gorse presence being possible in all the range of this variable. Delerue (2013) have shown that the seedling stage is the most sensitive to drought, which may explain why short lasting droughts are not limiting. Indeed, the fruiting season of gorse is very long (Bowman et al. 2008), and its seed dormancy duration highly variable (Hill et al. 2001; Udo et al. 2017), so that if the period of drought is limited in time, there is always a possibility that some seedlings emerge out of the driest period.
Solar radiation was not included in the model, but the wide range of altitude and latitude where the species can be found suggests low sensitivity to this parameter, which is confirmed by the model of Hernadez-Lambraño et al. (2016) for gorse in South America.
Most regions with climatic conditions corresponding to the gorse niche already contain some gorse populations. The exceptions are the central mountain chain of New Guinea, and the mountainous regions of Kenya and Ethiopia. It is difficult to know if gorse is absent from these places because it was never introduced, or because other dimensions of the niche are not met. For example, gorse cannot grow in acid soil or under forest cover (Delerue, 2013 ; Atlan et al. 2015b). On the other hand, these areas are difficult to access, and no colonial agriculture was developed there. Since agriculture was the main reason for introducing gorse (Atlan et al. 2015a), it is possible that gorse was never introduced there.
In regions where gorse is already present, it does not cover the whole range of its potential climatic niche, except in New Zealand where all favorable areas are already occupied. Gorse further expansion may be limited by other dimensions of its ecological niche, but field studies have shown that this is far from being always the case, and that the species can still expand (Hill et al. 2008).
Niche shift between native and invaded regions
The climatic niche estimated by the model calibrated on native or invaded regions are different. This may come from adaptive evolution in the invaded area, but also from preadaptation to conditions that are not present in the native area (Petitpierre et al. 2012). In this study, the Kerned-soothed analysis shows that density of probabilities of native and invasive niche are different even within the same range of parameter values. This suggests that the differences observed result at least partly from real niche shift. The niche shifts observed depended on the invasive regions considered, and almost all the situations described in the typology of Guisan et al. (2014) are met. This typology considers changes in the niche envelop (expansion or contraction), changes in one direction (niche displacement), and changes in the niche centroid (i.e. change in probability density). As can be deduced from Fig 4, we observe a displacement in North Europe, no significant change in New Zealand, niche expansion in South America, a combination of niche expansion, unidirectional displacement and centroid displacement in
10
North-West America, the same combination, at a lesser degree, in Australia, and a combination of niche expansion and multidirectional displacement in South America. In particular, in South America and North West America, niche expansion occurs in non-analogous environments compared to the climatic conditions of the area of origin.
The niche expansion in South America was already shown in the study of Hernandez-Lambraño et al. (2016) using the model MAXENT, and is confirmed here by the combination of 9 different models. The area of presence predicted by their model is larger, probably because they consider North Europe as part of the native area, while we considered it as an introduced area. Indeed, in North Europe gorse presence results from human introduction around 1800 (Atlan et al. 2015a ; Udo, 2016).
Niche expansion of gorse was observed in all invaded regions but New Zealand, whose climate lies within the range of the native niche. In the other regions, the expansion of the gorse niche toward new climatic conditions may result from adaptive plasticity or genetic evolution. The species has a high potential in both. Adaptive plasticity of reproductive and vegetative traits in response to shading and resource availability was demonstrated by experimental studies and field observations (Delerue et al. 2013; Atlan et al. 2015b). Genetic evolution of life history traits was demonstrated by common garden experiments (Hornoy et al. 2011). Both are facilitated by the hexaploid karyotype of the species, and by its high genetic polymorphism in both native invasive populations (Hornoy et al. 2013).
This evolution may result from directional selection in response to different environmental conditions. They can also result from the release of natural enemies (EICA Hypothesis, Blossey and Notzold, 1995; Joshi and Vrieling, 2005). Indeed, the specific weevil Exapion ulicis, that can eat up to 80% of the seeds in the native region, was not introduced in the invaded regions as the same time as the plant (it was further introduced in most regions for biological control). The release from this weevil may have relaxed the genetic constraints resulting by the complex strategies of seed predation avoidance (Atlan et al. 2010). Following the Relaxation of Genetic Constraints hypothesis, RGC, (Hornoy et al. 2011), a larger level of trait combination may have contributed to niche expansion.
Consequences for gorse management and biodiversity conservation
Shift, displacement and expansion in gorse climatic niche appeared in most regions where the species was introduced. Together with its other characteristics (among which high seed production, fast growing and long survival), this may explain why it has such a high level of invasibility. The present study shows that the species has the potential to expand in many new areas, as suggested by field observation (Hill et al. 2008; Udo, 2016). In agricultural areas, the control of gorse is possible, providing adapted technic and financial efforts. In natural areas, its spread can be slowed by a combination of methods (physical, chemical, and biological), but its control is impossible in many circumstances. Indeed, in tropical regions, the species has a tendency to grow in altitude, i.e. in areas where the low level of enthropization often led to high levels of biodiversity and site protection, which forbid the use of unspecific methods (Hill et al. 2008). Early detection followed by eradication would be a means, but it is difficult to apply in scarped landscapes. In areas of the potential niche still devoid of gorse, a particular attention
11
should be paid to avoid new introduction. In areas where gorse is already present, beyond attempts to control, the concept of novel ecosystem (Hobbs et al. 2006, 2009) and the study of potential ecosystem services gorse can produce, may be a useful tool to imagine new directions of management.
The prediction of areas potentially colonized by gorse is necessary to improve the efficiency of gorse management, and to decrease its cost. These areas would have been largely underestimated without taking into account the possibility of a niche shift. The case of gorse may be an exception, as suggested by Petitpierre et al. (2012), but it may also be more common than previously thought, especially considering polyploid plant species. In regard of biodiversity conservation, this is a bad and good news. On the one hand, it suggests that geographic expansion of exotic species will continue beyond the climatic range of their native areas, which may threaten indigenous species. On the other hand, it shows that the capacity of some species to adapt to new climatic conditions may be higher than estimated from experimental studies, which suggest that they also have great potentialities to adapt to global climate change.
FUNDINGS
This study was financially supported by CNRS (Centre Nationale de la Recherche Scientifique), the MARIS ANR project (Agence Nationale de la Recherche, grant ANR-14-CE03-0007-01) and INRA institute (Institut National de la Recherche Agronomique).
ACKNOWLEDGEMENTS
The authors thank Morgane Barbet-Massin for her help in the modeling conception, and Michèle Tarayre and Maya Gonzalez for their helpful comments.
REFERENCES
Allouche O, Tsoar A, Kadmon R (2006) Assessing the accuracy of species distribution models: Prevalence, kappa and the true skill statistic (TSS). Journal of Applied Ecology 43:1223–1232. Andersen MC, Adams H, Hope B, Powell M (2004) Risk Assessment for Invasive Species. Risk Analysis
24:787–793.
Atlan A, Barat M, Legionnet AS, Parize L, Tarayre M (2010) Genetic variation in flowering phenology and avoidance of seed predation in native populations of Ulex europaeus. Journal of Evolutionary Biology 23:362–371.
Atlan A, Hornoy B, Delerue F, Gonzalez M, Pierre JS, Tarayre M (2015a) Phenotypic plasticity in reproductive traits of the perennial shrub ulex europaeus in response to shading: A multi-year monitoring of cultivated clones. PLoS ONE 10:e0137500.
Atlan A, Udo N, Hornoy B, Darrot C (2015b) Evolution of the uses of gorse in native and invaded regions: what are the impacts on its dynamics and management? Revue d’écologie - la terre et la vie 70:191–206.
Atlan A, Limbada F (2019) World distribution of gorse Ulex europaeus in introduced areas. GeoNetwork.
https://www.osuris.fr/geonetwork/srv/fre/catalog.search#/search
Barbet-Massin M, Jetz W (2014) A 40-year, continent-wide, multispecies assessment of relevant climate predictors for species distribution modelling. Diversity and Distributions 20:1285–1295.
12
Barbet-Massin M, Rome Q, Villemant C, Courchamp F (2018) Can species distribution models really predict the expansion of invasive species? PLoS ONE 13:1-14.
Beaumont LJ, Gallagher RV, Thuiller W, Downey PO, Leishman MR, Hughes L (2009) Different climatic envelopes among invasive populations may lead to underestimations of current and future biological invasions. Diversity and Distributions 15:409–420.
Blossey B, Nötzold R (1995) Evolution of increased competitive ability in invasive nonindigenous plants: a hypothesis. Journal of Ecology 83:887–889.
Bowman G, Tarayre M, Atlan A (2008) How is the invasive gorse Ulex europaeus pollinated during winter? A lesson from its native range. Plant Ecology 197:197–206.
Broennimann O, Treier UA, Müller-Schärer H, Thuiller W, Peterson AT, Guisan A (2007) Evidence of climatic niche shift during biological invasion. Ecology Letters 10:701–709.
Cabra-Rivas I, Saldaña A, Castro-Díez P, Gallien L (2016) A multi-scale approach to identify invasion drivers and invaders’ future dynamics. Biological Invasions 18:411–426.
Cornuault J, Khimoun A, Cuneo P, Besnard G (2015) Spatial segregation and realized niche shift during the parallel invasion of two olive subspecies in south-eastern Australia. Journal of Biogeography 42:1930–1941.
Coutts-Smith AJ, Downey PO (2006) The impact of weeds on threatened biodiversity in New South Wales. Technical Series No 11, CRC for Australian Weed Management.
Delerue F (2013) Dynamique de population d’une légumineuse du sous-bois de la forêt landaise (Ulex europaeus) dans le cadre de la sylviculture du pin maritime : proposition d’un modèle conceptuel. PhD thesis Université Sciences et Technologies - Bordeaux I; Université Sciences et Technologies - Bordeaux I.
Delerue F, Gonzalez M, Atlan A, Pellerin S, Augusto L (2013) Plasticity of reproductive allocation of a woody species (Ulex europaeus) in response to variation in resource availability. Annals of Forest Science 70:219–228.
Fenesi A, Botta-Dukát Z (2012) Phenotypic divergences induced by different residence time in invasive common ragweeds. Journal of Plant Ecology 5:174–181.
Fielding AH, Bell JF (1997) A review of methods for the assessment of prediction errors in conservation presence/absence models. Environmental Conservation 24:38–49.
Gallagher RV, Beaumont LJ, Hughes L, Leishman MR (2010) Evidence for climatic niche and biome shifts between native and novel ranges in plant species introduced to Australia. Journal of Ecology 98:790–799.
Guisan A, Thuiller W (2005) Predicting species distribution: offering more than simple habitat models. Ecology Letters 8:993–1009.
Guisan A, Petitpierre B, Broennimann O, Daehler C, Kueffer C (2014) Unifying niche shift studies: Insights from biological invasions. Trends in Ecology and Evolution 29:260–269.
Hernández-Lambraño RE, González-Moreno P, Sánchez-Agudo JÁ (2016) Towards the top: niche expansion of Taraxacum officinale and Ulex europaeus in mountain regions of South America. Austral Ecology 42:577–589.
Hijmans RJ, Cameron SE, Parra JL, Jones PG, Jarvis A (2005) Very high resolution interpolated climate surfaces for global land areas. International Journal of Climatology 25:1965–1978.
Hill R, Sandrey R (1986) The costs and benefits of gorse.InProc. 39th nz weed and pest contr. conf. 70– 73.
Hill R, Gourlay A, Barker R (2001) Survival of Ulex europaeus seeds in the soil at three sites in New Zealand. New Zealand Journal of Botany 39:235–244.
Hill R, Ireson J, Sheppard A et al. (2008) A global view of the future for biological control of gorse, Ulex europaeus L.InProceedings of the xii international symposium on biological control of weeds. CAB International Wallingford UK, 680–686.
Hobbs RJ, Arico S, Aronson J et al. (2006) Novel ecosystems: Theoretical and management aspects of the new ecological world order. Global Ecology and Biogeography 15:1–7.
13
Hobbs RJ, Higgs E, Harris JA (2009) Novel ecosystems: implications for conservation and restoration. Trends in Ecology and Evolution 24:599–605.
Hornoy B (2012) Processus évolutifs contribuant au succès envahissant de l’ajonc d’Europe, Ulex europaeus. PhD thesis Université Rennes 1.
Hornoy B, Atlan A, Roussel V, Buckley YM, Tarayre M (2013) Two colonisation stages generate two different patterns of genetic diversity within native and invasive ranges of Ulex europaeus. Heredity 111:355–363.
Hornoy B, Tarayre M, Hervé M, Gigord L, Atlan A (2011) Invasive plants and enemy release: Evolution of trait means and trait correlations in ulex europaeus. (M Moora, Ed.). PLoS ONE 6:e26275. Jiménez-Valverde A, Lobo JM (2007) Threshold criteria for conversion of probability of species presence
to either–or presence–absence. Acta Oecologica 31:361–369.
Joshi J, Vrieling K (2005) The enemy release and EICA hypothesis revisited: incorporating the fundamental difference between specialist and generalist herbivores. Ecology Letters 8:704– 714.
Klironomos JN, Clark JA, May RM (2002) Another form of bias in conservation research. 298:749–750. Leung B, Lodge DM, Finnoff D, Shogren JF, Lewis MA, Lamberti G (2002) An ounce of prevention or a pound of cure: Bioeconomic risk analysis of invasive species. Proceedings of the Royal Society of London B: Biological Sciences 269:2407–2413.
Liu C, Berry PM, Dawson TP, Pearson RG (2005) Selecting thresholds of occurrence in the prediction of species distributions. Ecography 28:385–393.
Liu X, Petitpierre B, Broennimann O, Li X, Guisan A, Li Y (2017) Realized climatic niches are conserved along maximum temperatures among herpetofaunal invaders. Journal of Biogeography 44:111– 121.
Pearman PB, Guisan A, Broennimann O, Randin CF (2008) Niche dynamics in space and time. Trends in Ecology and Evolution 23:149–158.
Petitpierre B, Kueffer C, Broennimann O, Randin C, Daehler C, Guisan A (2012) Climatic Niche Shifts Are Rare Among Terrestrial Plant Invaders. Science 335:1344–1348.
R Development Core Team (2017) R: A language and environment for statistical computing. Sala OE (2000) Global Biodiversity Scenarios for the Year 2100. Science 287:1770–1774.
Schoener TW (1968) The Anolis lizards of Bimini: resource partitioning in a complex fauna. Ecology 49:704–726.
Srivastava V, Lafond V, Griess VC (2019) Species distribution models (SDM): applications, benefits and challenges in invasive species management. CAB Reviews: Perspectives in Agriculture, Veterinary Science, Nutrition and Natural Resources 14:1-13.
Shah MA, Reshi ZA, Lavoie C (2012) Predicting plant invasiveness from native range size: Clues from the Kashmir Himalaya. Journal of Plant Ecology 5:167–173.
Thuiller W (2007) Climate change and the ecologist. Nature 448:550–552.
Thuiller W, Lafourcade B, Engler R, Araújo MB (2009) BIOMOD - a platform for ensemble forecasting of species distributions. Ecography 32:369–373.
Thuiller W, Richardson DM, Pyssek P, Midgley GF, Hughes GO, Rouget M (2005) Niche-based modelling as a tool for predicting the risk of alien plant invasions at a global scale. Global Change Biology 11:2234–2250.
Udo N (2016) Quels sont les facteurs naturels et humains conduisant au statut invasif ? Le cas de l’ajonc (Ulex europaeus) sur l’île de La Réunion. PhD thesis Université Rennes 1.
Udo N, Tarayre M, Atlan A (2017) Evolution of germination strategy in the invasive species Ulex europaeus. Journal of Plant Ecology 10:375–385.
Vicente J, Alves P, Randin C, Guisan A, Honrado J (2010) What drives invasibility? A multi-model inference test and spatial modelling of alien plant species richness patterns in northern Portugal. Ecography 33:1081–1092.
14
Vila M, Tessier M, Suehs CM et al. (2006) Local and regional assessments of the impacts of plant invaders on vegetation structure and soil properties of Mediterranean islands. Journal of Biogeography 33:853–861.
Vitousek PM, Antonio CM, Loope LL, Westbrooks R (1996) Biological invasions as global environmental change. American scientist 84:468–478.
Webber BL (2012) Comment on “ Climatic Niche. Science 193:10–12.
Wiens JJ, Graham CH (2005) Niche Conservatism: Integrating Evolution, Ecology, and Conservation Biology. Annual Review of Ecology, Evolution, and Systematics 36:519–539.
Wilcove D, Rothstein D, Dubow J, Phillips A, Losos E (2000) Leading threats to biodiversity: what’s imperiling U.S. species.In Stein B, Kutner L, Adams J (eds). Precious heritage: The status of biodiversity in the united states. Oxford Uni. Oxford, UK, 239–254.
Xu CY, Julien MH, Fatemi M et al. (2010) Phenotypic divergence during the invasion of Phyla canescens in Australia and France: Evidence for selection-driven evolution. Ecology Letters 13:32–44. Zurell D, Elith J, Schroder B (2012) Predicting to new environments: tools for visualizing model
15
Figure 1. Current world map of Ulex Europeaus occurrence at the global scale (top) and probability of presence predicted by the combined species distribution model build at the global scale (below). Red squares delimit climatic areas studied to assess climatic niche shift (NZ = New Zealand).
16
Figure 2. Global scale climatic niche of Ulex Europeaus (gorse) predicted by the combined species distribution model. The nine climatic variables used in the model are described using density distribution (beanplot v1.2 R package). The world climatic variable density is presented in black while the U. europaeus niche is presented in gray. The presence of U. europaeus was assumed when its probability was higher than the sensitivity–specificity sum maximization threshold (P=0.48). TMEAN, TMAX, TMIN and PPT are mean, maximum and minimum temperature, and precipitation (mm) respectively.
17
Figure 3. Probability of Ulex europaeus presence predicted by the native and introduced models (A). The color legend of probability is the same that the one used in Fig 1, and the area in green represents native niche for native model, and introduced niche for introduced models. Density distribution of U. europaeus presence (B) is presented for four climatic variables (annual TMEAN, TMAX of the warmest month, TMIN of the coldest month and annual PPT) for both native (blue) and invasive (red) models in introduced regions, using beanplot densities. The probability of presence was converted into true presence based on the sensitivity– specificity sum maximization threshold (P=0.48). The vertical bars indicate the median value of the distributions.
18
Figure 4. Comparison of native and introduced niche of Ulex europaeus in different introduced regions. This figure represents Kernel-smoothed PCA biplots of U. Europeaus presence predicted by species distribution models. Correlation circles show correlations between the 9 bioclimatic variables used, with principal component axes (see M&M for variable definitions). Predicted presences were obtained after the application of a threshold on probability (P > 0.48). Shading indicates density of presences. The niche change index (INC) between native and each introduced region ranges from 0 (identical distributions) to 1 (no overlap).
19
Figure 5. Similarity and divergence between introduced and native climatic niches. Results of multivariate climatic similarity surface (MESS) analysis between native and introduced models. The bars present the number of areas (5 arc min) where gorse presence is predicted by the models calibrated on introduced regions but not by the model calibrated on native regions (PINT threshold = 0.48). Climatic similarity is represented by positive values, climatic divergences are represented by negative values.