HAL Id: hal-01972282
https://hal.univ-lorraine.fr/hal-01972282
Submitted on 7 Jan 2019
HAL is a multi-disciplinary open access
archive for the deposit and dissemination of
sci-entific research documents, whether they are
pub-lished or not. The documents may come from
teaching and research institutions in France or
abroad, or from public or private research centers.
L’archive ouverte pluridisciplinaire HAL, est
destinée au dépôt et à la diffusion de documents
scientifiques de niveau recherche, publiés ou non,
émanant des établissements d’enseignement et de
recherche français ou étrangers, des laboratoires
publics ou privés.
Differentiation in Mainland vs. Corsican Populations of
Bumblebees
Thomas Lecocq, Nicolas Vereecken, Denis Michez, Simon Dellicour, Patrick
Lhomme, Irena Valterova, Jean-Yves Rasplus, Pierre Rasmont
To cite this version:
Thomas Lecocq, Nicolas Vereecken, Denis Michez, Simon Dellicour, Patrick Lhomme, et al.. Patterns
of Genetic and Reproductive Traits Differentiation in Mainland vs. Corsican Populations of
Bumble-bees. PLoS ONE, Public Library of Science, 2013, 8 (6), pp.e65642. �10.1371/journal.pone.0065642�.
�hal-01972282�
Differentiation in Mainland vs. Corsican Populations of
Bumblebees
Thomas Lecocq1*, Nicolas J. Vereecken2, Denis Michez1, Simon Dellicour2, Patrick Lhomme1, Irena Valterova´3, Jean-Yves Rasplus4, Pierre Rasmont1
1 Laboratoire de Zoologie, University of Mons, Mons, Belgium, 2 Evolutionary Biology and Ecology, Universite´ Libre de Bruxelles, Brussels, Belgium, 3 Institute of Organic Chemistry and Biochemistry, Academy of Sciences of the Czech Republic, Prague, Czech Republic,4 Institut national de la recherche agronomique, UMR Centre de Biologie pour la Gestion des Populations, Montferrier sur Lez, France
Abstract
Populations on islands often exhibit lower levels of genetic variation and ecomorphological divergence compared to their mainland relatives. While phenotypic differentiation in characters, such as size or shape among insular organisms, has been well studied, insular differentiation in quantitative reproductive traits involved in chemical communication has received very little attention to date. Here, we investigated the impact of insularity on two syntopic bumblebee species pairs: one including species that are phylogenetically related (Bombus terrestris and B. lucorum), and the other including species that interact ecologically (B. terrestris and its specific nest inquiline B. vestalis). For each bumblebee species, we characterized the patterns of variation and differentiation of insular (Corsican) vs. mainland (European) populations (i) with four genes (nuclear and mitochondrial, 3781 bp) and (ii) in the chemical composition of male marking secretions (MMS), a key trait for mate attraction in bumblebees, by gas chromatography-mass spectrometry (GC-MS). Our results provide evidence for genetic differentiation in Corsican bumblebees and show that, contrary to theoretical expectations, island populations of bumblebees exhibit levels of genetic variation similar to the mainland populations. Likewise, our comparative chemical analyses of MMS indicate that Corsican populations of bumblebees are significantly differentiated from the mainland yet they hold comparative levels of within-population MMS variability compared to the mainland. Therefore, insularity has led Corsican populations to diverge both genetically and chemically from their mainland relatives, presumably through genetic drift, but without a decrease of genetic diversity in island populations. We hypothesize that MMS divergence in Corsican bumblebees was driven by a persistent lack of gene flow with mainland populations and reinforced by the preference of Corsican females for sympatric (Corsican) MMS. The impoverished Corsican bumblebee fauna has not led to relaxation of stabilizing selection on MMS but to consistent differentiation chemical reproductive traits on the island.
Citation: Lecocq T, Vereecken NJ, Michez D, Dellicour S, Lhomme P, et al. (2013) Patterns of Genetic and Reproductive Traits Differentiation in Mainland vs. Corsican Populations of Bumblebees. PLoS ONE 8(6): e65642. doi:10.1371/journal.pone.0065642
Editor: Claude Wicker-Thomas, CNRS, France
Received March 15, 2013; Accepted April 25, 2013; Published June , 2013
Copyright: ß 2013 Lecocq et al. This is an open-access article distributed under the terms of the Creative Commons Attribution License, which permits unrestricted use, distribution, and reproduction in any medium, provided the original author and source are credited.
Funding: This work was supported by the Fonds pour la recherche dans l’industrie et l’agriculture (FRIA), the Fonds national pour la recherche scientifique (FRS-FNRS), the Fonds pour la Formation a` la Recherche Fondamentale et Collective (FNRS, FRFC 2.4613.10), the Office de l’Environnement de la Corse, the Direction Re´gionale de l’Environnement de Corse, the Academy of Sciences of the Czech Republic (subvention for development of research organization RVO: 61388963), the network Bibliothe`que du Vivant funded by the CNRS, the Muse´um National d’Histoire Naturelle and the Institut National de la recherche en Agronomie, and technically supported by the Genoscope. TL, PL and SD are FRIA grant holders. NJV received financial support from the FRS-FNRS (Belgium) through a post-doctoral grant (2008–2012). The funders had no role in study design, data collection and analysis, decision to publish, or preparation of the manuscript. Competing Interests: The authors have declared that no competing interests exist.
* E-mail: thomas.lecocq@umons.ac.be
Introduction
Islands have always been of particular interest for evolutionary biologists and ecologists alike. Indeed, insularity offers unique opportunities to investigate a range of micro-evolutionary processes that precede macro-evolutionary events [1]. Insularity has often led to the same consequences in phylogenetically disparate groups of organisms, the so-called ‘‘island syndrome’’. At species community level, islands are often characterized by depauperate fauna compared to the mainland [2–4], a phenom-enon that might affect rates of inter-specific interactions, e.g. with closely-related taxa, or with natural enemies [5]. At the species level, island populations are often characterized by a series of genetic and phenotypic changes. Theory predicts that reduced immigration rates from mainland, founder events and genetic drift
[2,6] generally result in island populations being genetically impoverished compared to their mainland counterparts [7–9]. Furthermore, populations confined to geographically-isolated and contrasting habitats on islands often experience ecomorphological divergence from their mainland relatives. This divergence could result from genetic changes (founder effects or drift) and/or from post-colonization adaptive changes produced by different selection regimes compared to the adjacent mainland habitats [1,2,10–15]. The trend in insular populations to depart from mainland phenotypes is known to affect a wide range of characters (morphology, physiology, behavior) as well as life-history traits [3,10,16–22]. Consequently to phenotypic changes, a vast range of species that have evolved distinct island forms have sometimes been ascribed to their own taxonomic status (races, subspecies or
sometimes even species) (e.g. [23–25]). Whether these phenotypic differences are genetically-based or reflect phenotypic plasticity (e.g. [26,27]) has not been deeply investigated.
Phenotypic differentiation of insular populations in characters such as size (dwarfism vs. gigantism) or shape has been the focus of abundant research thus far (see [4,15] and references therein). In contrast, insular differentiation in reproductive and quantitative traits such as sex pheromones has received comparatively far less attention (but see [28,29]), despite their key role in the maintenance of reproductive isolation (e.g. [30–35]). Like most reproductive traits, courtship pheromones are shaped (i) by intraspecific interactions to maximize encounter rates among conspecific mates (sexual selection [36,37]), and (ii) by interspecific interactions to maintain isolation barriers and decrease the likelihood of hybridization events among syntopic sister species [31,37–39], and to minimize eavesdropping by potential predators or parasites [40,41].
In this paper, we investigated the genetic and phenotypic consequences of insularity in Corsican bumblebees (Bombus, Hymenoptera, Apidae). We used a phylogenetic and phylogeo-graphic approach based on sequence analyses of four genes (nuclear and mitochondrial) along with comparative chemical analyses of the differentiation patterns and natural variation of male marking secretions (MMS). The MMS are an important reproductive trait in male bumblebees that determines the attraction of conspecific virgin females. We focused on two syntopic species pairs, one including two sister species (Bombus (Bombus) terrestris (L.) and B. (Bombus) lucorum (L.)) and the other with two ecologically interacting species (B. terrestris and its specific nest inquiline B. (Psithyrus) vestalis (FOURCROY)). Specifically, we
asked the following questions: (i) are Corsican bumblebees genetically and chemically differentiated from their conspecific European mainland populations? (ii) do Corsican bumblebees exhibit particular changes in the overall genetic diversity and male marking secretions variability compared to their conspecific European mainland populations (i.e., the relaxed selection hypothesis)?
Materials and Methods
Studied insular system and species
Corsica (8680 km2) is a continental, mountainous Mediterra-nean island located 160 km from the French coast, 12 km from Sardinia, 82 km from the Italy, and nearly 50 km from the Island of Elba, which is located 10 km off the coast of Italy. The island is a well-known biodiversity hotspot [42–45] that hosts a high diversity of endemic species [43,45,46] and also represents a major glacial refuge in Europe (e.g. [47]).
Corsican endemics differ in their biogeographic origin and in the way they colonized Corsica. Colonization by bumblebees may have occurred during the last Ice Age (Wu¨rm, 115 000–10 000 years) from Italy via the present Tuscan Archipelago [48,49]. Six endemic taxa are recorded from Corsica [48]. Bombus lucorum is a species widely distributed in the Palaearctic [50] while B. terrestris and B. vestalis are restricted to the West-Palaearctic region [51,52]. The nearest Corsican taxa of these species are: (i) B. lucorum renardi Radoszkowski 1884, (ii) B. terrestris xanthopus Kriechbaumer 1870, and (iii) B. perezi (Schulthess-Rechberg 1886), respectively. The taxonomic status of the Corsican populations is still not clearly defined [48,51,53–56]. Therefore, comparisons have been made between the Corsican taxa and their continental populations (for B. terrestris and B. lucorum) or their most closely-related mainland species (for B. vestalis and B. perezi) (Table 1). Corsican populations of these species are morphologically distinct [48] with specific
color patterns, black hairs and a red-brownish tail (Fig. 1). Previous studies on B. terrestris have shown that Corsican populations are genetically differentiated from those on the mainland [57] and exhibit a distinct diapause duration [58]. Likewise, Corsican populations of B. perezi are unique in being adapted to the winter phenology of their host, B. terrestris [48,59], contrary to continental populations of B. vestalis.
Courtship signals of male bumblebees include both behavioral and chemical features (see [60] for a review). Most bumblebee males patrol along paths where they scent-mark objects with species-specific secretions (male marking secretion, MMS) that attract conspecific virgin females [61,62]. The height and localization of marked objects differ among species [63]. Female bumblebees also produce sex pheromones, which elicit male mating behavior and which are involved in species recognition [64]. The MMS, the path configuration and possibly also female sex pheromones are involved in pre-mating recognition. Here, we focus on the most studied trait, the MMS, which consists of a complex mixture of (mainly aliphatic) compounds, with several major components (e.g. ethyl tetradecenoate in B. lucorum [65]) and with intraspecific variation (e.g. [56,66,67]). MMS are synthesized de novo by cephalic labial glands [68,69] and the chemical composition is not affected by environmental conditions, diet or imprinting [68].
Sampling
We sampled 57 males of B. terrestris (L.), 42 males of B. lucorum (L.), and 48 males of B. (Psithyrus) vestalis-perezi (FOURCROY) in
Corsica, as well as in localities spread across European mainland and Sardinia (Fig. 2, Table S1). Males were killed by exposing them to freezing conditions, at 220uC. The MMS were extracted in 200ml n-hexane from dissected cephalic labial glands or entire cut heads following De Meulemeester et al. [70]. Vials containing the solvent and sample were kept for 24 h at room temperature (20uC) to fulfill the extraction [70]. Beheaded bodies were preserved in 99% ethanol for DNA extraction. All samples were stored at 240uC prior to the analyses. Studied samples did not involve endangered or protected species. Permissions for collection of Corsican samples from were obtained via the Office de l’Environnement de la Corse and the Direction Re´gionale de l’Environnement de Corse. Collecting samples from lands of the Office National des Foreˆts, required permission, and this was obtained from the Office National des Foreˆts Me´diterrane´e. No specific permits were required for the other described field studies as collection did not occur in privately-owned or protected locations.
Molecular analyses
Gene selection, DNA preparation, amplification and sequencing. We sequenced four genes commonly used to study interspecific and intraspecific relationships among bumblebees (e.g. [57,71–73]): mitochondrial cytochrome oxidase 1 (COI), cytochrome b (Cytb), nuclear protein-coding gene elongation factor-1 alpha, F2 copy (EF-1a) and phosphoenolpyruvate carboxykinase (PEPCK). The usefulness of nuclear gene sequences in discriminating population-level divergence appears limited (even intron regions) by the substantially greater coalescence time (and associated variance) compared to mitochondrial genes. However, according to the short life cycle (one or two generations every year) of bumblebees, we tested putatively variable nuclear genes.
Total DNA extraction was performed using a QIAGEN DNeasyH Tissue Kit (Quiagen Inc., Valencia, CA). Legs were removed from the specimen, crushed using liquid nitrogen, and digested for four hours in proteinase K at 56uC. Voucher
specimens and PCR products used in molecular investigation were deposited at the University of Mons (Belgium).
Polymerase chain reaction (PCR) amplifications were carried out for all genes and all samples using primer pair Jerry/Pat [74] for COI, CB1/CB2 [75] for Cytb, F2-ForH/F2-RevH2 [76] for EF-1a, and FHv4/RHv4 [72]for PEPCK. PCR amplifications were carried out by initial denaturing for three minutes at 94uC, 35 (COI, EF-1a) or 40 (Cytb and PEPCK) cycles of one minute denaturing at 94uC, one minute annealing at 51uC (COI), 50uC (Cytb), 54uC (EF-1a) or 48.5uC (PEPCK), two minutes elongation at 72uC and a final extension for ten minutes at 72uC). Genes were sequenced with an ABI 3730XL sequencer (Applied Biosystems, Foster City, CA, USA) or by GENOSCOPE (Centre National de Se´quenc¸age; Evry, France). Both strands of each PCR product were sequenced.
Consensus sequences were computed with CodonCode Aligner 3.0.1. As bumblebee males are haploid [77], there is no uncertainty in the consensus sequences. The bumblebee origin
of each sequence was checked with BLAST 2.2.20 [78]. The alignment was performed by MAFFT ver.6. (using FFT-NS-2 algorithms, default parameters) [79]. The data matrix was computed on Mesquite 2.74 (build 486) [80]. Translation to proteins (using the Drosophila mitochondrial DNA genetic code or Universal genetic code) was performed with Mesquite. Sequences are available on Genbank, accessions JQ820504 to JQ821313 (Table S1).
The final molecular dataset spanned 3781 aligned nucleotides: 849 bp from COI (218 parsimony informative sites (PIS)), 459 bp from Cytb (112 PIS), 773 bp from EF-1a F2 copy containing a ,200 bp intron (92 PIS), and 859 bp from PEPCK (117 PIS). Haplotype numbers are 1) B. lucorum: three for COI, two for Cytb, one for EF-1a, and four for PEPCK; 2) B. terrestris: 14 for COI, seven for Cytb, one for EF-1a, and seven for PEPCK; 3) B. vestalis: six for COI, four for Cytb, three for EF-1a, and three for PEPCK.
Phylogenetic and population structure analyses. We performed phylogenetic and phylogeographic analyses to investi-Table 1. Corsican taxa and their continental populations (for B. terrestris and B. lucorum) or their most closely-related mainland species (for B. vestalis and B. perezi).
Corsican taxa Continental Counterparts B. lucorum renardi Radoszkowski 1884 B. lucorum lucorum (L.)
B. terrestris xanthopus Kriechbaumer 1870 B. terrestris dalmatinus Dalla Torre 1882 (Eastern Europe) B. terrestris lusitanicus Kru¨ger 1956 (Iberian Peninsula) B. terrestris terrestris (L.) (Western Europe)
B. perezi (Schulthess-Rechberg 1886) B. vestalis (Fourcroy 1785) doi:10.1371/journal.pone.0065642.t001
Figure 1. Morphological differentiation between mainland and Corsican taxa of the three bumblebee species investigated. The female color patterns are represented. Bombus lucorum and B. terrestris are sister species in the subgenus Bombus and B. vestalis is a specific nest inquiline of B. terrestris.
gate the extent of genetic differentiation/isolation of Corsican populations of each bumblebee species. In phylogenetic analyses, we analyzed each gene independently and combined (all mitochondrial genes and all nuclear genes) using maximum parsimony (MP), maximum likelihood (ML) and Bayesian methods (MB). A test of saturation was applied to each fragment in PAUP* 4.0b 10 [81]. The Incongruence Length Difference (ILD) test [82], as implemented by PAUP*, was used to evaluate incongruence between genes. Trees were rooted with basal subgenus of the bumblebee clade: Mendacibombus (Bombus mendax Gerstaecker 1869 and Bombus shaposnikovi (Skorikov 1910)) [72,83,84]. Other closely related taxa were included in our analyses: Bombus (Bombus) affinis Cresson 1863, Bombus (Psithyrus) bohemicus Seidl 1937, Bombus (Bombus) hypocrita Pe´rez 1905, Bombus (Bombus) ignitus Smith 1869, and Bombus (Bombus) sporadicus Nylander 1848.
Heuristic searches were performed in MP using 1000 random additions and tree bisection reconnection branch swapping, keeping the best trees only. Gaps were regarded as a fifth state. Majority rule 50% consensus (MJ50) trees were constructed from analyses of individual genes and from all genes combined using parsimony criteria in PAUP* 4.0b 10 for equally-weighted MP analyses. Clade support values [85] were estimated using nonparametric bootstrapping in PAUP* (10000 replicates, 1000 random additions, 500 trees saved per replicate).
ML analyses were conducted in GARLI 2.0 [86]. Each gene was partitioned to explore the best substitution model: 1) EF-1a into two exons and one intron; 2) PEPCK into two exons and two introns; 3) COI, Cytb, each EF-1a exon, and PEPCK exons by base position (1st, 2ndand 3rd). The best fitting substitution models were chosen with jModeltest [87] using the Akaike information criteria corrected for small sample sizes (AICc) [88] for each dataset. The chosen models were: 1) For COI: TIM2+I (1st) and TPM2uf+I+G (2nd and 3rd); 2) For CytB: TPM1uf+G (1st), TrN+I+G (2nd) and HKY+G (3rd); 3) For EF-1a exon 1: F81 (1st
and 2nd) and TIM2+G (3rd); 4) For EF-1a intron: TIM1+G; 5) For EF-1a exon 2: TrN (1st), JC (2nd) and TPM2uf (3rd); 6) For PEPCK intron 1: TPM2uf+G; 7) For PEPCK exon 1 HKY (1st), K80 (2nd) and TPM3uf (3rd); 8) For PEPCK intro 2 TIM3+G; 9) For PEPCK exon 2: K80 (1st and 2nd) and TIM3+G (3rd). A random starting tree and the automated stopping criterion (stop when the ln score remained constant for 20000 consecutive
generations) were used. Ten independent runs in GARLI were carried out for each gene and for the combined data; the topology and 2ln L were identical among replicates. The highest likelihood of one of those runs was retained. Statistical confidence in nodes was evaluated using 1000 non-parametric bootstrap replicates [85] using the automated stopping criteria set at 10000 generations. More bootstrap replicates could not be performed because it would have required unpractical computing times. Topologies with bootstrap values $70% were considered well supported [89]. Bayesian analyses (MB) were carried out using MrBayes 3.1.2 [90]. The model selection process was the same as that for ML analysis. Selected models which are not implemented in MrBayes were substituted by the closest over-parameterized model [91]. The TIM1, TIM2, TIM3, TPM1uf, TPM2uf, TPM3uf and TrN substitution models were replaced by the GTR model. The proportion of invariable sites (I) and gamma distributed rates (G) defined in jModeltest were conserved in all models. Moreover, genes were analyzed individually and collectively. Five indepen-dent analyses were carried out for each gene and for the combined data (10 million generations, four chains with mixed-models, default priors, saving trees every 100 generations). The analyses were stopped after checking convergence between runs using the average standard deviation of split frequencies and by plotting likelihood values across generations using Tracer 1.4 [92]. The first one million generations were discarded as burn-in. The phylogeny and posterior probabilities were then estimated from the remaining trees and a majority-rule 50% consensus tree was constructed. Topologies with posterior probabilities $0.95 were considered well supported [93].
Haplotype networks were constructed using the median joining method in Network 4.6.1.0 (available at http://www.fluxus-engineering.com) for each gene and for each species. The median-joining method uses a maximum parsimony approach to search for all the shortest phylogenetic trees for a given data set [94]. To reconstruct the network, we weighted transversions twice as high as transitions.
We assessed patterns of genetic structure (a) only in mainland populations (b) in all sampled populations to evaluate whether or not the Corsican populations were genetically isolated from the mainland. We used the Analysis of Molecular Variance (AMOVA) [95] in Arlequin ver. 3.5 [96] with 100,000 random permutations.
Figure 2. Sample maps of the three bumblebee models. A = B. lucorum; B = B. terrestris; C = B. vestalis. The number near sample sites is the number of samples collected at each sample sites.
The estimation of Fst statistics considering one group of
populations was used to assess potential genetic structure on the mainland and to determine if the addition of Corsican populations in the mainland group increases the population genetic structure of the species [97].
Genetic diversity within populations. Genetic diversity was estimated using nucleotide diversity (p) [98] and haplotype diversity (h) [99] using DnaSP [100] for each gene and for each species.
Male marking secretion analyses
Chemical analyses. The composition of MMS was deter-mined by gas chromatography-mass spectrometry (GC-MS) on a Finigan GCQ with a DB-5 ms non-polar capillary column (5% phenyl (methyl) polysiloxane stationary phase; 30 m60.25 mm6 0.25mm) and an ion trap in electron impact mode ‘‘full scan (300– 600)’’. We used a splitless injection mode (220uC) and helium as carrier gas (50 cm/s). The temperature program of the column was set to 70uC for two minutes and then increased at a rate of 10uC by minute to 320uC. The temperature was then held at 320uC for five minutes. Compounds were identified in XcaliburTM
using their mass spectra compared to those at National Institute of Standards and Technology library (NIST, U.S.A) using NIST MS Search 2.0. The double bond positions were determined i) from mass spectra of dimethyl disulphide adducts of unsaturated components (reaction time: 4 h) and ii) by chemical ionization with acetonitrile as a reaction gas. The products were analyzed by GC-MS using the same temperature program as for original extracts. An ion trap GC-MS instrument (Varian Saturn, 2000) was used for chemical ionization.
All samples were analyzed using a gas chromatograph Shimadzu GC-2010 with a SLB-5 ms non-polar capillary column (5% diphenyl/95% dimethyl siloxane; 30 m60.25 mm60.25mm) and a flame ionization detector. The chromatographic conditions were the same as those abovementioned. The peak areas of compounds were quantified using GCsolution Postrun (Shimadzu Corporation) with automatic peak detection and noise measure-ment. Relative amounts (RA in %) of compounds in each sample were calculated by dividing the peak areas of compounds by the total area of compounds in each sample using GCsolution Postrun (Shimadzu Corporation) with automatic peak detection and noise measurement. We did not use any correction factor to calculate the RA of individual compounds. All compounds for which RA were recorded as less than 0.1% for all specimens were discarded [101]. The data matrix for each species was elaborated with the relative proportion of each compound for each individual. Data matrices have been deposited in Tables S2, S3, S4.
Comparative Statistical Analyses Corsica versus mainland. All statistical analyses were performed using R [102] to detect MMS differentiations between insular and continental populations. Three groups were defined; each group included one Corsican endemic and its continental counterpart(s). Data consisting of the relative proportion of all compounds were transformed (log (x-1)) to reduce the great difference of abundance between highly and slightly concentrated compounds, and we then standardized (mean = 0, standard deviation = 1) the data matrix to reduce the sample concentration effect.
Clustering methods have already proved useful to detect and test differentiation among Bombus MMS (e.g. [73,103]), so we used this approach to detect distance among taxa. Three additional matrices were computed: Euclidean, Pearson Phi Correlation, and Manhattan. Three clustering methods were used for each association matrix: single, complete, ward and UPGMA (R-package ape, [104]). We assessed the uncertainty in hierarchical
cluster analysis using p-values calculated via multiscale bootstrap resampling with 50,000 bootstrap replications (R-package pvclust, [105]). When we detected MMS differentiations between Corsican and continental populations in clustering analyses, we assessed results by performing multiple response permutation procedure (MRPP) and a perMANOVA, i.e. a permutation-based version of the multivariate analysis of variance (MANOVA) (R-package vegan, [106]). The MRPP is a nonparametric, multivariate procedure that tests the null hypothesis of no difference between groups. MRPP has the advantage of not requiring distributional assumptions (such as multivariate normality and homogeneity of variances). A perMANOVA analysis was performed using the Bray-Curtis similarity matrix and 1000 permutations. Like conventional analyses of variances, the perMANOVA calculates an F statistic by taking the ratio of among group sums of squares to within group sums of squares. The perMANOVA is robust to violations of homogeneity of dispersion when the groups’ sample sizes are equal. The returned p-value is used to detect significant differences which reflect changes in abundance and chemical composition of the MMS.
Chemical variability of MMS in Corsica vs. mainland populations. To evaluate differences in the compositional variability of MMS between Corsica and the mainland, we used a distance-based test for multivariate homogeneity of group dispersions (MHGH) for a one-way ANOVA design [107]. The procedure first calculates the Euclidean distances between MMS composition and respective group centroids (Corsica vs. mainland) on Pearson Phi Correlation matrices (R- package vegan [106]). To test if one group is more variable than the other, the magnitudes of these distances are then compared between groups using ordinary ANOVA. Moreover, a permutation test was run to generate a permutation distribution of F under the null hypothesis of no difference in dispersion between groups (R- package vegan [106]).
Interspecific chemical distance. To examine changes in intra- and inter-specific MMS variability between mainland and Corsican populations (i.e. the relaxed selection hypothesis), we compared the inter-specific chemical distance in Corsica vs. the mainland in R. We computed the Pearson Phi Correlation distance matrix for each pair of species (B. lucorum vs B. terrestris, B. lucorum vs B. vestalis-perezi and B. terrestris vs B. vestalis-perezi) among Corsican individuals and among mainland individuals. We then computed the mean distance of each individual to all hetero-specific individuals on Corsica and on the mainland. Based on these mean distances, we performed Student’s t-test with the null-hypothesis of no-difference in chemical interspecific distances between Corsica and mainland. When the t-test assumptions (independent observations, residues normality (Shapiro-Wilk test) and homoscedasticity (Bartlett’s test)) were not met (p-values,0.05 for Shapiro and Bartlett’s tests), equivalent non-parametric tests (Wilcoxon signed-rank test) were conducted.
Results
Genetic and chemical differentiation of the insular populations
All phylogenetic analyses (maximum parsimony (MP), maxi-mum likelihood (ML) and Bayesian methods (MB)) performed on the same dataset led to similar tree topologies and to identical relationships between Corsican and continental taxa. Mitochon-drial (COI, Cytb and COI+Cytb) and nuclear (EF-1a, PEPCK and EF-1a+PEPCK) datasets produced different topologies. Mitochondrial datasets showed similar and well resolved topolo-gies. Phylogenetic analyses based on nuclear datasets recovered all deep hierarchical levels relationships among subgenera and
between species but EF-1a failed to discriminate between B. lucorum and B. terrestris (see supplementary trees available at TreeBase (study accession number S14022). Identical results were obtained using Network analyses (Fig. 3).
Analyses of genetic differentiation between populations of Corsican and mainland bumblebee taxa indicated a mitochondrial divergence but no nuclear differentiation. With the exception of B. lucorum, phylogenetic analyses of mtDNA failed to resolve continental and Corsican populations in two well-supported monophyletic groups. Mitochondrial haplotypes networks clearly illustrate that Corsican and continental populations form discrete groups. These findings are confirmed by strong mitochondrial genetic structure detected by AMOVA tests (Fst.0.72, P -value,0.01; Table 2).
We detected 55 chemical compounds in the MMS of B. lucorum, 105 in B. terrestris and 56 in B. vestalis-perezi (Tables S5, S6, S7). The main compounds (median.10%) of B. lucorum were aliphatic esters (ethyl tetradecenoate and hexadecyl tetradecenoate). B. vestalis
secreted isoprenoids (geranylcitronellol and geranylcitronellyl acetate) and aliphatic aldehydes (icosadienal) as main compounds (median.10%). Corsican B. lucorum and B. perezi have the same main compound as their continental counterparts but different compounds present in smaller relative amounts (Tables S2 and S4). The MMS composition of continental B. lucorum and B. vestalis is very similar to previous studies [65,108]. The main compounds of B. terrestris were (i) 2,3-dihydrofarnesol in B. terrestris dalmatinus and B. terrestris sassaricus, (ii) dihydrofarnesyl dodecanoate in B. terrestris terrestris and B. terrestris lusitanicus, (iii) tricosane for Corsican B. terrestris xanthopus. Corsican B. terrestris differed also in small compounds (Table S3). The MMS composition for mainland and Sardinian B. terrestris were similar to those reported by Coppe´e [56].
The statistical analyses of the MMS (MMS composition see Tables S2, S3, S4, S5) indicate that Corsican individuals differed from their conspecific mainland populations in all clusters, irrespective of the distance matrices and clustering methods
Figure 3. Median-joining network of haplotypes found in 4 model species ranges based on COI (on the left) and Cytb (on the right). A = B. lucorum; B = B. terrestris; C = B. vestalis. The sizes of the circles are proportional to frequencies of haplotypes. The red points on the lines represent undetected/extinct intermediate haplotype states. The numbers on the lines represent the number of mutations between two close haplotypes. The black circles are outgroups (see Table S1).
(Fig. 4; only the UPGMA cluster based on the Phi Correlation matrix is shown). This chemical differentiation of Corsican taxa and samples is supported by high values of multiscale bootstrap resampling (.80%) (Fig. 4). PerMANOVA tests confirmed differentiation between Corsican and mainland populations for all species: B. lucorum (MRPP: T = 0.2869, A = 0.2405, P-value,0.01; perMANOVA: DF = 1, F = 30.95, P-value,0.01), B. terrestris (MRPP: T = 0.3023, A = 0.51, P-value,0.01; perMA-NOVA: DF = 1, F = 26.141, P-value,0.01) and B. vestalis-perezi (MRPP: T = 0.3782, A = 0.1543, P-value,0.01; perMANOVA: DF = 1, F = 17.705, P-value,0.01).
Genetic diversity and chemical variability in insular populations
Nucleotide and haplotype diversities (p and h, respectively) recorded in Corsican and continental samples were globally low (Tables 3 and 4). The values of these parameters differed between Corsican and mainland populations (Tables 3 and 4) but the nucleotide and haplotype diversities were not always lower in Corsica compared to the mainland. We obtained higher or identical p and h values in Corsica compared to the mainland for all genes in B. lucorum, and 2) lower or similar p and h values in Corsica compared to the mainland for all genes for B. terrestris and B. vestalis.
The comparison of the MMS variability between Corsican and continental populations showed that there was a significant difference for B. terrestris (larger for mainland populations: AMOVA of multivariate dispersion P -value,0.01, permutation test of multivariate dispersion P -value,0.01) but not for other species: B. lucorum (AMOVA P -value = 0.249, permutation test p-value = 0.253) and B. vestalis (AMOVA P -value = 0.213, permutation test P -value = 0.213)
Chemical interspecific distances in insular and continental communities
Interspecific distance between each species pair among Corsican individuals and among mainland individuals showed a larger interspecific distance in continental individuals (Distance B. lucorum – B. terrestris: t = 23.8395, df = 88, P -value,0.01; Distance B. terrestris – B. vestalis: W = 227, P-value,0.01; Distance B. lucorum – B. vestalis: W = 0, P -value,0.01).
Discussion
Genetic divergences
Most island populations experience reduced gene flow with the mainland [2]. The reduced gene flow can lead to genetic differentiation [3] and changes in genetic diversity [7]. The island populations diverge over time due to persistent genetic drift and/ or changes in selection pressures compared to the mainland. Genetic differentiation of insular populations is common in birds (e.g. [109]), frogs (e.g. [110]), lizards (e.g. [111]), flying mammals (e.g. [112]), land insects (e.g. [113]), flying insects (e.g. [114]), and other bumblebee species (e.g. [57,115,116]). Island populations generally exhibit a lower genetic diversity compared to mainland populations because of genetic drift, founder effects and inbreed-ing, especially in small subpopulations [117]. The decrease of genetic diversity has also been reported in different groups of organisms [7,118,119]. Frankham [7] showed that a significant majority of island populations presented less genetic variability than their mainland counterparts, with an average reduction of 29%. This author noticed that the reduction in genetic variation was similar in island endemic and in non-endemic island populations in insects.
Here we show that geographic isolation has driven Corsican bumblebees to a significant degree of genetic differentiation (see also [57]). Genetic divergences between Corsican and continental populations are only observed in mitochondrial genes. The larger potential flight distance of males (which do not transmit their mitochondrial genome) compared to females cannot explain this result because the distance between Corsica and the mainland is larger than the potential flight distance of both sexes [120,121]. This difference is presumably the consequence of the substantially greater coalescence time (and associated variance) of nuclear genes as compared to mitochondrial genes [122].
Contrary to predictions outlined by the island syndrome [119], there is no general trend of drastic loss of genetic diversity in Corsica compared to the mainland. High migration rates and separate migrations from differentiated mainland populations are generally invoked to explain why some island populations have similar genetic variation to mainland populations [7]. However, we hypothesize that the results presented here could be explained by particular events on the mainland rather than on the island. Indeed, the unexpected low genetic diversities (low p and low or intermediate h) on the mainland (comparison with other insects, e.g [123,124]) despite the extensive sampling across species distribution could reflect a strong and prolonged bottleneck, or a recent population expansion from a small number of founder Table 2. Results of the AMOVA analysis using mainland populations alone and with insular populations.
FST
Species Origin COI EF1A Cytb PEPCK
B. lucorum Continent 0 0 0 ns Continent+Corsica 0.93825 0 1 ns B. terrestris Continent 0.63681 0 ns 0.33551 Continent+Corsica 0.83433 0 0.78066 ns Continent+Sardinia 0.68882 0 0.60738 0.40192 B. vestalis Continent ns ns ns ns Continent+Corsica 0.81531 0.60479 0,78464 0.47727 Only Fst value of the AMOVA tests with p-values,0.01 are represented (ns = non significant).
individuals [125]. This is most likely driven by past population bottlenecks during Quaternary glacial events as observed in several European species (e.g. [125–127]). The relatively high level of genetic diversity in Corsica might therefore suggest that the island has acted as a hotspot of intraspecific biodiversity, e.g. as a refuge during the glaciations as observed in other islands such as Sicily for rodents [128] and parasitic nematodes [129] or in Macaronesia for bryophytes [130]. Further studies of these patterns of low genetic diversity in the mainland are needed to test this hypothesis. Chemical divergences
Reproductive traits are generally assumed to be shaped by stabilizing selection to maximize encounter rates among conspe-cifics [36,131–135], to maintain reproductive isolation barriers and to decrease the likelihood of hybridization events among syntopic sister species [31,37–38]. The lower species diversity found on islands can theoretically reduce inter-specific mating opportunities (and therefore decrease the likelihood of hybridiza-tion events among sister species), which could relax the stabilising selection on courtship signals. We therefore expected an increase of MMS variability among the Corsican bumblebees due to the impoverished bumblebee fauna on the island.
Our results do not support this hypothesis since we did not observe a relaxation of the stabilizing selection on the MMS within the island. Geographic variation in courtship traits found here has been observed in several species such as moths [136–139], Drosophila flies [140], bees [141,142]) and birds [143]. Previous studies showed that bumblebee females (ethological tests are only available for B. terrestris) are able to discriminate the MMS from various populations and, in the case of Corsican females, to exhibit significant preferences for the MMS from Corsican subspecies [56]. Many studies on sexual selection have largely documented that individuals often recognize and prefer to mate with individuals from ‘‘local’’ vs ‘‘exotic’’ populations (e.g. [36,144,145]). Preferences of bumblebee females suggest sexual selection acting on the MMS and stabilizing the Corsican MMS type. In contrast, preferences of the receiver for exotic pheromonal blend have been also observed in bees [141], flies [144] and crickets [146]. In B. terrestris, females prefer the MMS of exotic males inside its own subspecies, probably to minimize sibling mating [56]. We suggest that the current Corsican MMS pattern
(divergence from the mainland and small inter-individuals variation) is explained by sexual selection (balance between female preferences for its own subspecies and exotic MMS) and genetic differentiation. The genetic basis of variation in chemical blends involved in chemical communication and its heritability has been demonstrated in moths (review in [147]). Genetic differentiation can thus result in altered chemical blends [39,132,148–150]. Most of these altered blends are selected against (stabilizing selection) through the sexual selection (i.e. altered blends are not recognized by receivers) [31]. Nevertheless some releasers with an altered blend can evolutionarily be tracked by receivers because of a putative wide response window of receivers (e.g. in moths [149]). Moreover, these releasers with an altered blend can spread in the population, thanks to some ecological factors (e.g. [151]), intraspecific factors strongly selected for such a change (e.g. receiver preference [132]), or stochastic events prevailed over selection [152]. In Corsican bumblebees, we expect that a recognized altered blend has spread in the population and overcome old signals through preference of the females for exotic blends before a new period of stabilizing selection [132]. Insular species community
Like a physical landscape cluttered with visual stimuli compet-ing for attention, the ‘‘scentscape’’ is muddled with odors of different types arising from a wide variety of sources [153]. Thus, in order to successfully communicate with the recipients (e.g. minimization of mismating events), the courtship signal of a species is shaped by selection to be different from others produced in the same environment [31,38,39]. This selection for species specific courtship signal corresponds to trap each species to a narrow range of signals different from other scents of the local scentscape (theory of adaptive landscape [152]). Changes in taxa composition of local species community or in chemical signals of species of this community can thus lead to reorganising of the local scentscape. The Corsican MMS pattern (divergence from the mainland and small inter-individuals variation) and changes in MMS interspecific distances between mainland and the island suggest that scentscape reorganization happened on the island.
Figure 4. Unweighted pair group method with arithmetic mean (UPGMA) cluster based on a correlation matrix calculated from the matrix of male marking secretion. A = B. lucorum (55 compounds X 42specimens); B = B. terrestris (105 compounds X 56 specimens); C = B. vestalis (56 compounds X 48 specimens). Values above branch represent multiscale bootstrap resampling (only values .80% are given).
doi:10.1371/journal.pone.0065642.g004
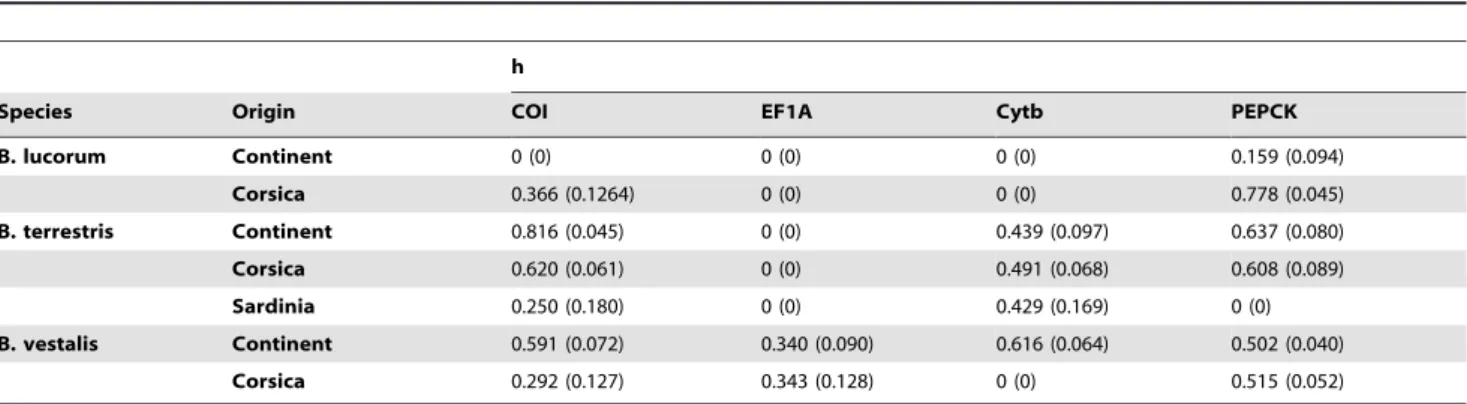
Table 3. Haplotype diversity observed among individuals of three species groups present on island or on mainland.
h
Species Origin COI EF1A Cytb PEPCK B. lucorum Continent 0 (0) 0 (0) 0 (0) 0.159 (0.094) Corsica 0.366 (0.1264) 0 (0) 0 (0) 0.778 (0.045) B. terrestris Continent 0.816 (0.045) 0 (0) 0.439 (0.097) 0.637 (0.080) Corsica 0.620 (0.061) 0 (0) 0.491 (0.068) 0.608 (0.089) Sardinia 0.250 (0.180) 0 (0) 0.429 (0.169) 0 (0) B. vestalis Continent 0.591 (0.072) 0.340 (0.090) 0.616 (0.064) 0.502 (0.040) Corsica 0.292 (0.127) 0.343 (0.128) 0 (0) 0.515 (0.052) h is the haplotype diversity and the values in brackets are the standard deviations.
Insular inquiline species
Bombus terrestris and B. vestalis-perezi, the host-inquiline pair, are both genetically and ecologically differentiated from the mainland. These differentiations could be generated by a process of reciprocal adaptations in response to selective pressures imposed by the interacting species on each other (coevolution) [154]. Morphological and chemical adaptations to parasitism suggest a coevolution (evolutionary arms race) between B. terrestris and B. vestalis [155–157]. However, the similar pattern of differentiation in Corsican B. lucorum suggests that similar ecological constraints or stochastic events, rather than coevolution, might be responsible for observed patterns of co-differentiation [158,159].
Insular speciation process
The geographic differentiation of courtship traits can directly interfere in the intraspecific communication between distant populations (e.g. in moths [160] or in bumblebees [161]); the consequence can range from simple regional variation (like dialects in songbirds [162] or in moths [163] or in solitary bees [141] consisting of different relative amounts of the same key compounds) to the establishment of a reproductive (pre-zygotic) isolation barriers between populations [164].
Results on MMS of Corsican B. lucorum and B. perezi could suggest only a Corsican dialect because of insular and continental populations share the same main compounds. Further bioassays on these two taxa are needed to test this hypothesis. Among B. terrestris, MMS differentiation of Corsican population involves main compounds and could suggests more drastic consequences on pre-mating recognition. Behavioral bioassays support this hypothesis: B. terrestris females exhibit significant preferences for MMS from its own subspecies [56] even if all subspecies are able to interbreed in experimental conditions [58,161,165,166]. Coppe´e [56] suggested an incipient allopatric speciation process for Corsican B. terrestris according to MMS divergence and behavioral bioassays. However, pre-mating animal communica-tion is highly complex and often involves multiple mating cues and signal modalities [167–172]. Detecting speciation process driven by differentiation in reproductive traits needs a global view of the species mating recognition system [31], which is difficult to comprehend. Moreover, establishing reproductive isolation in natural conditions by divergence in reproductive traits between insulars and continentals means that a degree of subjectivity is necessary in deciding whether allopatric populations have diverged enough to prevent interbreeding [173]. Therefore, further integrative taxonomy, including on morphologic and genetic criterions [73,174] based on an adapted species concept
for the comparison of allopatric taxa (e.g. [175]), are needed in order to assess if the Corsican MMS differentiations involve pre-mating reproductive isolations.
Conclusions
Compared to mainland populations, isolation of Corsican populations has led to genetic and MMS divergences. The Corsican taxa have presumably diverged by allopatric differenti-ation without genetic and demographic processes intrinsic to island populations, such as loss of genetic diversity. We hypoth-esize that MMS divergence in Corsican bumblebees most likely results from genetic differentiation, reinforced by insular specific sexual selection. The impoverishment of Corsican bumblebee fauna has not led to relaxing the stabilising selection on MMS. However, MMS differentiation and changes in bumblebee community in Corsica seem to have led to the reorganization of signal system on the island.
Supporting Information
Table S1 Table of sampling. Group = Group model species; Code = Sample labels used in figures; Population = names of populations used in SMP and genetic analyses; Land: BE = Bel-gium, CZ = Czech Republic, DE = Germany, DK = Denmark, FR = France, GR = Greece, HU = Hungary, IT = Italy, NL = Netherlands, PL = Poland, RO = Rumania, SE = Sweden, SK = Slovakia, SL = Slovenia; Recorder : AC = Audrey Coppe´e, AR = Arnaud Roelandts, DM = Denis Michez, MC = Maurizio Cornalba, MT = Michael Terzo, PL = Patrick Lhomme, PR = Pierre Rasmont, SD = Simon Dellicour, SL = Sophie Lam-bert, TD = Thibaut De Meulemeester, TL = Thomas Lecocq; Cytb, COI, EF-1a, and PEPCK are the Genbank accession numbers for each samples.
(XLS)
Table S2 MMS data matrix (relative amounts of each compound) of B. lucorum.
(XLS)
Table S3 MMS data matrix (relative amounts of each compound) of B. terrestris.
(XLS)
Table S4 MMS data matrix (relative amounts of each compound) of B. vestalis.
(XLS)
Table 4. Nucleotide diversity observed among individuals of three species groups present on island or on mainland.
p
Species Origin COI EF1A Cytb PEPCK B. lucorum Continent 0 0 0 0.00037 (0.00022) Corsica 0.00043 (0.00015) 0 (0) 0 (0) 0.00145 (0.00017) B. terrestris Continent 0.01286 (0.00154) 0 (0) 0.00103 (0.00026) 0.00112 (0.00023) Corsica 0.00085 (0.00014) 0 (0) 0.00107 (0.00015) 0.00165 (0.00038) Sardinia 0.00029 (0.00021) 0 (0) 0.00093 (0.00037) 0 (0) B. vestalis Continent 0.00120 (0.00021) 0.00044 (0.00012) 0.00157 (0.00023) 0.00058 (0.00005) Corsica 0.00045 (0.00022) 0.00045 (0.00014) 0 (0) 0.00059 (0.00006) pis the nucleotide diversity and the values in brackets are the standard deviations.
Table S5 List of the identified compounds in Corsican and continental B. lucorum. Molecular weight (MW (m/z)), median (Med (%)), first and fourth quartiles (Q1 (%) and Q2 (%)), minimum and maximum (Min (%) and Max (%)) of the 55 identified compounds. Unknown Lucorum x are undetermined compounds.
(XLS)
Table S6 List of the identified compounds in Corsican, Sardinian and continental B. terrestris Molecular weight (MW (m/z)). Median (Med (%)). First and fourth quartiles (Q1 (%) and Q2 (%)). Minimum and maximum (Min (%) and Max (%)) of the 105 identified compounds. Unknown Terrestris x are undeter-mined compounds.
(XLS)
Table S7 List of the identified compounds in B. perezi and B. vestalis. Molecular weight (MW (m/z)). Median (Med (%)). First and fourth quartiles (Q1 (%) and Q2 (%)). Minimum and maximum (Min (%) and Max (%)) of the 56 identified compounds. Unknown Vestalis x are undetermined compounds.
(XLS)
Acknowledgments
We are very grateful to B. N. Danforth and M. M. Lo´pez-Uribe for hosting us at Cornell University (Ithaca, U.S.A.), and to P. Mardulyn for his hospitality at the Universite´ Libre de Bruxelles (Brussels, Belgium) for the molecular analysis. We gratefully acknowledge A. Roelandts (Mons, Belgium), M. Cornalba (Pavia, Italy), and A. Jenic (Ljubljana, Slovenia) for providing samples and for their help and support in sampling. We are also grateful to T. De Meulemeester (Mons, Belgium) for his help in statistical analysis. Special thanks are also due to A. M. Aytekin (Ankara, Turkey), J. Litman (Ithaca, USA), S. Patiny (Gembloux, Belgium), C. Praz (Neuchatel, Switzerland), and S. Lambert (Mons, Belgium) for their helpful comments and discussions on earlier versions of this manuscript. Authors acknowledge the Centre des Langues Vivantes (University of Mons) and J. Litman (Ithaca, USA) for the English correction.
Author Contributions
Conceived and designed the experiments: TL NJV. Performed the experiments: TL DM. Analyzed the data: TL NJV IV. Contributed reagents/materials/analysis tools: TL DM SD PL IV JYR PR. Wrote the paper: TL NJV. Data interpretation and critical discussion of the conclusion: TL NJV DM SD PL IV JYR PR.
References
1. Grant PR (1998) Evolution on Islands. Oxford University Press, Oxford, USA. 352p.
2. Mac Arthur R, Wilson E (1967) The Theory of Island Biogeography. Princeton, N.J.224p.
3. Blondel J (1995) Bioge´ographie : Approche e´cologique et e´volutive. Masson, Paris. 297p.
4. Whittaker RJ, Ferna´ndez-Palacios JM (2007) Island Biogeography - Ecology, Evolution, and Conservation (2nd Edition). Oxford University Press, Oxford, UK. 285p.
5. Hochberg ME, Møller AP (2001) Insularity and adaptation in coupled victim-enemy associations. J Evol Biol 14:539–551.
6. Halkka O, Raatikainen M, Halkka L (1974) The founder principle, founder selection, and evolutionary divergence and convergence in natural populations of Philaenus. Hereditas 78:73–84.
7. Frankham R (1997) Do island populations have less genetic variation than mainland populations? Heredity 78:311–327.
8. Hinten G, Harriss F, Rossetto M, Braverstock PR (2003) Genetic variation and island biogreography: Microsatellite and mitochondrial DNA variation in island populations of the Australian bush rat, Rattus fuscipes greyii. Conserv Genet 4:759–778.
9. Knopp T, Cano JM, Crochet P-A, Merila¨ J (2007) Contrasting levels of variation in neutral and quantitative genetic loci on island populations of moor frogs (Rana arvalis). Conserv Genet 8:45–56.
10. Foster JB (1964) Evolution of mammals on islands. Nature 2002:234–235. 11. Carlquist S (1974) Island Biology. Columbia University Press, New York, USA.
656 p.
12. Templeton AR (1980) The theory of speciation via the founder principle. Genetics 94:1011–1038.
13. Carson HL, Templeton AR (1984) Genetic revolutions in relation to speciation phenomena: the founding of new populations. Annu Rev Ecol Syst 15:97–131. 14. Cody ML (2006) Plants on Islands - Diversity and dynamics on a continental archipelago. University of California Press, Berkeley, Los Angeles and London. 269p.
15. Losos JB, Ricklefs RE (2009) Adaptation and diversification on islands. Nature 457:830–836.
16. Grant PR (1965) Plumage and the evolution of birds on islands. Syst Zool 14:47–52.
17. Van Valen LM (1973) A new evolutionary law. Evol Theor 1:1–30. 18. Adler GH, Levins R (1994) The island syndrome in rodent populations. Q Rev
Biol 69:473–490.
19. Quammen D (1996) The song of the Dodo - Island biogeography in an age of extinctions. Hutchinson. 702p.
20. Clegg SM, Owens IPF (2002) The ‘island rule’ in birds: Medium body size and its ecological explanation. P Roy Soc B-Biol Sci 269:1359–1365.
21. Raia P, Guarino FM, Turano M, Polese G, Rippa D, et al. (2010) The blue lizard spandrel and the island syndrome. BMC Evol Biol 10
22. Covas R (2012) Evolution of reproductive life histories in island birds worldwide. P Roy Soc B-Biol Sci 279:1531–1537.
23. Nilson G, Andre´n C (1981) Morphology and taxonomic status of the grass snake, Natrix natrix (L.) (Reptilia, Squamata, Colubridae) on the island of Gotland, Sweden. Zool J Linn Soc-Lond 72:355–368.
24. Beheregaray LB, Ciofi C, Caccone A, Gibbs JP, Powell JR (2003) Genetic divergence, phylogeography and conservation units of giant tortoises from Santa Cruz and Pinzo´n, Gala´pagos Islands. Conserv Genet 4:31–46. 25. Hille SM, Nesje M, Segelbacher G (2003) Genetic structure of kestrel
populations and colonization of the Cape Verde archipelago. Mol Ecol 12:2145–2151.
26. James FC (1983) Environmental component of morphological variation in birds. Science 221:184–186.
27. Conover DO, Schultz ET (1995) Phenotypic similarity and the evolutionary significance of countergradient variation. Trends Ecol Evol 10:248–252. 28. McNeil JN, Laforge M, Be´dard M, Cusson M (1996) Juvenile hormone
production and sexual maturation in the true armyworm, Pseudaletia unipunctata (Haw.) (Lepidoptera: Noctuidae): a comparison of migratory and non-migratory populations. Arch Insect Biochem Physiol 32:575–584.
29. McNeil JN, Miller D, Laforge M, Cusson M (2000) Dynamics of juvenile hormone biosynthesis, degradation and titers in females of the true armyworm: a comparison on migratory and non-migratory populations. Physiol Ent 25:103–111.
30. Mayr E (1942) Systematics and the Origin of Species, New York. 334p. 31. Paterson HEH (1993) Evolution and the recognition concept of species. The
Johns Hopkins University Press. 234p.
32. Grant BR, Grant PR (1996) Cultural inheritance of song and its role in the evolution of Darwin’s finches. Evolution 50:2471–2487.
33. Ayasse M, Paxton RJ, Tengo J (2001) Mating behavior and chemical communication in the order hymenoptera. Annu Rev Entomol 46:31–78. 34. Kirkpatrick M, Ravigne V (2002) Speciation by natural and sexual selection:
Models and experiments. Am Nat 159:S22–S35.
35. Gee JM (2005) IEG and behavioral response to conspecific and heterospecific calls in hybridizing avian species, California and Gambel’s quail. Integr Comp Biol 45:1000–1000.
36. Andersson M (1994) Sexual selection. Princeton University Press, Princeton, USA. 624p.
37. Wyatt TD (2003) Pheromones and animal behaviour: communication by smell and taste. Cambridge University Press, Cambridge, UK. 408p.
38. Loftus-Hills JJ, Littlejohn MJ (1992) Reinforcement and reproductive character displacement in Gastrophryne carolinensis and G. olivacea (Anura: Microhylidae): a reexamination. Evolution 46:896–906.
39. Symonds MRE, Moussalli A, Elgar MA (2009). The evolution of sex pheromones in an ecologically diverse genus of flies. Biol J Linn Soc 97:594– 603.
40. Stowe MK, Turlings TCJ, Loughrin JH, Lewis WJ, Tumlinson JH (1995) The chemistry of eavesdropping, alarm, and deceit. P Natl Acad Sci USA 92:23–28. 41. Hsieh H-Y, Liere H, Soto EJ, Perfecto I (2012) Cascading trait-mediated
interactions induced by ant pheromones. Eco Evo 2:2181–2191.
42. Me´dail F, Que´zel P (1997) Hot-spot analysis for conservation in the Mediterranean Basin. Ann Mo Bot Gard 84:112–127.
43. Thompson JD (2005) Plant evolution in the Mediterranean. Oxford University Press, New York, NY. 308p.
44. Jeanmonod D, Gamisans J (2007) Flora Corsica. Edisud, Aix-en-Provence. 920p.
45. Blondel J, Aronson J, Bodiou JY, Boeuf G (2010) The Mediterranean region: biological diversity in space and time. Oxford University Press, New York, NY. 392p.
46. Grill A, Casula P, Lecis R, Menken S (2007) Endemism in Sardinia in phylogeography of Southern European refugia. Pp. 273–296. Phylogeography in Southern European refugia: evolutionary perspectives on the origins and conservation of European Biodiversity. Springer Verlag, Dordrecht. 47. Me´dail F, Diadema K (2009) Glacial refugia influence plant diversity patterns
in the Mediterranean Basin. J Biogeogr 36:1333–1345.
48. Rasmont P, Adamski A (1996) Les Bourdons de la Corse (Hymenoptera, Apoidea, Bombinae). N Faun Gembloux 31:1–87.
49. Bossio A, Cornamusini G, Ferrandini J, Ferrandini M, Foresi LM, et al. (2000) Dinamica dal Neogene al Quaternario della Corsica orientale e della Toscana. Pp. 87–95. Progetto interreg II Toscana–Corsica 1997–1999. Strumia, F. (Ed.). Pisa: Edizioni ETS, Pisa.
50. Williams PH (1998) An annotated checklist of bumble bees with an analysis of patterns of description (Hymenoptera: Apidae, Bombini). Bull br Mus nat Hist Entomol 67:79–152.
51. Popov VB (1931) Zur Kenntnis der pala¨arktischen Schmarotzerhummeln (Psithyrus Lep.). Eos 7:131–209.
52. Rasmont P, Coppe´e A, Michez D, De Meulemeester T (2008) An overview of the Bombus terrestris (L. 1758) subspecies (Hymenoptera: Apidae). Ann Soc Entomol Fr 44:243–250.
53. Radoszkowski O (1884) Re´vision des armures copulatrices des maˆles du genre Bombus. Bull. Moscow Soc. Naturalists 59:51–92.
54. Friese H, Wagner H (1904) U¨ ber die Hummeln als zeugen natu¨rlicher Formenbildung. Zool Jahrb Allg Zool, Supplement (Festschrift Weismann) 7:551–570.
55. Vogt O (1909) Studien u¨ber das Artproblem. 1. Mitteilung. U¨ ber das Variieren der Hummeln. 1. Teil. Sitzungsberichte der Gesellschaft naturforschender Freunde zu Berlin 1909:28–84.
56. Coppe´e A (2010) Bombus terrestris (L. 1758): A complex species or a species complex? - Intraspecific pheromonal and genetic variations of Bombus terrestris (L.), Impacts on the speciation. 177p. Laboratoire de Zoologie. Universite´ de Mons, Mons.
57. Estoup A, Solignac M, Cornuet J-M, Goudet J, Scholl A (1996) Genetic differentiation of continental and island populations of Bombus terrestris (Hymenoptera: Apidae) in Europe. Mol Ecol5:19–31.
58. Jonghe de R (1986) Crossing experiments with Bombus terrestris terrestris (LINNAEUS, 1758) and Bombus terrestris xanthopus KRICHBAUMER, 1870 and some notes on diapause and nosemose (Hymenoptera : Apoidea). Phegea 14:19–23.
59. Ferton C (1901) Les Hyme´nopte`res de Corse (Apiaires, Sphe´gides, Pompilides et Vespides). Comptes-rendus de I’A.F.A.S., Congre`s d’Ajaccio 1901. 60. Baer B (2003) Bumblebees as model organisms to study male sexual selection in
social insects. Behav Ecol Sociobiol 54:521–533.
61. Bergstro¨m G, Svensson BG, Appelgren M, Groth I (1981) Complexity of bumble bee marking pheromones: biochemical, ecological and systematical interpretations. Syst Assoc Spec Vol 19:175–183.
62. Goulson D (2003) Bumblebees: their behaviour and ecology. Oxford University Press, Oxford, UK. 254p.
63. Kullenberg B, Bergstro¨m G, Bringer B, Carlberg B, Cederberg B (1973) Observations on Scent Marking by Bombus Latr. and Psithyrus Lep. Males (Hym., Apidae) and Localization of Site of Production of the Secretion. Zoon Suppl. 1:23–30.
64. Krieger GM, Duchateau M-J, Van Doorn A, Ibarra F, Francke W, et al. (2006) Identification of queen sex pheromone components of the bumblebee Bombus terrestris. J Chem Ecol32:453–471.
65. Urbanova´ K, Valterova´ I, Hovorka O, Kindl J (2001) Chemotaxonomical characterisation of males of Bombus lucorum (Hymenoptera: Apidae) collected in the Czech Republic. Eur J Entomol 98:111–115.
66. Terzo M, Urbanova´ K, Valterova´ I, Rasmont P (2005) Intra and interspecific variability of the cephalic labial glands’ secretions in male bumblebees: the case of Bombus (Thoracobombus) ruderarius and B. (Thoracobombus) sylvarum Hymenop-tera, Apidae. Apidologie 36:85–96.
67. Zˇ a´cek P, Kalinova´ B, Sˇobotnı´k J, Hovorka O, Pta´cek V, et al. (2009) Comparison of Age-dependent Quantitative Changes in the Male Labial Gland Secretion of Bombus terrestris and Bombus lucorum. J Chem Ecol 35:698–705. 68. Bergman P (1997) Chemical communication in bumblebee premating behaviour. Pp. 26. Department of Chemical Ecology. Go¨teborg University, Go¨teborg.
69. Zˇ a´cek P, Prchalova´-Horna´kov D, Tykva R, Kindl J, Vogel H, et al. (2013) De Novo Biosynthesis of Sexual Pheromone in the Labial Gland of Bumblebee Males. Chem Bio Chem 14:361–371.
70. De Meulemeester T, Gerbaux P, Boulvin M, Coppe´e A, Rasmont P (2011) A simplified protocol for bumble bee species identification by cephalic secretion analysis. Insect Soc 58:227–236.
71. Pedersen BV (2002) European bumblebees (Hymenoptera: Bombini) -Phylogenetic relationships inferred from DNA sequences. Insect Syst Evol 33:361–386.
72. Cameron SA, Hines HM, Williams PH (2007) A comprehensive phylogeny of the bumble bees (Bombus). Biol J Linn Soc 91:161–188.
73. Lecocq T, Lhomme P, Michez D, Dellicour S, Valterova´ I, et al. (2011) Molecular and chemical characters to evaluate species status of two cuckoo bumblebees: Bombus barbutellus and Bombus maxillosus (Hymenoptera, Apidae, Bombini). Syst Entomol 36:453–469.
74. Danforth BN (1999) Phylogeny of the bee genus Lasioglossum (Hymenoptera: Halictidae) based on mitochondrial COI sequence data. Syst Entomol 24:377– 393.
75. Simon C, Frati F, Beckenbach A, Crespi B, Liu H, et al. (1994) Evolution, weighting, and phylogenetic utility of mitochondrial gene sequences and a compilation of conserved polymerase chain reaction primers. Ann Entomol Soc Am 87:652–701.
76. Hines HM, Cameron SA, Williams PH (2006) Molecular phylogeny of the bumble bee subgenus Pyrobombus (Hymenoptera : Apidae : Bombus) with insights into gene utility for lower-level analysis. Invertebr Syst 20:289–303. 77. Cook JM, Crozier RH (1995) Sex determination and population biology in the
Hymenoptera. TREE 10:281–286.
78. Zhang Z, Schwartz S, Wagner L, Miller W (2000) A greedy algorithm for aligning DNA sequences. J Comput Biol 7:203–214.
79. Katoh K, Misawa K, Kuma K-I, Miyata T (2002) MAFFT: A novel method for rapid multiple sequence alignment based on fast Fourier transform. Nucleic Acids Res 30:3059–3066.
80. Maddison W, Maddison D (2007) Mesquite: A Modular System for Evolutionary Analysis.
81. Swofford DL (2001) PAUP*. Phylogenetic Analysis Using Parsimony (*and Other Methods). Sinauer Associates, Sunderland, Massachusetts.
82. Farris JM, Ka¨llersjo M, Kulge AG, Bult AC (1994) Testing significance of incongruence. Cladistics 10:315–319.
83. Williams PH (1985) A preliminary cladistic investigation of relationships among the bumble bees (Hymenoptera, Apidae). Syst Entomol 10:239–255. 84. Kawakita A, Sota T, Ito M, Ascher JS, Tanaka H, et al. (2004) Phylogeny,
historical biogeography, and character evolution in bumble bees (Bombus: Apidae) based on simultaneous analysis of three nuclear gene sequences. Mol Phylogenet Evol 31:799–804.
85. Felsenstein J (1985) Phylogenies and the comparative method. The Am Nat 125:1–15.
86. Zwickl DJ (2006) Genetic algorithm approaches for the phylogenetic analysis of large biological sequence datasets under the maximum likelihood criteria. The University of Texas at Austin, Austin, Texas.
87. Posada D (2008) jModelTest: Phylogenetic model averaging. Mol Biol Evol 25:1253–1256.
88. Hurvich CM, Tsai C-L (1989) Regression and time series model selection in small samples. Biometrika 76:297–307.
89. Hillis DM, Bull JJ (1993) An empirical test of bootstrapping as a method for assessing confidence in phylogenetic analysis. Syst Biol 42:182–192. 90. Ronquist F, Huelsenbeck JP (2003) MrBayes 3: Bayesian phylogenetic
inference under mixed models. Bioinformatics 19:1572–1574.
91. Huelsenbeck JP, Rannala B (2004) Frequentist properties of bayesian posterior probabilities of phylogenetic trees under simple and complex substitution models. Syst Biol 53:904–913.
92. Rambaut A, Drummond A (2007) Tracer.
93. Wilcox TP, Zwickl DJ, Heath TA, Hillis DM (2002) Phylogenetic relationships of the dwarf boas and a comparison of Bayesian and bootstrap measures of phylogenetic support. Mol Phylogenet Evol 25:361–371.
94. Bandelt H-J, Forster P, Ro¨hl A (1999) Median-joining networks for inferring intraspecific phylogenies. Mol Biol Evol 16:37–48.
95. Excoffier L, Smouse PE, Quattro JM (1992) Analysis of molecular variance inferred from metric distances among DNA haplotypes: Application to human mitochondrial DNA restriction data. Genetics 131:479–491.
96. Excoffier L, Lischer HEL (2010) Arlequin suite ver 3.5: A new series of programs to perform population genetics analyses under Linux and Windows. Mol Ecol Resour 10:564–567.
97. Wright S (1951) The genetical structure of populations. Ann Eugenics 15:323– 354.
98. Nei M (1987) Molecular evolutionary genetics. Columbia University Press, New York. 512p.
99. Nei M, Tajima F (1983) Maximum likelihood estimation of the number of nucleotide substitutions from restriction sites data. Genetics 105:207–217. 100. Rozas J, Rozas R (1997) DnaSP version 2.0: A novel software package for
extensive molecular population genetics analysis. Comput Appl Biosci 13:307– 311.
101. Terzo M, Valterova´ I, Rasmont P (2007) Atypical secretions of the male cephalic labial glands in bumblebees: The case of Bombus (Rhodobombus) mesomelas Gerstaecker(Hymenoptera, Apidae). Chem Biodivers 4:1466–1471. 102. R Development Core Team (2012) R: A language and environment for statistical computing. R Foundation for Statistical Computing, Vienna, Austria. 103. Paradis E, Claude J, Strimmer K (2004) APE: Analyses of phylogenetics and
evolution in R language. Bioinformatics 20:289–290.
104. Rasmont P, Terzo M, Aytekin AM, Hines H, Urbanova´ K, et al. (2005) Cephalic secretions of the bumblebee subgenus Sibiricobombus Vogt suggest Bombus niveatus Kriechbaumer and Bombus vorticosus Gerstaecker are conspecific (Hymenoptera, Apidae, Bombus). Apidologie 36:571–584.
105. Suzuki R, Shimodaira H (2011) Pvclust: Hierarchical Clustering with P-Values via Multiscale Bootstrap Resampling. R package version 1.2-2.
106. Oksanen JF, Blanchet G, Kindt R, Legendre P, Minchin PR, et al. (2011) Vegan: Community Ecology Package. R package version 2.0-2.
107. Anderson MJ (2006) Distance-based tests for homogeneity of multivariate dispersions. Biometrics 62:245–253.