For Peer Review Only
Normative Data for Phonemic and Semantic Verbal Fluency Test in the Adult French-Quebec Population and Validation
Study in Alzheimer's Disease and Depression
Journal: The Clinical Neuropsychologist Manuscript ID TCN-OA 16-34.R2
Manuscript Type: Original Article Date Submitted by the Author: n/a
Complete List of Authors: St-Hilaire, Alexandre; Universite Laval Hudon, Carol; Universite Laval
Vallet, Guillaume; CR Institut universitaire de geriatrie de Montreal Bherer, Louis; Concordia University
Lussier, Maxime; Universite du Quebec a Montreal Gagnon, Jean-François; Universite du Quebec a Montreal Simard, Martine; Universite Laval
Gosselin, Nadia; Universite de Montreal
Escudier, Frédérique; Universite du Quebec a Montreal Rouleau, Isabelle; Universite du Quebec a Montreal Macoir, Joël; Universite Laval
Keywords: Norms, Verbal Fluency, Alzheimer's disease, Depression, Diagnostic Validity
For Peer Review Only
Normative Data for Phonemic and Semantic Verbal Fluency Test
in the Adult French-Quebec Population and Validation Study in Alzheimer’s
Disease and Depression
Alexandre St-Hilaire
1, Carol Hudon
1, Guillaume T. Vallet
2, Louis Bherer
3,
Maxime Lussier
4, Jean-François Gagnon
4, Martine Simard
1, Nadia Gosselin
5,
Frédérique Escudier
4, Isabelle Rouleau
4, & Joël Macoir
61
École de psychologie, Université Laval, Québec, QC, Canada
2
Centre de Recherche de l'Institut Universitaire de Gériatrie de Montréal, Université de Montréal, Montréal, QC, Canada
3
Department of Psychology, Concordia University, Montreal, QC, Canada
4
Département de psychologie, Université du Québec à Montréal, Montréal, QC, Canada
5
Département de psychologie, Université de Montréal, Montréal, QC, Canada
6
Département de réadaptation, Université Laval, Québec, QC, Canada
Corresponding author: Joël Macoir; Département de réadaptation, Pavillon Ferdinand-Vandry, Université Laval; 1050, avenue de la Médecine, Local 4295; Québec, QC, Canada, G1V 0A6; email: joel.macoir@fmed.ulaval.ca
ASH: alexandre.st-hilaire.1@ulaval.ca; CH: carol.hudon@psy.ulaval.ca;
GTV: gtvallet@gmail.com; LB: louis.bherer@concordia.ca; ML: lussier.maxime@hotmail.com; JFG: gagnon.jean-francois.2@uqam.ca; MS: martine.simard@psy.ulaval.ca;
NG: nadia.gosselin@umontreal.ca; FE: frederique.escudier@gmail.com; IR: rouleau.isabelle@uqam.ca; JM: joel.macoir@fmed.ulaval.ca
URL: http://mc.manuscriptcentral.com/ntcn 3 4 5 6 7 8 9 10 11 12 13 14 15 16 17 18 19 20 21 22 23 24 25 26 27 28 29 30 31 32 33 34 35 36 37 38 39 40 41 42 43 44 45 46 47 48 49 50 51 52 53 54 55 56 57 58 59 60
For Peer Review Only
Normative Data for Phonemic and Semantic Verbal Fluency Test
in the Adult French-Quebec Population and Validation Study in Alzheimer’s
Disease and Depression
Abstract
Objective: Verbal fluency tasks are principally used to assess lexical access and have shown usefulness for differential diagnosis. The purpose of Study 1 was to provide normative data in the adult French-Quebec population (Canada) for semantic verbal fluency (animals), for two sets of phonemic verbal fluency (TNP and PFL), and for letter P alone (60 seconds per
category/letter). The objectives of Study 2 were to establish the diagnostic and predictive validity of the present tasks and normative data in Alzheimer’s disease (AD) and major depressive
episode (MDE). Method: The normative sample consisted of 932 participants aged 19 to 91 years. Based on multiple linear regressions, equations to calculate Z-scores were provided. To assess validity, performance of 62 healthy participants was compared to 62 participants with AD and 41 with MDE aged over 50. Results: Age and education, but not gender, predicted
performance on each verbal fluency task. Healthy adults aged 50 and younger had a better
performance on semantic than phonemic verbal fluency. In comparison to MDE, AD participants had lower performance on animals and TNP, but not on letter P. Ninety percent of people with a Z-score ≤ -1.50 on semantic verbal fluency had AD and the global accuracy was 76.6%. Test-retest reliability over one year was high for both animals (r = .711) and TNP (r = .790) in healthy older participants, but dropped for animals in people with AD (r = .493). Conclusions: These data will strengthen accurate detection of verbal fluency deficits in French-Quebec adults.
Key words: Norms; Verbal Fluency; Alzheimer’s Disease; Depression; Diagnostic Validity. Word count: 7897 (including in the text authors’ names)
URL: http://mc.manuscriptcentral.com/ntcn 3 4 5 6 7 8 9 10 11 12 13 14 15 16 17 18 19 20 21 22 23 24 25 26 27 28 29 30 31 32 33 34 35 36 37 38 39 40 41 42 43 44 45 46 47 48 49 50 51 52 53 54 55 56 57 58 59 60
For Peer Review Only
Introduction
Verbal fluency tests are commonly used to assess lexical access from orthographic and phonemic networks (Henry, Crawford, & Phillips, 2004; Stolwyk, Bannirchelvam, Kraan, & Simpson, 2015). During a verbal fluency test, the subject is required to generate as many words as possible within a limited amount of time. There are typically two types of verbal fluency tests, the
phonemic condition where subjects must produce words beginning with a specific letter (e.g., letter P), and the semantic condition where subjects must generate words from a given category (e.g., animals). While both tasks impose comparable demands upon executive processes (Henry, Crawford, & Phillips, 2004), it is generally accepted that phonemic fluency is associated with the generation of a lexical strategy (sustained by executive functions) that guide the search of words in the mental lexicon (e.g., searching words starting with ‘pa’, then ‘pi’, etc. in a task requiring the production of words starting with ‘p’). In semantic verbal fluency tests, the activation of lexical representations is rather performed through an explicit semantic strategy that allows searching words corresponding to subcategories of concepts. Therefore, both tasks of verbal fluency require, at various levels, the integrity of lexical and semantic representations, as well as executive functions (Henry et al., 2004). A systematic review of fMRI studies of verbal fluency found that performance on phonemic and semantic verbal fluency depends partially on distinct neural circuits, with posterior regions of the left inferior frontal gyrus more involved in
phonemic fluency, and increased activation of the more anterior regions of the frontal lobes and posterior regions of temporal cortex for semantic fluency (Birn et al., 2010; Costafreda et al., 2006).
Verbal fluency tasks have been demonstrated to be sensitive to a variety of
neurocognitive conditions and are useful for differential diagnosis. It has been hypothesized that a larger deficit on semantic verbal fluency task generally reflects a degradation of the semantic store, an ineffective access mechanism to stored information, or disorganised/weak semantic associations (Henry et al., 2004; Tyburski, Sokolowski, Chec, Pelka-Wysiecka, & Samochowiec, 2015). Prior studies reported that semantic verbal fluency may be more impaired than phonemic verbal fluency in older patients with Alzheimer’s disease (AD) (Henry et al., 2004), as well as in the presence of amnestic mild cognitive impairment (Lonie et al., 2009; Teng et al., 2013), semantic dementia (Laisney et al., 2009), and in adolescents and young adults with schizophrenia
URL: http://mc.manuscriptcentral.com/ntcn 3 4 5 6 7 8 9 10 11 12 13 14 15 16 17 18 19 20 21 22 23 24 25 26 27 28 29 30 31 32 33 34 35 36 37 38 39 40 41 42 43 44 45 46 47 48 49 50 51 52 53 54 55 56 57 58 59 60
For Peer Review Only
(Henry & Crawford, 2005b; Szoke et al., 2008; Tyburski et al., 2015) or with ultra-high risk of psychosis (Magaud et al., 2010), although this profile can vary with aging and the prominence of negative versus positive symptoms (Tyburski et al., 2015). A meta-analysis showed that
semantic verbal fluency can also be more deficient than phonemic verbal fluency in the context of Parkinson’s disease with or without dementia, although to a lesser extent than in AD (Henry & Crawford, 2004c). Moreover, regarding major depressive episode (MDE) (Henry & Crawford, 2005a), obsessive compulsive disorder (Henry, 2006), multiple sclerosis (Henry & Beatty, 2006), and Huntington’s disease (Henry, Crawford, & Phillips, 2005), performance reported in meta-analyses is often as deficient in semantic as in phonemic verbal fluency. In these four latter diseases, verbal fluency deficits would be explained mostly by a generalized cognitive impairment or slowness in processing speed rather than by a dysexecutive syndrome (Henry, 2006; Henry & Crawford, 2005a; Henry et al., 2005). Besides, participants with focal frontal injuries (Henry & Crawford, 2004a) and traumatic brain injury (Henry & Crawford, 2004b) are also similarly impaired on tests of semantic and phonemic verbal fluency, but these deficits would be equally explained by both slowness of processing speed and by a dysexecutive syndrome. Moderate-to-severe traumatic brain injury is associated with more impairment on phonemic than semantic condition in adults younger than 40 years likely because of a diminished ability to organize the lexical search (i.e., words clustering by first letter or first sound) (Cralidis & Lundgren, 2014).
Previous normative studies conducted in North America evaluated the impact of
sociodemographic variables such as age, education, and gender on verbal fluency performance in adults. Most studies supported the contribution of education and age on both phonemic and semantic verbal fluency performance (Delis, Kaplan, & Kramer, 2001; Fine, Kramer, Lui, & Yaffe, 2012; Gladsjo et al., 1999; Ivnik, Malec, Smith, Tangalos, & Petersen, 1996; Loonstra, Tarlow, & Sellers, 2001; Lucas, Ivnik, Smith, Bohac, Tangalos, Graff-Radford, et al., 1998; Marcopulos, McLain, & Giuliano, 1997; Mitchell et al., 2013; Tombaugh, Kozak, & Rees, 1999; Troyer, 2000). More precisely, higher levels of education are associated with better fluency scores and younger individuals perform better than older individuals on verbal fluency tasks. However, these normative studies found negligible or no effect of gender on verbal fluency performance. Some studies also showed that language and cultural differences have an impact on verbal fluency scores and some hypotheses were raised to explain this discrepancy, such as
URL: http://mc.manuscriptcentral.com/ntcn 3 4 5 6 7 8 9 10 11 12 13 14 15 16 17 18 19 20 21 22 23 24 25 26 27 28 29 30 31 32 33 34 35 36 37 38 39 40 41 42 43 44 45 46 47 48 49 50 51 52 53 54 55 56 57 58 59 60
For Peer Review Only
differences in sociocultural exposition to certain categories of concepts (Acevedo et al., 2000; Gladsjo et al., 1999; Rosselli et al., 2002; Steenhuis & Ostbye, 1995) or in the lexical frequency of words beginning with the given letter in a particular language (Loewenstein, Arguelles, Arguelles, & Linn-Fuentes, 1994).
Clinicians working in French-speaking Quebec generally use four sets of normative data for verbal fluency tests. The first set includes a large sample with standardized normative data covering children and adults aged 8 to 89 years (Delis et al., 2001). Despite this, these normative data were derived from English U.S. population and do not control for the effect of education, which is a limitation. The three other sets of normative data are derived from French-Quebec individuals. However, normative sample sizes are small and presented in the form of means and standard deviations only (Béland & Lecours, 1990; Canadian Study of Health and Aging
Working Group, 1994; Fontaine & Joubert, 2010), which could lead to limitations, notably for extreme values because of the lack of normal distribution. Other sets of normative data are available in French, but adapted to people of France (Antérion, Honore, Cougny, Grosmaitre, & Laurent, 2001; Giulioli et al., 2016; Godefroy, 2008; Lechevallier-Michel, Fabrigoule, Lafont, Letenneur, & Dartigues, 2004; Raoux, Le Goff, Auriacombe, Dartigues, & Amieva, 2010) and Belgium (Cardebat, Doyon, Puel, Goulet, & Joanette, 1990). Moreover, most of them are limited to elders (Antérion et al., 2001; Giulioli et al., 2016; Lechevallier-Michel et al., 2004; Raoux et al., 2010). Although Quebec French shares many linguistic features with French from France, Belgium or Switzerland, particularly in written language, there exist significant differences in spoken language, not only with regards to articulation and prosody, but also at the lexical level. The lexical differences particularly concern the frequency of words, a psycholinguistic parameter known to drastically influence the access to words in the mental lexicon (Desrochers &
Bergeron, 2000). Therefore, the development of normative data adapted to a given population is of particular importance, especially in language-based tests such as verbal fluency.
In regard of the limitations stated above, normative data were derived for verbal fluency tests, tailored for a large sample of French-speaking adult Quebecers (Study 1). Moreover, in order to accurately discriminate between normal and pathological cognitive functioning in this population, we aimed to examine the diagnostic validity of these tests and the predictive validity of our normative data as well as the test-retest reliability over one year (Study 2).
URL: http://mc.manuscriptcentral.com/ntcn 3 4 5 6 7 8 9 10 11 12 13 14 15 16 17 18 19 20 21 22 23 24 25 26 27 28 29 30 31 32 33 34 35 36 37 38 39 40 41 42 43 44 45 46 47 48 49 50 51 52 53 54 55 56 57 58 59 60
For Peer Review Only
STUDY 1: NORMATIVE DATA
The purpose of Study 1 was to provide normative data for two sets of phonemic verbal fluency tasks widely used in Quebec: TNP and PFL. Letters TNP were used in the Canadian Study of Health and Aging (1994) and the frequency of words beginning with PFL is similar to the frequency of words beginning with CFL, which are very often used in English (Benton, Hamsher, & Sivan, 1994; Lezak, Howieson, Bigler, & Tranel, 2012). Normative data are also presented for letter P alone in order to provide a brief screening of phonemic capacity that could be used in a busy clinical facility. This letter was chosen because it belongs to the two triads of letters, thus maximising the number of participants. For semantic verbal fluency, the selected category was that of animals, because it is the most common category used by Quebec clinicians. It is also a category that is thought to lead to the production of higher number of words compared to categories such as pieces of clothing.
Method
Participants
Researchers across the province of Quebec (Canada) were invited to share anonymized data from French-speaking healthy volunteers whose mother tongue was French and who had completed verbal fluency tests as part of other research studies approved by local Research Ethics Boards. A little more than 78% of the Quebec population have French for mother tongue (Government of Quebec, 2016). Participants were recruited in Montreal (n = 595; 63.8%) and Quebec City (n = 337; 36.2%) areas. We had consent to use data presented in this article for secondary analyses, as stipulated in the information and consent documentation given to participants of the primary studies.
All participants scored within normal range on the Mini-Mental State Examination (MMSE ≥ 26) (Folstein, Folstein, & McHugh, 1975), the Montreal Cognitive Assessment (MoCA ≥ 26) (Nasreddine et al., 2005) or the Dementia Rating Scale (Z-score adjusted for age and education higher than -1 standard deviation (SD) on the DRS-2) (Jurica, Leitten, & Mattis, 2001; Lavoie et al., 2013; Lucas, Ivnik, Smith, Bohac, Tangalos, Kokmen, et al., 1998),
indicating normal cognition. Participants had no significant depressive symptomatology based on
URL: http://mc.manuscriptcentral.com/ntcn 3 4 5 6 7 8 9 10 11 12 13 14 15 16 17 18 19 20 21 22 23 24 25 26 27 28 29 30 31 32 33 34 35 36 37 38 39 40 41 42 43 44 45 46 47 48 49 50 51 52 53 54 55 56 57 58 59 60
For Peer Review Only
screening results from the Geriatric Depression Scale (GDS) (Yesavage, 1988), the Beck Depression Inventory second edition (BDI-II) (Beck, Steer, & Brown, 1996), or the Hamilton Depression Rating Scale (HDRS) (Hamilton, 1960, 1967). Cut-offs were ≤ 10 for the 30-item GDS, ≤ 1 for the 4-item GDS, ≤ 10 for the BDI-II, and ≤ 13 for the HDRS. All participants self-reported good mental and physical health (i.e., no history of neurological disease, current untreated psychiatric illness, traumatic brain injury, and untreated medical condition that could interfere with cognitive performance).
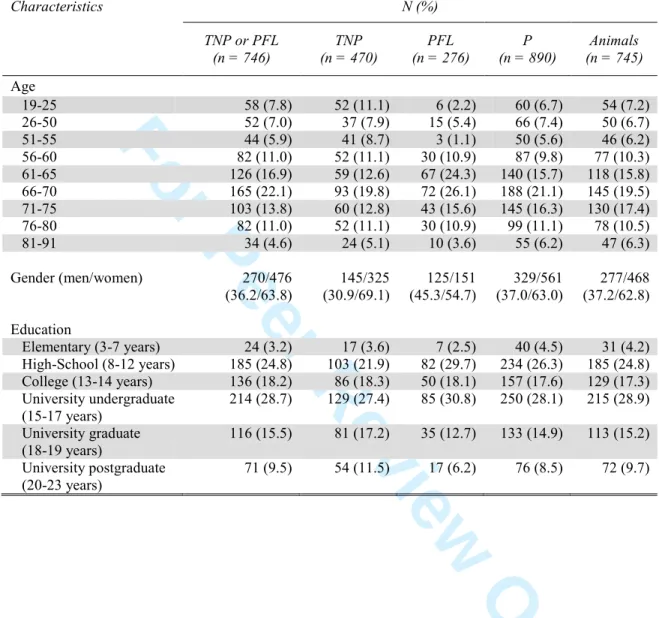
The initial sample was composed of 994 participants. For the clinical validation of the normative data, 62 were withdrawn (see Study 2). The final normative sample consisted of 932 community-dwelling participants (593 women and 339 men), aged between 19 and 91 years (mean age = 63.0 years; SD = 15.9) and having between 3 and 23 years of formal education (mean education level = 14.6 years; SD = 3.8). Highly educated men and women of all ages were overrepresented in our sample compared with actual Quebec demographics (Institut de la statistique du Québec, 2006) (Table 1). Also, people aged 65 years and older were
overrepresented in our sample (60.1% vs. 15.7% in Quebec) (Michaud & Francoeur, 2012), as well as women (63.6% vs. 50.3% in Quebec) (Government of Canada, 2015).
Materials and procedure
Verbatim instructions for phonemic and semantic verbal fluency are presented in Appendix. Participants were asked to tell as many words as possible that begin with a letter given by the examiner (T, N, P or P, F, L). The letters were given one after the other and there was no interference task between each letter. Participants could give words which have the same root, provided that they refer to distinct concepts such as ‘table – table’, ‘tablet – tablette’,
‘blackboard – tableau’ (thus, for example, ‘snow – neige (noun)’, ‘snow – neiger (action verb)’ would only be credited one point because they do not refer to distinct concepts). Anglicisms were accepted (i.e., words that are typically borrowed from English into French such as ‘toaster’, ‘peanut’ and ‘popcorn’). Set-loss errors were defined as followed: (1) proper names (people, place, company, holiday, planet); (2) morphologically inflected forms of a verb (e.g., ‘take –
prendre’, ‘took – pris’), a noun (e.g., ‘prince – prince, masc. form and princess – princesse’,
fem. form), or an adjective (e.g., ‘petit, masc. form – petite, fem. form’) previously given on the
URL: http://mc.manuscriptcentral.com/ntcn 3 4 5 6 7 8 9 10 11 12 13 14 15 16 17 18 19 20 21 22 23 24 25 26 27 28 29 30 31 32 33 34 35 36 37 38 39 40 41 42 43 44 45 46 47 48 49 50 51 52 53 54 55 56 57 58 59 60
For Peer Review Only
trial; (3) non-words; (4) words not starting with the target letter. In the case of homophones (i.e., words with similar pronunciations) such as ‘pair and pare’ in English or ‘porc and port’ in French, the second response was scored as a repetition error unless the participant gave spontaneously the meaning of the two words or spelled both words.
Phonemic verbal fluency was immediately followed by semantic verbal fluency
(animals). Participants were told to name as many animals as they could, no matter what letter they start with. Semantic gender expressed by variants of animal nouns, as well as offspring names, were accepted, provided that they were expressed with completely different names (e.g., ‘bull – taureau’, ‘cow – vache’, ‘veal – veau’ were all accepted), rather than by derivation process (e.g., in the following sequence, ‘lion’ only received one point: ‘lion – lion’, ‘lioness –
lionne’, ‘lion cub – lionceau’). Subcategories labels ‘insect – insecte’, ‘bird – oiseau’, and ‘fish – poisson’ were accepted. However, if the participant gave for example the words ‘insect,
dragonfly, and ladybug’, the two items belonging to the subcategory ‘insect’ should be each credited one point, but not the word ‘insect’, no matter whether the items follow or not the subcategory. If the examinee gave non-words or non-animals, these were considered as set-loss errors.
Sixty seconds were given for each letter and for the animal category. Responses were recorded verbatim. One point was allocated for each word given, except for repetition and set-loss errors. Participants were not interrupted during the task. The instructions were repeated as many times as necessary if the participant lost set (i.e., if the participant began to say words not belonging to the target letter or category such as ‘potato – patate, pear – poire, plum – prune, banana – banane, grape – raisin’ in the case of words belonging to letter P) or forgot what he was supposed to be doing.
Statistical Analyses
All dependent variables were normally distributed in the three fluency tasks (i.e. TNP or PFL, P, and animals). To identify the confounders influencing performance, a linear multiple regression analysis was performed for each dependent variable with age, education, and gender as
predictors. Because our participants performed better with PFL than with TNP (see results section), the type of triad (i.e. TNP or PFL) was also controlled for this dependent variable.
URL: http://mc.manuscriptcentral.com/ntcn 3 4 5 6 7 8 9 10 11 12 13 14 15 16 17 18 19 20 21 22 23 24 25 26 27 28 29 30 31 32 33 34 35 36 37 38 39 40 41 42 43 44 45 46 47 48 49 50 51 52 53 54 55 56 57 58 59 60
For Peer Review Only
Age and education were entered in the analyses as continuous variables, while gender was coded 0 for men and 1 for women. The type of triad was coded 0 for TNP and 1 for PFL. Interactions between predictors were tested. None of the interactions were significant so they were not retained in the final models.
Some patients may exhibit disproportionate impairment in semantic verbal fluency relative to phonemic verbal fluency, or vice versa. In order to highlight a significant difference between the two conditions, a contrast score was computed. This analysis was based on the same procedure described by Delis et al. (2001). First, the uncorrected raw scores for animals and TNP/PFL distributions were each converted into distributions of scaled scores. Second, in each participant the scaled scores for TNP were subtracted from the scaled scores for animals. Then, this distribution of scaled scores differences was again converted to a new distribution of scaled scores. Scaled scores are normally distributed and have a constant mean of 10 and a standard deviation of 3. A contrast Z-score corrected for age was then calculated from a linear regression (no significant effect of education). A Z-score under -1.65 (5th percentile) highlights significantly more difficulties in the semantic condition, while a Z-score higher than 1.65 means lower
performance in the phonemic condition over the semantic one. Paired t-tests were conducted to analyze the difference between the number of words generated in TNP/PFL vs animals
conditions, in terms of scaled scores, produced for each of the age groups presented in Table 2.
Visual and statistical analyses were conducted to verify the underlying assumptions of the regression models (normality of distributions and of residuals, homogeneity of variance,
linearity, multicollinearity and outliers using common criteria) (Tabachnick & Fidell, 2013). All statistical analyses were performed using SPSS software (version 21.0) with the alpha level set at .05.
Results
Table 2 illustrates the distribution of participants in the normative sample according to demographic variables for each test and condition. The letters used in this study were not equivalent in terms of difficulty. Letter P is the one for which the largest number of words was generated (mean = 15.6, SD = 4.6), followed by letter F (mean = 14.2, SD = 4.8), T
(mean = 13.8, SD = 4.1), L (mean = 11.0; SD = 4.5), and N (mean = 9.3, SD = 3.4). One should
URL: http://mc.manuscriptcentral.com/ntcn 3 4 5 6 7 8 9 10 11 12 13 14 15 16 17 18 19 20 21 22 23 24 25 26 27 28 29 30 31 32 33 34 35 36 37 38 39 40 41 42 43 44 45 46 47 48 49 50 51 52 53 54 55 56 57 58 59 60
For Peer Review Only
note that these distributions are probably influenced by the number of words available in French (P = 12,616; T = 6,759; F = 5,890; L = 3,296; N = 2,163; New & Pallier, 2001). As letters were not equivalent in terms of difficulty, one might wonder whether the use of letter P reflects
performance achieved by a participant when the triad is privileged. In fact, performance for letter P strongly correlated with performance for TNP (r = .866, p <.001) and PFL (r = .884, p <.001). In addition, 93.4% of participants who had a Z-score greater than or equal to -1.00 for letter P also had a Z-score greater than or equal to -1.00 for TNP or PFL. Moreover, the number of words generated with letter P was quite similar in both triads (means = 15.2 and 16.4 in the case of TNP and PFL, respectively), which indicates that the different position of letter P in the triads did not affect so much performance.
Table 3 illustrates the regression coefficients and intercepts for each task condition. A larger number of words was generated for PFL letters (mean = 41.2; SD = 12.8) in comparison with TNP letters (mean = 38.2; SD = 9.9), t(744) = -3.297, p = .001, d = 0.27. This effect has been taken into account in regression analyses.
Correlations were significant between phonemic verbal fluency (TNP or PFL) and education (r = .246; p < .001), age (r = -.182; p < .001), type of triad (i.e. TNP or PFL; r = .128;
p < .001), but not gender (rpb = .037; p = .306). Correlations for letter P were similar to those for TNP/PFL: education (r = .220; p < .001), age (r = -.206; p < .001), and gender (rpb = .026;
p = .433). With respect to semantic verbal fluency performance, correlations were significant
with age (r = -.527; p < .001) and education (r = .350; p < .001), but not with gender (rpb = .003;
p = .934). Since gender did not significantly correlate with any verbal fluency conditions, the
effect of this variable was not taken into account in the regression equations. The variables that were the most strongly associated with dependent variables were included first in the regression models.
The final model accounted for 10.5% of the variance of phonemic verbal fluency (TNP/PFL) and included education (∆R² = .061), age (∆R² = .015), and type of triad
(∆R² = .030), R² = .105, F(3, 742) = 29.100, p < .001. The final model for letter P accounted for 7.1% of the variance of performance (education: ∆R² = .048 and age: ∆R² = .022), R2 = .071,
F(2, 887) = 33.705, p < .001. The final model for semantic verbal fluency accounted for 32.4%
URL: http://mc.manuscriptcentral.com/ntcn 3 4 5 6 7 8 9 10 11 12 13 14 15 16 17 18 19 20 21 22 23 24 25 26 27 28 29 30 31 32 33 34 35 36 37 38 39 40 41 42 43 44 45 46 47 48 49 50 51 52 53 54 55 56 57 58 59 60
For Peer Review Only
of the variance of performance (age: ∆R² = .282 and education: ∆R² = .042), R2 = .324, F(2, 742),
p < .001.
Based on the results from the regression models, Table 4 reports equations to calculate Z-scores for each verbal fluency task, according to sociodemographic variables. In order to ease calculation of Z-scores based on the regression formulas, a Microsoft Excel® spreadsheet containing automatic formulas has been prepared. The file can be downloaded from the website of the journal (see Supplemental online material) or by writing to the corresponding author of the manuscript. Table 5 reports normative equation to calculate the standardized difference between animals and TNP/PFL conditions (contrast measure). Age was a significant predictor of this contrast measure and accounted for 13.7% of the variance, F(1, 594) = 94.567, p < .001. Type of triad, gender, and education level were not significant predictors.
When comparing distributions of scaled scores, we noticed that more words were
generated for animals over TNP/PFL in individuals aged between 19 and 25 (p < .001, d = 1.57), and those aged from 26 to 50 (p < .001, d = 0.68). However, the facilitating effect of the
semantic category for the younger adults was not found in all the other age groups presented in Table 2. Indeed, we found a trend for a better performance on TNP/PFL over animals in the group aged between 81 and 91 years (p = .100, d = 0.31). Similar results were found when we contrasted scaled scores for animals with letter P alone (p < .001, p = .008, and p = .075, for the three age ranges mentioned above, respectively).
Discussion
The main objective of Study 1 was to establish normative data for phonemic and semantic verbal fluency in a French-Quebec sample of adults aged 19 to 91 years. Linear multiple regressions were performed for each dependent variable with age, education, and gender as predictors. Results indicated that participants’ age and education level were independently associated with performance on both phonemic and semantic verbal fluency tasks. In both conditions, people with higher levels of education and those younger reached better fluency scores. Gender had no effect on performance in each condition. Overall, these results echoed those of previous
normative studies conducted in North America (Delis et al., 2001; Fine et al., 2012; Gladsjo et al., 1999; Ivnik et al., 1996; Loonstra et al., 2001; Lucas, Ivnik, Smith, Bohac, Tangalos,
Graff-URL: http://mc.manuscriptcentral.com/ntcn 3 4 5 6 7 8 9 10 11 12 13 14 15 16 17 18 19 20 21 22 23 24 25 26 27 28 29 30 31 32 33 34 35 36 37 38 39 40 41 42 43 44 45 46 47 48 49 50 51 52 53 54 55 56 57 58 59 60
For Peer Review Only
Radford, et al., 1998; Marcopulos et al., 1997; Mitchell et al., 2013; Tombaugh et al., 1999; Troyer, 2000). As also pointed out by Barry et al. (2008), our results showed that letters are not equivalent in terms of difficulty, so we also controlled for the effect of the type of triad (i.e., TNP or PFL) in phonemic verbal fluency performance.
Only age was a significant predictor of the contrast measure between animals and TNP/PFL scaled scores. A contrast score allows determining whether the semantic verbal fluency performance is significantly deficient in comparison to phonemic verbal fluency, or vice versa. It has been shown that people with AD may have a significantly lower performance on semantic verbal fluency than on phonemic verbal fluency when compared to cognitively healthy people (Henry et al., 2004). However, this finding does not represent a hard rule, since
individuals with dementia exhibit sometimes equivalent levels of impairment in both conditions (Henry et al., 2004). Moreover, people with AD often show weak performance on phonemic verbal fluency, because executive deficits are also a feature of the cognitive deterioration in AD (Amieva, Phillips, Della Sala, & Henry, 2004). Our contrast measure could therefore be
considered ‘normal’ because both conditions are much compromised. Thus, contrast measure must be interpreted with caution. One should note that a Z-score below -1.65 (5th percentile) indicates significantly worse performance on semantic verbal fluency while a Z-score over 1.65 instead indicates worse performance on phonemic verbal fluency.
We found a facilitating effect of the semantic condition over phonemic conditions only in healthy participants aged 19 to 50 years and the opposite trend for adults over 80 years. We can argue that in human language development, the number of animals known by a person rises faster than the lexicon and synonyms for other types of words, but more rapidly reaches a peak in adulthood and slightly decline through aging. Indeed, in normal aging longitudinal and cross-sectional studies found that semantic verbal fluency shows faster decline relative to phonemic verbal fluency and this pattern accelerates if AD shows up (Clark et al., 2009; Haugrud, Lanting, & Crossley, 2010). On the opposite, the lexicon for words in general and their synonyms seems to grow at least until the age of 70 (Hultsch, Hertzog, Dixon, & Small, 1999; Park et al., 2002; Park & Reuter-Lorenz, 2009). The faster decline found for semantic verbal fluency throughout aging probably explains why age remarkably explains greater variance of performance in this condition than phonemic fluency. According to Troyer, Moscovitch, and Winocur (1997), verbal
URL: http://mc.manuscriptcentral.com/ntcn 3 4 5 6 7 8 9 10 11 12 13 14 15 16 17 18 19 20 21 22 23 24 25 26 27 28 29 30 31 32 33 34 35 36 37 38 39 40 41 42 43 44 45 46 47 48 49 50 51 52 53 54 55 56 57 58 59 60
For Peer Review Only
fluency performance depends on the search for appropriate words, the shift from one and other (i.e. switching, which would rely on frontal lobes) and the production of words within categories (i.e. clustering, which would rely on temporal lobes). While phonemic verbal fluency is
correlated only with switching, semantic verbal fluency is correlated with both switching and clustering (Troyer et al., 1997). Thus, in regard to the differential age effect on the two fluency tasks, we could hypothesize that only the size of semantic clusters is slightly reduced in normal aging while in AD both the number of novel clusters and number of switches generated in the semantic verbal condition are reduced (Haugrud, Crossley, & Vrbancic, 2011).
Strengths and Limitations
Although the current study used an incidental sampling method, the normative data presented in this work were built from a large sample of adults and older adults living in the most populous areas of Quebec Province (Montreal and Quebec City). Clear rules have also been established for accepted or incorrect answers in order to strengthen inter-rater reliability in the case of
reassessment. However, greater variability in scores may be present in subsamples comprised of younger adults and low educated people since they were relatively small. Results should be interpreted with caution for these groups. Moreover, our sample did not comprise people aged 92 years and older. Thus, the application of regression formulas for people over this age should be interpreted with caution since it represents estimated scores. There were also few adults younger than 55 years old for the triad PFL compared to TNP or letter P. It might therefore be preferable to use the norms for TNP in adults younger than 55 years. Finally, the current sample was composed of more women than men, but since gender had not a significant effect on any task performance, the present results appear generalizable.
The use of a single category, as opposed to an average of three (e.g., animals, fruits, and vegetables), might be expected to yield a less reliable fluency score. However, as Acevedo et al. (2000) showed, in comparison with fruits or vegetables categories, animal fluency is not affected by gender and is less affected by the language of the participant. Thus, animal fluency may be the best task option when only one category is to be sampled (Acevedo et al., 2000).
The study used regression equations to calculate Z-scores for performance on verbal fluency tasks. This normative method has the advantage of better estimating the expected
URL: http://mc.manuscriptcentral.com/ntcn 3 4 5 6 7 8 9 10 11 12 13 14 15 16 17 18 19 20 21 22 23 24 25 26 27 28 29 30 31 32 33 34 35 36 37 38 39 40 41 42 43 44 45 46 47 48 49 50 51 52 53 54 55 56 57 58 59 60
For Peer Review Only
performance of a participant given his personal characteristics, instead of discrete norms formed by creating arbitrary age groups. In the latter case, the relative standing of an individual can change dramatically as they move from one age category to the other (Crawford & Howell, 1998). Furthermore, the basic statistical conditions for using regression-based norms were met in our large sample, providing confidence in the validity of our results. To illustrate the advantage of regression equations over means and standard deviations, let us imagine a 75-year-old-participant with 19 years of education, who generated 23 words for the triad TNP, 9 for letter P, and 12 for the animals. First, based on the regression equations from Table 4, the patient’s Z-scores would be -1.53, -1.59, and -1.67, respectively. These results appear to be indicative of impaired verbal fluency abilities (Z ≤ -1.50), no matter the condition. If the results of this participant were rather compared to normative data of the Canadian Study of Health and Aging (1994), his Z-scores would be -1.13 and -1.03 for TNP and animals, respectively (no data for letter P), a performance which, although weak, would be considered normal. The present data seem therefore to have a better sensitivity. In regards with cultural differences (e.g., French from Quebec vs France), we compared the same hypothetical patient’s Z-scores to those obtained with Raoux et al.’s (2010) normative data (percentiles). Using the latter normative data, although this 75-year-old-participant would reach a similar performance for animals (Z = -1.65; 5th percentile), his performance for letter P (no data for TNP) would be normal (Z = -0.67; 25th percentile). These examples underline the importance of using culturally driven normative data, especially in language-based tests such as verbal fluency.
The current normative data are advantageous since they take into account the effect of age and education level. However, since verbal fluency tasks do not only measure lexical access, it would have been interesting to control for the influence of other cognitive processes. Indeed, performance in verbal fluency is mediated by others cognitive processes in young and old healthy populations, such as speed of information processing (Elgamal, Roy, & Sharratt, 2011; Paula, Costa, Bertola, Miranda, & Malloy-Diniz, 2013; Stolwyk, Bannirchelvam, Kraan, & Simpson, 2015), executive functioning (e.g., organisation of information in terms of clusters of meaningfully related words, formulation of effective recall strategies) (Bolla, Lindgren,
Bonaccorsy, & Bleecker, 1990; Paula et al., 2013), and working memory (Shao, Janse, Visser, & Meyer, 2014; Stolwyk et al., 2015), although their contribution vary with aging and by condition. Verbal intelligence and creativity have also been shown as mediators of verbal fluency
URL: http://mc.manuscriptcentral.com/ntcn 3 4 5 6 7 8 9 10 11 12 13 14 15 16 17 18 19 20 21 22 23 24 25 26 27 28 29 30 31 32 33 34 35 36 37 38 39 40 41 42 43 44 45 46 47 48 49 50 51 52 53 54 55 56 57 58 59 60
For Peer Review Only
performance (Bolla et al., 1990; Hendrawan, 2013; Stolwyk et al., 2015), as well as better physical health which has been shown to slightly reduce the negative influence of low education on phonemic verbal fluency (Bergman & Almkvist, 2015). Future studies should then take into account the effect of those mediators, although these are not always available when data come from secondary analyses. French normative data for action verbal fluency could also be useful since they are thought to be more suitable to capture a deficit in executive functions than noun verbal fluency (Piatt, Fields, Paolo, & Troster, 2004).
STUDY 2: DIAGNOSTIC VALIDITY, PREDICTIVE VALIDITY AND TEST-RETEST RELIABILITY
In order to accurately discriminate between normal and pathological cognitive functioning, the aim of Study 2 was twofold: (1) to establish the diagnostic validity of verbal fluency tests and the predictive validity of our normative data (2) as well as the test-retest reliability.
1-Diagnostic and predictive validity
The diagnostic validity refers to the magnitude of the deficits that can be found in clinical populations on verbal fluency tests, by comparing their performance to those of healthy patients. The predictive validity is the usefulness of the test in classifying participants on a binary
classifier system (e.g., healthy, not healthy) as its discrimination threshold is varied.
Method
Participants
To establish the diagnostic validity of the test, data from 62 participants with probable Alzheimer’s disease (AD) and from 41 participants with a current major depressive episode (MDE) were compared to those of a subsample of 62 healthy participants, all aged 50 and over.
To establish the predictive validity, data from the same group of 62 participants with probable AD and from the same group of 62 healthy participants were compared. The participants with AD and MDE all came from CH’s laboratory (from secondary data).
URL: http://mc.manuscriptcentral.com/ntcn 3 4 5 6 7 8 9 10 11 12 13 14 15 16 17 18 19 20 21 22 23 24 25 26 27 28 29 30 31 32 33 34 35 36 37 38 39 40 41 42 43 44 45 46 47 48 49 50 51 52 53 54 55 56 57 58 59 60
For Peer Review Only
The subsample of healthy participants was randomly generated using the SPSS
COMPUTE command, which selected a random sample among participants of Study 1 aged 50 and over approaching the assigned value (n = 62) that was based on the number of subjects with AD. These 62 healthy people were not included in the normative data in Study 1. They were aged between 50 and 89 years and had between 3 and 20 years of formal education. One should note that these participants did not differ significantly from the normative sample aged 50 and over in terms of age (p = .956), education (p = .465), gender (p = .827), and raw score for semantic (p = .958) and phonemic verbal fluency (TNP or PFL; p = .697).
Probable AD was determined by medical records and history (e.g., diagnosis of AD from a medical doctor and/or participants taking an approved pharmacological treatment for dementia [memantine, donepezil, galantamine, or rivastigmine]), consensus among clinicians according to current diagnostic criteria (McKhann et al., 2011), and results from a comprehensive
neuropsychological assessment. The neuropsychological battery comprised tests of verbal (16-item Free and Cued Recall; Dion et al., 2014; Van der Linden et al., 2004) and non-verbal (Rey– Osterrieth or Taylor Complex Figure Tests; Osterrieth, 1994; Tremblay et al., 2015) episodic memory, language (Boston Naming Test; Kaplan, Goodglass, & Weintraub, 1983; Mack et al., 1992), semantic memory (Pyramids and Palm Trees Test; Callahan et al., 2010; Howard & Patterson, 1992), visuoperceptual skills ((Rey–Osterrieth or the Taylor Complex Figure Tests; Osterrieth, 1994; Tremblay et al., 2015), Clock Drawing Test (Yamamoto et al., 2004), Size Match Task of the Birmingham Object Recognition Battery (Humphreys & Riddoch, 1993)), executive functions (D-KEFS Trail Making Test and Color-Word Interference Test; Delis, Kaplan, & Kramer, 2001), and working memory/attention (WAIS-III Letter-Number Sequencing and Digit Symbol-Coding (Wechsler, 1997). In accordance with McKhann et al. criteria (2011), AD participants had impairment (Z ≤ -1.50) in verbal and/or non-verbal total learning (encoding process) or total delayed recall (consolidation process) of recently learned information. There was also evidence of impairment in at least one other cognitive domain. The mean performance on DRS-2 was 122.9 (SD = 8.4; n = 51). All of them also had functional impairment as revealed by the Alzheimer’s Disease Cooperative Study / Activities of Daily Living scale, based on the information provided by the participant and an informant/caregiver (Galasko et al., 1997). AD diagnosis was not applied when there was evidence of a stroke temporally related to the onset or
URL: http://mc.manuscriptcentral.com/ntcn 3 4 5 6 7 8 9 10 11 12 13 14 15 16 17 18 19 20 21 22 23 24 25 26 27 28 29 30 31 32 33 34 35 36 37 38 39 40 41 42 43 44 45 46 47 48 49 50 51 52 53 54 55 56 57 58 59 60
For Peer Review Only
worsening of cognitive impairment or prominent features of other dementias as those stated by McKhann et al. (2011).
The inclusion and exclusion criteria for the diagnosis of MDE were those of the DSM-IV-TR (American Psychiatric Association, 1994), using Structured Clinical Interview for DSM Disorders (SCID-I; Mood Episodes) (First, Spitzer, Gibbon, & Williams, 1997). The mean level of depressive symptoms as indicated by the GDS-30 was 18.3 (SD = 5.1). Participants with MDE had not a concurrent diagnosis of dementia (no functional impairment and absence of
impairment in encoding and consolidation processes on verbal and non-verbal episodic tests).
Sociodemographic data for these groups appear on Table 6.
Materials and Procedure
Verbal fluency tasks (TNP and animals) were administered to all subjects (AD, MDE, healthy subsample) using the same procedure and scoring method as in Study 1.
Statistical Analyses
Comparisons between AD, MDE, and healthy participants using one-way ANOVAs and chi-squares were run for age, education, and gender. To establish the diagnostic validity, one-way ANCOVAs controlling for the effect of age and education were run for performances on each condition of verbal fluency. Bonferroni post-hoc analyses for ANOVA and ANCOVA were chosen in order to reduce error of type I. Cohen’s d effect sizes were calculated when possible (Cohen, 1988). Cohen’s d ranging from 0.20 to 0.50 indicate small effect of a factor on
performance while Cohen’s d ranging from 0.50 to 0.80 and 0.80 and higher suggest moderate and large effects, respectively. All statistical analyses were performed using SPSS software (version 21.0) with the alpha level set at .05.
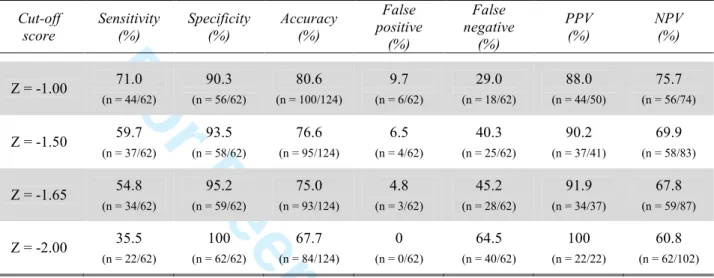
To establish the predictive validity, we compared the 62 healthy and the 62 AD
participants on different Z-scores for semantic verbal fluency in order to determine the better cut-off for a deficient performance (-1.00, -1.50, -1.65, and -2.00 SD; Table 7). The semantic
condition was chosen because the effect sizes of ANCOVA (partial eta squared; η2) showed that the diagnostic effect was much greater for the semantic verbal fluency condition versus
phonemic conditions (see results section). We preferred the comparison between healthy controls
URL: http://mc.manuscriptcentral.com/ntcn 3 4 5 6 7 8 9 10 11 12 13 14 15 16 17 18 19 20 21 22 23 24 25 26 27 28 29 30 31 32 33 34 35 36 37 38 39 40 41 42 43 44 45 46 47 48 49 50 51 52 53 54 55 56 57 58 59 60
For Peer Review Only
and AD participants over the one opposing healthy and MDE participants, because the effect size between performance of the first two groups was much larger (see results section) and because the diagnosis of MDE was not based on cognitive testing.
Results
Diagnostic validity
Participants with AD had a significantly lower level of education in comparison to healthy participants and were significantly older than both MDE and healthy participants. Thus, ANCOVA controlling for the effect of age and level of education were used when comparing performance on verbal fluency tests between the three groups (Table 6). Despite this control for confounders, the effect of the diagnosis was significant on semantic verbal fluency performance,
F(2, 162) = 43.962, p < .001, η2 = .355, on letter P fluency, F(2, 156) = 13.026, p < .001,
η2 = .145, and TNP fluency (no data for PFL), F(1, 101) = 5.096, p = .026, η2 = .049. More specifically, when compared to healthy participants, post-hoc analyses revealed that participants with AD had lower performances on animals and letter P conditions. In comparison to MDE participants, those with AD also had lower performances on animals and TNP conditions, but not on letter P. Severity of depression as measured on GDS-30 was not significantly related to
phonemic (r = -.051; p = .754) or semantic (r = -.111, p = .491) verbal fluency in participants with MDE.
Predictive Validity
In the identification of AD participants, a cut-off Z-score of -2.00 had the lowest sensitivity (35.5%) and accuracy (67.7%). However, a Z-score of -2.00 was perfect in terms of specificity (100%) and positive predictive value (PPV; 100%, meaning that all participants with a Z-score ≤ -2.00 had AD). On the other hand, less stringent Z-scores (e.g., -1.00 or -1.50) were more
balanced in terms of accuracy (between 76.6% and 80.6%). Specificity remained very good (90.3% to 93.5%) and sensitivity, although lower than specificity, was much better (between 59.7% and 71.0%) than with a cut-off set at -2.00 SD. Moreover, PPV remained good (between 88.0% and 90.2%) (Table 7). 2-Test-retest reliability URL: http://mc.manuscriptcentral.com/ntcn 3 4 5 6 7 8 9 10 11 12 13 14 15 16 17 18 19 20 21 22 23 24 25 26 27 28 29 30 31 32 33 34 35 36 37 38 39 40 41 42 43 44 45 46 47 48 49 50 51 52 53 54 55 56 57 58 59 60
For Peer Review Only
The test-retest reliability is the variation in measurements taken by one instrument under the same conditions in a given period of time. This measure is useful for differential diagnosis between healthy subjects and people with a neurodegenerative disorder. While healthy people are supposed to maintain a relatively stable performance over time, those with AD are expected to decline.
Method
Participants
Fifty-eight healthy subjects from the normative sample (CH’s laboratory) and 22 participants with AD who did the test twice were included. AD participants had this diagnosis both at time 1 and time 2. Healthy and AD participants were respectively aged of 71.1 (SD = 8.7) and 75.9 (SD = 6.6) years and had a mean education level of 14.5 (SD = 4.3) and 11.7 (SD = 3.4) years, respectively. The sample comprised 63.8% (n = 37) healthy women and 77.2% (n = 17) of women with AD.
Materials and Procedure
Healthy subjects and AD participants completed a second time the fluency tests using the TNP and animals conditions, approximately 12 months after the first assessment (mean = 13.5 months; SD = 1.6). Performance of the 58 healthy controls remained within normal range at the second assessment time on all the neuropsychological tests. Verbal fluency tasks were
administered using the same procedure and scoring method as in Study 1.
Statistical Analyses
Pearson’s correlations were derived between performance achieved during the first and the second administration time of each task.
Results
In the healthy sample, the test-retest reliability was high for both tasks, with correlations ranging from 0.711 (animals; p < .001) to 0.790 (TNP; p < .001). Performance for animals was stable between the first (mean = 17.9; SD = 4.5; range = 6-28) and the second (17.4; SD = 5.0; range =
URL: http://mc.manuscriptcentral.com/ntcn 3 4 5 6 7 8 9 10 11 12 13 14 15 16 17 18 19 20 21 22 23 24 25 26 27 28 29 30 31 32 33 34 35 36 37 38 39 40 41 42 43 44 45 46 47 48 49 50 51 52 53 54 55 56 57 58 59 60
For Peer Review Only
6-29) assessment one year later (p = .335; d = 0.09), but slightly decreased for TNP between the first (mean = 36.7; SD = 10.1; range = 14-62) and the second (mean = 35.0; SD = 10.5; range = 17-58) assessment, although the decrease was small in terms of raw scores and effect size (p = .047; d = 0.17). The test-retest reliability in AD was high for phonemic verbal fluency (r = .743;
p < .001), but decreased for semantic verbal fluency (r = .493; p = .020). The decrease in number
of words between the first (mean = 12.1; SD = 4.0; range = 6-21) and the second (mean = 10.6;
SD = 4.0; range = 2-17) administration was not statistically significant for animals, but was
between small to moderate in terms of effect size (p = .086; d = 0.39). This decrease in number of animal words did not significantly correlate with the difference observed on the total DRS-2 score between the two measurement times (r = -.176; p = .446). However, there was a trend for significance when the decline for animals was compared with the decline on the Pyramids and Palm Trees Test (PPTT; Howard & Patterson, 1992), a test of semantic memory, although only half of AD participants had this measure available (r = .549; p = .080).
Discussion
The aim of Study 2 was twofold: (1) to establish the diagnostic validity of verbal fluency tests and the predictive validity of our normative data (2) as well as the test-retest reliability.
Diagnostic validity
After controlling for the effect of age and education, we found that the effect size of the diagnosis was larger on semantic verbal fluency than on phonemic verbal fluency, with AD participants having the worst performance. Although a deficit in semantic verbal fluency performance can be found in MDE (Henry & Crawford, 2005a), a massive deficit on semantic verbal fluency should lead the clinician to consider the hypothesis of AD in the case of an older patient (Henry et al., 2004). The utility of this test is even greater since early failure of the
semantic memory system has been found in amnestic mild cognitive impairment (MCI) (Lonie et al., 2009). Indeed, the 9 year longitudinal PAQUID study showed that decline of semantic verbal fluency in MCI participants that will progress towards AD was steeper and more regular than that of a test of long-term visual episodic memory (Amieva et al., 2005). In short, semantic verbal fluency test proves to be interesting to highlight the deterioration of semantic stock, and often with a better sensitivity in comparison to an object-naming test, because the latter test
URL: http://mc.manuscriptcentral.com/ntcn 3 4 5 6 7 8 9 10 11 12 13 14 15 16 17 18 19 20 21 22 23 24 25 26 27 28 29 30 31 32 33 34 35 36 37 38 39 40 41 42 43 44 45 46 47 48 49 50 51 52 53 54 55 56 57 58 59 60
For Peer Review Only
provides more support to the lexical search process through visual stimulus information, thus possibly enhancing performance (Henry et al., 2004).
In regard to MDE, we found similar results that in Henry et al.’s (2005) meta-analysis, that is to say, a performance below that of healthy controls on both verbal fluency tasks but generally better than AD on semantic verbal fluency. Prior study found that in MDE, verbal fluency deficits are more explained by a generalized cognitive impairment or slowness in processing speed than by a dysexecutive syndrome deficits (Henry & Crawford, 2005a).
Predictive Validity
We aimed to determine the predictive validity of the normative data for semantic verbal fluency, since a deficit in this condition is known to be frequently associated with AD. A Z-score of -2.00 and lower led to a perfect PPV, meaning that all participants in our sample with such a Z-score (or lower) for animal fluency had AD. However, using a Z-score of -2.00 came with a high rate of false negatives (64.5%), meaning that many people with AD are not identified as having AD if only using semantic verbal fluency. Less stringent Z-scores (e.g., -1.00 for mild deficit and -1.50 for significant deficit) should be preferred because they offer good specificity (90.3% to 93.5%) and better sensitivity (between 59.7% and 71.0%), without compromising that much PPV (88.0% to 90.2%). Nevertheless, this task should be used in conjunction with tasks belonging to other cognitive domains, which offer a better ratio between sensitivity and specificity and reduce rate of false negatives (Belleville, Fouquet, Duchesne, Collins, & Hudon, 2014).
Test-Retest Reliability
Although performance slightly decreased in phonemic verbal fluency for healthy participants, the test-retest reliability was high for both verbal fluency tasks one year later. As such, on the whole, phonemic and semantic verbal fluency are two tasks relatively stable over time and useful to highlight cognitive decline. Indeed, participants with AD who were also assessed twice decreased on semantic, but not on phonemic verbal fluency, probably because of the
deterioration of their semantic memory and lower activation of concepts (Henry et al., 2004). Indeed, as evidenced in the results section we found a trend for significance between the decline
URL: http://mc.manuscriptcentral.com/ntcn 3 4 5 6 7 8 9 10 11 12 13 14 15 16 17 18 19 20 21 22 23 24 25 26 27 28 29 30 31 32 33 34 35 36 37 38 39 40 41 42 43 44 45 46 47 48 49 50 51 52 53 54 55 56 57 58 59 60
For Peer Review Only
observed on semantic verbal fluency and the one measured on a test of semantic memory (PPTT).
Strengths and Limitations
The main limitation of Study 2 is that it did not control for the effect of the severity of cognitive decline, because different cognitive screening tests were administered (MoCA, MMSE or DRS-2). Although scores on MoCA can be converted into MMSE scores (Saczynski et al., 2015), many participants only had a DRS-2 score. Nonetheless, all AD participants except one assessed twice were administered the DRS-2 and the difference on the total score between the two
measurement times did not significantly correlate with the decrease in number of words
produced for semantic verbal fluency. Similarly, in a review of the literature (Henry et al., 2004), dementia severity measured by a global screening was not significantly related to the relative magnitude of deficits upon phonemic and semantic fluency. Therefore, semantic fluency seems to capture a deficit different than the one measured with a global screening test like the DRS-2. Presenting the overall performance of these subgroups gave an overview of the extent of the expected deficits and could help the clinician to guide diagnosis. Moreover, to our knowledge, there are not yet any studies to report sensitivity and specificity for various clinical cut-offs on fluency tasks. In the current study, we provide diagnostic validity for Zscores of 1.00, 1.50, -1.65 and -2.00. This is of particular relevance for clinical neuropsychologists depending on whether they wish to focus on sensitivity or specificity. In regards to test-retest reliability in healthy subjects, although other studies reported similar data (Lezak et al., 2012; Strauss, Sherman, & Spreen, 2006, for a review), they used different letters (FAS, CFL) than those used in the current study. Test-retest reliability for semantic verbal fluency was reported in two studies only (Bird, Papadopoulou, Ricciardelli, Rossor, & Cipolotti, 2004; Clark et al., 2009), one of them using a very short length (one month) between both assessments.
Conclusion
This paper describes two studies that aimed to establish normative data for a large sample of French-speaking adult Quebecers (Study 1) and to establish the diagnostic/predictive validity of the tasks and of the present normative data in AD and MDE (Study 2). Results showed that these
URL: http://mc.manuscriptcentral.com/ntcn 3 4 5 6 7 8 9 10 11 12 13 14 15 16 17 18 19 20 21 22 23 24 25 26 27 28 29 30 31 32 33 34 35 36 37 38 39 40 41 42 43 44 45 46 47 48 49 50 51 52 53 54 55 56 57 58 59 60
For Peer Review Only
tests are sensitive to pathological conditions such as AD and MDE and can be used to help in differential diagnosis.
In the current sample, healthy, AD, and MDE participants generated more words starting with letter P in comparison with other letters under study. Letter P makes it possible to maximize the potential of a participant while offering a wider range of performance. This letter also allows the detection of the pathology (AD and MDE when compared to healthy elders). However, our results showed that letter P did not discriminate performance between AD and MDE while using a triad (e.g., TNP) helped to make this distinction. As such, although letter P alone could be useful in a busy clinical facility or when time is restricted, using a triad with letters of different levels of difficulty has probably a better specificity than using only letter P.
Acknowledgements
This work was funded by the Réseau québécois de recherche sur le vieillissement, the Canadian Institutes of Health Research (CIHR), the Alzheimer Society of Canada, the Natural Sciences and Engineering Research Council of Canada, and the Fonds de Recherche du Québec – Santé (FRQ-S). In addition, CH and JFG were supported by a salary award from the FRQ-S. GTV was supported by a doctoral grant from the Rhône-Alpes Region (France) in the cluster ‘Handicap, Aging, Neurosciences’ and by a FRQ-S postdoctoral award. JFG holds a Canada Research Chair in Cognitive Decline in Pathological Aging and a salary award from the CIHR. We are grateful to Christine Bertrand for her comments on the clinical content of this research.
Disclosure Statement
The authors declared no potential conflicts of interest with respect to the research, authorship, and/or publication of this article.
URL: http://mc.manuscriptcentral.com/ntcn 3 4 5 6 7 8 9 10 11 12 13 14 15 16 17 18 19 20 21 22 23 24 25 26 27 28 29 30 31 32 33 34 35 36 37 38 39 40 41 42 43 44 45 46 47 48 49 50 51 52 53 54 55 56 57 58 59 60
For Peer Review Only
References
Acevedo, A., Loewenstein, D. A., Barker, W. W., Harwood, D. G., Luis, C., Bravo, M., . . . Duara, R. (2000). Category fluency test: normative data for English- and Spanish-speaking elderly. Journal of the International Neuropsychological Society, 6, 760-769. doi:10.1017/S1355617700677032
American Psychiatric Association. (1994). Diagnostic and statistical manual of mental
disorders (4th ed., DSM-IV). Washington, DC: APA.
Amieva, H., Phillips, L. H., Della Sala, S., & Henry, J. D. (2004). Inhibitory functioning in Alzheimer’s disease. Brain, 127, 949-964. doi:10.1093/brain/awh045
Amieva, H., Jacqmin-Gadda, H., Orgogozo, J. M., Le Carret, N., Helmer, C., Letenneur, L., . . . Dartigues, J. F. (2005). The 9 year cognitive decline before dementia of the Alzheimer type: a prospective population-based study. Brain, 128, 1093-1101.
doi:10.1093/brain/awh451
Anterion, C. T., Honore, S., Cougny, H., Grosmaitre, C., & Laurent, B. (2001). Apport de l’épreuve d’évocation lexicale du Set test dans le dépistage de la maladie d’Alzheimer. [Contribution of lexical recall to the Set Test in Alzheimer's disease screening]. Revue Neurologique (Paris), 157, 1377-1382. doi: RN-11-2001-157-11-0035-3787-101019-ART74.
Beck, A. T., Steer, R. A., & Brown, G. K. (1996). Beck Depression Inventory-II: Manual. San Antonio, TX: The Psychological Corporation.
Benton, A. L., Hamsher, K. D., & Sivan, A. B. (1994). Multilingual Aphasia Examination. Lutz, FL: Psychological Assessment Resources, Inc.
Béland, R., & Lecours, A. R. (1990). The MT-86 β aphasia battery: A subset of normative data in relation to age and level of school education. Aphasiology, 4, 439-462.
doi:10.1080/02687039008248786
Belleville, S., Fouquet, C., Duchesne, S., Collins, D. L., & Hudon, C. (2014). Detecting early preclinical Alzheimer’s disease via cognition, neuropsychiatry, and neuroimaging: Qualitative review and recommendations for testing. Journal of Alzheimer’s disease, 42, S375-382. doi:10.3233/jad-141470
Bergman, I., & Almkvist, O. (2015). Neuropsychological test norms controlled for physical health: Does it matter? Scandinavian Journal of Psychology, 56, 140-150.
doi:10.1111/sjop.12170
Bird, C. M., Papadopoulou, K., Ricciardelli, P., Rossor, M., & Cipolotti, L. (2004). Monitoring cognitive changes: Psychometric properties of six cognitive tests. Bristish Journal of Clinical Psychology, 43, 197-210. doi:10.1348/014466504323088051
Birn, R. M., Kenworthy, L., Case, L., Caravella, R., Jones, T. B., Bandettini, P. A., & Martin, A. (2010). Neural systems supporting lexical search guided by letter and semantic category cues: A self-paced overt response fMRI study of verbal fluency. NeuroImage, 49, 1099-1107. doi:10.1016/j.neuroimage.2009.07.036
Bolla, K. I., Lindgren, K. N., Bonaccorsy, C., & Bleecker, M. L. (1990). Predictors of verbal fluency (FAS) in the healthy elderly. Journal of Clinical Psychology, 46, 623-628. doi:10.1002/1097-4679(199009)46:5<623::AID-JCLP2270460513>3.0.CO;2-C
Callahan, B. L., Macoir, J., Hudon, C., Bier, N., Chouinard, N., Cossette-Harvey, M., . . . Potvin, O. (2010). Normative data for the Pyramids and Palm Trees Test in the Quebec-French
URL: http://mc.manuscriptcentral.com/ntcn 3 4 5 6 7 8 9 10 11 12 13 14 15 16 17 18 19 20 21 22 23 24 25 26 27 28 29 30 31 32 33 34 35 36 37 38 39 40 41 42 43 44 45 46 47 48 49 50 51 52 53 54 55 56 57 58 59 60
For Peer Review Only
population. Archives of Clinical Neuropsychology, 25, 212-217. doi:10.1093/arclin/acq013Canadian Study of Health and Aging Working Group. (1994). Canadian Study of Health and Aging: study methods and prevalence of dementia. Canadian Medical Association
Journal, 150, 899-913.
Cardebat, D., Doyon, B., Puel, M., Goulet, P., & Joanette, Y. (1990). Évocation lexicale formelle et sémantique chez des sujets normaux : performances et dynamiques de production en fonction du sexe, de l'âge et du niveau d'étude. [Formal and semantic lexical evocation in normal subjects. Performance and dynamics of production as a function of sex, age and educational level]. Acta neurologica Belgica, 90, 207-217.
Clark, L. J., Gatz, M., Zheng, L., Chen, Y.-L., McCleary, C., & Mack, W. J. (2009).
Longitudinal verbal fluency in normal aging, preclinical and prevalent Alzheimer disease.
American Journal of Alzheimer’s Disease and Other Dementias, 24, 461-468.
doi:10.1177/1533317509345154
Cohen, J. (1988). Statistical power analysis for the behavioral sciences. In J. Cohen (Ed.), (2nd ed., pp. 25-27). Hillsdale, NJ, USA: Erlbaum Associates.
Costafreda, S. G., Fu, C. H., Lee, L., Everitt, B., Brammer, M. J., & David, A. S. (2006). A systematic review and quantitative appraisal of fMRI studies of verbal fluency: Role of the left inferior frontal gyrus. Human Brain Mapping, 27, 799-810.
doi:10.1002/hbm.20221
Cralidis, A., & Lundgren, K. (2014). Component analysis of verbal fluency performance in younger participants with moderate-to-severe traumatic brain injury. Brain Injury, 28, 456-464. doi:10.3109/02699052.2014.896945
Crawford, J. R., & Howell, D. C. (1998). Regression equations in clinical neuropsychology: an evaluation of statistical methods for comparing predicted and obtained scores. Journal of
Clinical and Experimental Neuropsychology, 5, 755-762. doi:10.1076/jcen.20.5.755.1132
Desrochers, A., & Bergeron, M. (2000). Valeurs de fréquence subjective et d’imagerie pour un échantillon de 1,916 substantifs de la langue française. [Norms of subjective frequency of use and imagery for a sample of 1,916 French nouns]. Canadian Journal of
Experimental Psychology, 54, 274-325.
Delis, D. C., Kaplan, E., & Kramer, J. H. (2001). Delis-Kaplan Executive Function System (D–
KEFS) Examiner’s manual. San Antonio: TX: The Psychological Corporation.
Dion, M., Potvin, O., Belleville, S., Ferland, G., Renaud, M., Bherer, L., . . . Hudon, C. (2014). Normative data for the Rappel libre/Rappel indicé à 16 items (16-item Free and Cued Recall) in the elderly Quebec-French population. The Clinical Neuropsychologist, 28, 1-19. doi:10.1080/13854046.2014.915058
Elgamal, S. A., Roy, E. A., & Sharratt, M. T. (2011). Age and verbal fluency: The mediating effect of speed of processing. Canadian Geriatrics Journal, 14, 66-72.
doi:10.5770/cgj.v14i3.17
Fine, E. M., Kramer, J. H., Lui, L. Y., & Yaffe, K. (2012). Normative data in women aged 85 and older: Verbal fluency, digit span, and the CVLT-II short form. The Clinical
Neuropsychologist, 26, 18-30. doi:10.1080/13854046.2011.639310
First, M. B., Spitzer, R. L., Gibbon, M., & Williams, J. B. W. (1997). Structured Clinical
Interview for DSM-IV Axis I disorders (SCID I). New York: Biometric Research
Department. URL: http://mc.manuscriptcentral.com/ntcn 3 4 5 6 7 8 9 10 11 12 13 14 15 16 17 18 19 20 21 22 23 24 25 26 27 28 29 30 31 32 33 34 35 36 37 38 39 40 41 42 43 44 45 46 47 48 49 50 51 52 53 54 55 56 57 58 59 60
For Peer Review Only
Folstein, M. F., Folstein, S. E., & McHugh, P. R. (1975). ‘Mini-mental state’. A practical method for grading the cognitive state of patients for the clinician. Journal of Psychiatric
Research, 12, 189-198. doi:10.1016/0022-3956(75)90026-6
Fontaine, F., & Joubert, S. (2010). Fluence formelle et sémantique : Données normatives pour
une population francophone âgée vivant au Québec depuis au moins 40 ans. [Formal and
semantic fluency: normative data for French-speaking seniors living in Quebec for at least 40 years]. Montréal: Institut universitaire de gériatrie de Montréal, Centre de recherche. Retrieved from http://www.criugm.qc.ca/outilscliniques/fiche.html?f_num=69 Galasko, D., Bennett, D., Sano, M., Ernesto, C., Thomas, R., Grundman, M., & Ferris, S. (1997).
An inventory to assess activities of daily living for clinical trials in Alzheimer's disease. The Alzheimer's Disease Cooperative Study. Alzheimer Disease and Associated
Disorders, Suppl 2, S33-39. doi: 10.1097/00002093-199700112-00005
Giulioli, C., Meillon, C., Gonzalez-Colaco Harmand, M., Dartigues, J. F., & Amieva, H. (2016). Normative scores for standard neuropsychological tests in the oldest old from the French population-based PAQUID study. Archives of Clinical Neuropsychology, 31, 58-65. doi:10.1093/arclin/acv055
Gladsjo, J. A., Schuman, C. C., Evans, J. D., Peavy, G. M., Miller, S. W., & Heaton, R. K. (1999). Norms for letter and category fluency: Demographic corrections for age, education, and ethnicity. Assessment, 6, 147-178. doi:10.1177/107319119900600204
Godefroy, O., & Le groupe de réflexion pour l'évaluation des fonctions exécutives (GREFEX). (2008). Fonctions exécutives et pathologies neurologiques et psychiatriques : évaluation en pratique clinique. [Executive functions and neurological and psychiatric disorders: evaluation in clinical practice]. Marseille: Solal.
Government of Quebec (2016). Québec Handy Numbers, 2016 Edition. Institut de la statistique du Québec. Retrieved from
http://www.stat.gouv.qc.ca/quebec-chiffre-main/pdf/qcm2016_an.pdf.
Government of Canada. (2015). Population by sex and age group, by province and territory (Proportion of, female). Statistics Canada. Retrieved from
http://www.statcan.gc.ca/tables-tableaux/sum-som/l02/cst01/demo31f-fra.htm.st Hamilton, M. (1960). A rating scale for depression. Journal of Neurology, Neurosurgery &
Psychiatry, 23, 56-61. doi:10.1136/jnnp.23.1.56
Hamilton, M. (1967). Development of a rating scale for primary depressive illness. British
Journal of Social & Clinical Psychology, 6, 278-296.
doi:10.1111/j.2044-8260.1967.tb00530.x
Haugrud, N., Crossley, M., & Vrbancic, M. (2011). Clustering and switching strategies during verbal fluency performance differentiate Alzheimer’s disease and healthy aging. Journal
of the International Neuropsychological Society, 17, 1153-1157.
doi:10.1017/s1355617711001196
Haugrud, N., Lanting, S., & Crossley, M. (2010). The effects of age, sex and Alzheimer’s disease on strategy use during verbal fluency tasks. Neuropsychology, Development, and
Cognition. Section B, Aging, Neuropsychology and Cognition, 17, 220-239.
doi:10.1080/13825580903042700
Hendrawan, D. (2013). Factors affecting letter fluency performance among Indonesian
undergraduate students: A short report. Procedia - Social and Behavioral Sciences, 97, 266-270. doi:10.1016/j.sbspro.2013.10.232 URL: http://mc.manuscriptcentral.com/ntcn 3 4 5 6 7 8 9 10 11 12 13 14 15 16 17 18 19 20 21 22 23 24 25 26 27 28 29 30 31 32 33 34 35 36 37 38 39 40 41 42 43 44 45 46 47 48 49 50 51 52 53 54 55 56 57 58 59 60