Control of Polymorphism in Continuous Crystallization
byTsai-Ta Christopher Lai B.S. Chemical Engineering
National Taiwan University, Taiwan, 2011
SUBMITTED TO THE DEPARTMENT OF CHEMICAL ENGINEERING IN PARTIAL FULFILLMENT OF THE REQUIREMENTS FOR THE DEGREE OF
DOCTOR OF PHILOSOPHY IN CHEMICAL ENGINEERING AT THE
MASSACHUSETTS INSTITUTE OF TECHNOLOGY May 2016
0 Massachusetts Institute of Technology 2016. All rights reserved
The author hereby grants to MIT permission to reproduce and to distribute publicly paper and electronic copies of this thesis document in whole or in part in any medium now known or
thereafter created qSAiSignature
redacted
Signature
Certified by: A ccepted by: ... MASSACHUSETTS INSTITUTE OF TECHNOLOGYJUN 0
6
2016
LIBRARIES
redacted
...
Department of Chemical Engineering May 13, 2015
Signature redacted
Allan S. Myerson Professors of Chemical Engineering Bernhardt L. Trout Raymond F. Baddour Professor of Chemical Engineering Thesis Supervisors
Signature redacted
Richard D. Braat-" Edwin R. Gilliland Professor of Chemical EngineeringMITLibraries
77 Massachusetts Avenue Cambridge, MA 02139 http://Iibraries.mit.edu/ask
DISCLAIMER NOTICE
Due to the condition of the original material, there are unavoidable flaws in this reproduction. We have made every effort possible to
provide you with the best copy available. Thank you.
The images contained in this document are of the best quality available.
Control of Polymorphism in Continuous Crystallization
by
Tsai-Ta Christopher Lai
Submitted to the Department of Chemical Engineering on May 13, 2016, in partial fulfillment of the requirements for the degree of
Doctor of Philosophy in Chemical Engineering
Abstract
Continuous manufacturing has gained significant interest in recent years as the ultra-lean mode of pharmaceutical production. Albeit the increasing number of studies on the process dynamics in continuous crystallization, in particular in yield improvement and impurity separation, the research community lacks the systematic understanding of the control of polymorphism in continuous crystallization. Variations in the polymorphism of the active pharmaceutical ingredient can undermine the bioavailability and the downstream processability of the drug substance. Thus, precise control of the drug polymorphism is pivotal for delivering quality drug products to the patients.
In this thesis work, we aimed to develop a series of steps forward in understanding the polymorph dynamics in continuous crystallization, notably in mixed-suspension, mixed-product removal (MSMPR) crystallization. We first elucidated the major intrinsic and extrinsic factors which govern the process polymorphism in both monotropic and enantiotropic polymorphic compounds. Using the monotropic L-glutamic acid as the model compound, two temperature regimes each with distinctive kinetic and thermodynamic characteristics were identified. It is
found that at high temperatures, the polymorph dynamics is mediated by the relative thermodynamics of the polymorphs. The most stable form is likely to be the dominant form at steady state. On the other hand, at low temperatures, the interplay of the crystal growth and nucleation kinetics is found to play an important role in determining the final polymorphism. Similar results were identified in the enantiotropic p-aminobenzoic acid system where three temperature regimes were identified. The additional regime is located near to the transition temperature where the chemical potential of the two polymorphs are identical. The steady state polymorphism is thereby determined by the kinetic energy barriers for the crystallization of the polymorphs. The study of polymorphism was also conducted in cooling-antisolvent crystallization and the effect of solvent composition on the polymorph dynamics was studied. In addition, the dynamic pathways connecting the startup states to the metastable steady states and
the stable steady states were determined. The polymorphic transition between these steady states was observed and analyzed.
The fundamental understanding of the kinetic competition and the governing dynamics in polymorphic crystallization forms the backbone for developing the polymorph control strategies in this thesis. Based on the polymorph dynamic studies, we designed MSMPR cascade systems to control the process polymorphism. In addition, systematic procedures are established to facilitate the design and optimization of continuous crystallization with the objectives to control polymorphism, optimize process yield and achieve the target crystal size distribution. The operational window is determined within which these control objectives are achieved. As there are increasing interests in transitioning pharmaceutical manufacturing from batch to continuous processing, the results in this thesis should develop a substantial position in the body of scientific literature.
Thesis Supervisors: Allan S. Myerson
Title: Professor of Chemical Engineering Bernhardt L. Trout
Acknowledgements
It is impossible to complete the PhD journey without the support and help provided by the MIT community. I have been incredibly fortunate to have the invaluable mentorship, the professional and personal support, and the deep and lasting friendship that have advanced me toward my academic and career goals. This thesis is made possible by the support and guidance of many people, and I will do my best to thank them here.
Foremost, I would like to thank my thesis advisors Professor Myerson and Professor Trout for their mentorship during my Ph.D. work. They provided valuable scientific advices and guidance on research; and more importantly, they taught me how to be an independent researcher and how to apply my engineering knowledge to create true impact to the community. Professor Myerson guided the grand direction of this research. Along the journey, not only he helped me to determine the milestones of my experimental work but he also trained me to develop the robust scientific thinking process. His in-depth understanding and knowledge of the field of crystallization and phannaceutical engineering are invaluable to my research. Oftentimes, I find his expertise in the field and intuition helped guiding the project in the right direction on both the macroscopic and microscopic level. Professor Trout is also an invaluable mentor to me. As the director of the MIT-Novartis Center of Continuous Manufacturing, he shows the perfect example of how engineering insight can be applied to solve complex issues. His leadership directly influences my current role as an entrepreneur. His expertise in simulation also helped me overcome several major barriers of this thesis work. In addition to my advisors, I would also like to thank my thesis committee members, Professor Braatz and Professor Roman, for their continued support. Many key decisions of this research are made due to their advices. In addition, I would like to give special thanks to our amazing academic administrators, Suzanne Maguire and Joel Dashnaw, who created this loving and caring community in the department.
My family and friends are the most important companions of this journey. I would like to thank my parents, Paul Lai and Rose Zen, and my grandparents for their endless love and support, as well as my aunty Grace Chu and uncle Jack Rochester for taking care of me in Boston. I also have the fortune to befriend the amazing people at MIT. Their support both professionally and personally is the greatest gift of all. I'd like to thank Steven Ferguson, Laura Palmer, Nahan Li, Jan Cornevin and Jennifer Schall who worked with me on this project. I am grateful to learn from them not only as co-workers but also as good friends. Lastly, I would like to specially thank my friends Noriko Endo, Jicong Li, Yuqing Cui, Li Tan, You Peng, Joel Paulson, Zachary Buras, Lisi Xie, Jennie Zeng, Alina Rwei, Sasha Huang, Gerard Mendez, Lu Yang, Yi Ding, Nopphon Weeranoppanant, Itthi Chatnuntawech, Nathan Yee, Sakul Ratanalert, Karthik Narsimhan, Anasuya Mandal, Helen Luo, Alex Bourque, Sean Faltermeier, Steven Chang, Shu-Heng Shao, Marucs Chuang, Kevin Chen, Yvonne Su, Allen Chen, Chern Chuang, Hsien-Chung Tseng, Kay Hsi, Jen Lee, Chih-Jen Shih, Po-Yen Chen, and Adam Tatusko for the amazing and sometimes crazy time we had together at MIT and for more to come.
Table of Contents Abstract ... 3 Acknowledgem ents... 5 List of Figures ... 9 List of Tables ... 16 Chapter 1: Introduction ... 18
1.1 Continuous Crystallization of Sm all M olecule Pharm aceuticals ... 18
1.2 Polym orphism in Pharm aceutical Crystallization ... 19
1.3 M otivation and Thesis Outline... 21
1.3.1 D eficiencies of Current Research... 21
1.3.2 Objectives ... 21
1.3.3 Thesis Overview ... 23
Chapter 2: Polymorph Dynamic in Continuous Crystallization: Monotropic System ... 27
2.1 Introduction ... 27
2.2 M aterials & M ethods... 30
2.3 Experim ental Setup ... 35
2.4 Connecting Batch to Continuous Crystallization... 36
2.5 Polymorph-Selective Crystallization in Unseeded MSMPR ... 40
2.6 The Effect of Seeding on the Polym orphism at Steady State ... 43
2.7 Steady State Polym orphic Transition... 44
2.8 Population Balance M odel & Param eter Estim ation... 46
2.9 Dynam ic Sim ulation in Single-Stage M SM PR ... 50
2.10 Concluding Rem arks ... 57
Chapter 3: Polymorph Dynamic in Continuous Crystallization: Enantiotropic System... 61
3.1 Introduction ... 61
3.2 M aterials & M ethods... 65
3.3 Batch Crystallization of the Enantiotropic p-aminobenzoic Acid ... 69
3.4 Polymorph Dynamic of p-aminobenzoic Acid in Single-Stage MSMPR... 70
3.6 Population Balance Model & Parameter Estimation... 76
3.7 Process Simulation and Sensitivity Analysis ... 79
3.8 Concluding Remarks ... 86
Chapter 4: Control of Polymorphism in Continuous Crystallization via MSMPR Cascade Design ... 8 9 4 .1 Intro du ction ... 89
4.2 Materials & Experimental Design... 92
4.3 Polymorphism in Single-Stage M SMPR Systems ... 100
4.4 Polymorph Control by M SMPR Cascade Design... 103
4.5 Polymorphism in Single-Stage M SMPR with Recycle... 106
4.6 Polymorph Control Using Thermal Cycling ... 110
4.7 Population Balance and Dynamic Simulation... 112
4.8 Steady State Simulation of MSMPR Cascade... 116
4.9 Concluding Remarks ... 122
Chapter 5: Polymorphism in Continuous Cooling-Antisolvent Crystallization ... 126
5 .1 Introdu ction ... 126
5.2 Materials & Solvent Selection... 128
5.3 Experimental Design... 132
5.4 Combined Cooling-Antisolvent Crystallization in Batch ... 136
5.5 Polymorph Dynamics in Single-Stage M SMPR ... 138
5.6 Polymorph-Specific MSMPR Crystallization... 141
5.7 Kinetic Competition at the Transition Temperature ... 145
5.8 M SMPR Cascade Simulation... 149
5.9 Concluding Remarks ... 156
Chapter 6: Design and Optimization of MSMPR Cascade with Cooling-Antisolvent C rystallization ... 160
6 .1 Introdu ction ... 160
6.2 Materials & M ethods... 163
6.3 From Batch toward Continuous M SMPR Design... 168
6.4 Design of M SMPR Experiments... 171
6.6 MSMPR Crystallization of p-aminobenzoic Acid in Cooling-Antisolvent Crystallization ... 1 8 7
6.7 Sensibility Analysis in Two-Stage M SM PR Cascade... 189
6.8 Control of Polymorphism in M SM PR Cascade ... 198
6.9 M SM PR Crystallization of Compound C... 207
6.10 Parameter Estimation via Transient M SMPR Experiments... 211
6.11 Size Control in Continuous Cooling-Antisolvent Crystallization... 219
6.12 Concluding Remarks ... 224
Chapter 7: Conclusions & Recommendations ... 228
7.1 Conclusions ... 228
List of Figures
Figure 2.1. X-ray powder diffraction patterns of (a) the metastable a form and (b) the stable
P
form ... . . 3 0 Figure 2.2. Optical microscope image of (a) the metastable a form and (b) the stable
P
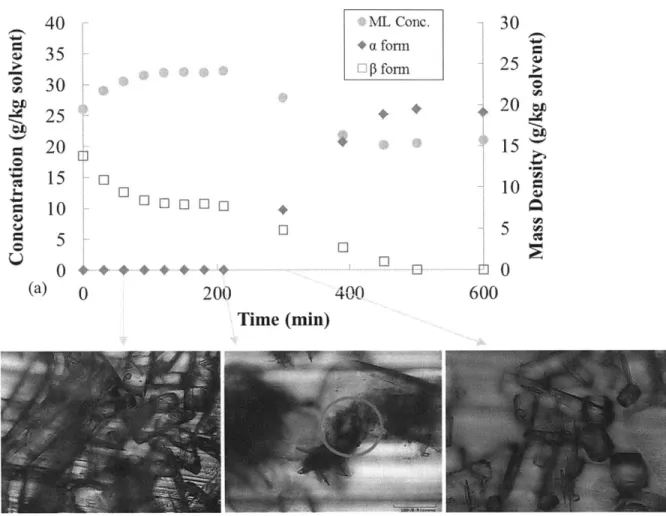
fo rm ... 3 0 Figure 2.3. Schematic plot for the MSMPR crystallizer ... 31 Figure 2.4. Calibration line of the FTIR absorbance at 1402 cm-1 against predetermined L-glutamic acid solute concentrations ... 32 Figure 2.5. Calibration line of the XRPD peak height percentage of a polymorph against known polymorph mass contents ... 34 Figure 2.6. Mass density profile of a and P form L-glutamic acid in 25'C batch crystallization exp erim ent ... 36 Figure 2.7. Mass density profile of a and f form L-glutamic acid in 45'C batch crystallization experim ent ... 37 Figure 2.8. Estimating the polymorphism in MSMPR crystallization using batch dynamic profile: (a) small residence time and (b) long residence time of the fluid element...38 Figure 2.9. Illustration of MSMPR process design strategies to achieve polymorph-selective continuous crystallization ... 39 Figure 2.10. Experimental results of the 25'C, 60 minutes residence time MSMPR: (a) the time evolution of ML concentration and a form mass fraction and (b) cord length distribution and optical image of the a crystals at steady state ... 40 Figure 2.11. Steady state transition from
P
to a polymorph in seeded 25'C MSMPR (120 minutes residence time): (a) polymorph mass density profiles and (b) optical images of the collected crystal sam ples ... 45 Figure 2.12. Fitted crystal size distribution of MSMPR (25'C and residence time of 120 minutes) under (a) steady state with only a polymorph detectable and (b) quasi-steady state with onlyp
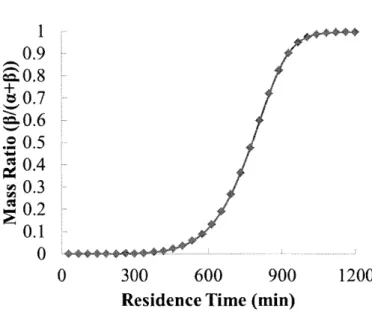
polymorph detectable ... 49 Figure 2.13. Dynamic response of the polymorph mass ratio with different seed weights: 1.6, 16 and 32 g/kg solvent ... 50 Figure 2.14. Stability analysis of the 0 form specific steady state at 25C ... 51Figure 2.15. Stability analysis of the a form specific steady state at 25C ... 52 Figure 2.16. State stability with different eigenvalues ... 54 Figure 2.17. Eigenvalue analysis of the process matrix confirms the
P
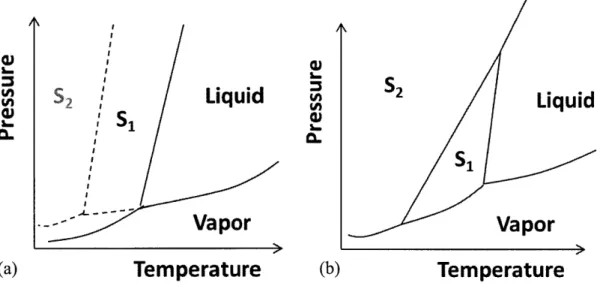
form-specific steady state to be metastable and the a form-specific steady state to be stable ... 54 Figure 2.18. The steady state polymorph mass ratio (P form mass fraction) under different MSMPR residence time at 25'C ... 56Figure 3.1. Steady states with various polymorphic conditions can be achieved in a single-stage M SM PR crystallizer ... 59 Figure 3.2. Steady states of single-stage MSMPR with different residence time (L-glutamic acid) ... . . .. 6 0 Figure 3.3: Schematic plot for the phase diagram of (a) a monotropic system, and (b) an enantiotropic system ... 61 Figure 3.4: Desaturation profile for batch crystallization with (a) monotropically related polymorphs, and (b) enantiotropically related polymorphs ... 62 Figure 3.5. X-ray powder diffraction patterns of (a) the a polymorph and (b) the
P
polymorph ... 6 4 Figure 3.6. Optical microscope image of (a) the a polymorph and (b) theP
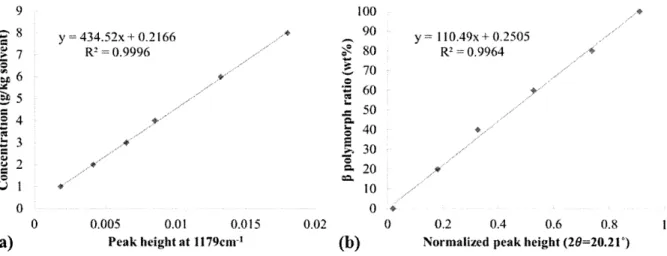
polymorph ... 65 Figure 3.7. Calibration curve of (a) solute concentration measurement based on the infrared peak at 1179cm' and (b)P
polymorph mass ratio using the XRPD peak at 20=20.21 normalized tothe peak at 20=9.70 ... 67
Figure 3.8. The evolution of the solute concentration and polymorphism of the 5'C MSMPR from the startup state (seeded with a crystals) to the
P
polymorph specific steady state ... 69 Figure 3.9. Temperature regimes on the phase diagram of the enantiotropic p-aminobenzoic acid ... 7 2 Figure 3.10. Fitted crystal size distribution of (a) a polymorph-specific steady state MSMPR (20'C and residence time of 60 minutes) and (b)P
polymorph steady state MSMPR (15'C and residence tim e of 60 m inutes) ... 77 Figure 3.11. The steady state polymorphism and yield of single-stage MSMPR at various stage temperature (residence time fixed at 60 minutes) ... 78Figure 3.12. The crystal growth and nucleation rates of the two polymorphs in steady state
MSMPR operated at different stage temperature ... 80
Figure 3.13. Steady state polymorph ratio as a function of intrinsic kinetic and thermodynamic parameters of the polymorphs ... 82
Figure 3.14. Process sensitivity analysis based on the analytical solution of the crystal mass ratio between the two polymorphs at steady state ... 84
Figure 4.1. Illustration of a desupersaturation profile in steady state (a) PFR systems and (b) M SM P R system s ... 89
Figure 4.2. Illustration of the proposed polymorph control methodology: two-stage MSMPR ... 9 0 Figure 4.3. Illustration of a two-stage MSMPR system ... 92
Figure 4.4. Illustration of a single-stage MSMPR with solid recycle ... 94
Figure 4.5. Illustration of a single-stage MSMPR with mother liquor recycle ... 95
Figure 4.6. Illustration of a single-stage MSMPR with thermal cycling ... 97
Figure 4.7. Temperature regimes on the phase diagram of the enantiotropic p-aminobenzoic acid ... 10 0 Figure 4.8. Temperature regimes on the phase diagram of the monotropic L-glutamic acid ... 10 1 Figure 4.9. MSMPR cascade design for obtaining a polymorph specific steady states at the final stag e ... 10 2 Figure 4.10. Polymorph evolution of single-stage MSMPR with the solid recycle ratio of 20wt% ... 1 0 5 Figure 4.11. Self-seeding of the solid recycle system versus continuous seeding of MSMPR cascade system ... 106
Figure 4.12. Thermal cycling is applied such that the slurry temperature swings between the crystallizer set temperature and a high temperature where undesired crystals are dissolved ... 109
Figure 4.13. Using thermal cycling to maintain a metastable steady state in single-stage MSMPR where pure
P
form L-glutamic acid is obtained ... 109Figure 4.14. Tracking the evolution of crystals growth of the seed crystals and the new-born crystals using the Lagrangian-based method of characteristics ... 112
Figure 4.15. The yield (relative to the equilibrium batch) and a polymorph purity in the final stage (5'C) as a function of (a) the residence time assigned to the first stage (30'C) and (b) the tem perature of the first stage ... 116 Figure 4.16. Contour plots of (a) yield and (b) a polymorph purity in the second stage MSMPR using the two operating parameters, temperature in the first stage and the residence time assigned to th e first stag e ... 1 18 Figure 4.17. Overlapping the contour plots of yield and a polymorph purity to identify the operational w indow ... 120 Figure 5.1. Solution Infrared (IR) spectra of PABA in ethyl acetate, water and dimethyl sulfoxide (DMSO) at room temperature ... 128 Figure 5.2. The crystal structure of the
p
polymorph (left) and the a polymorph (right) ... 129 Figure 5.3. The relative polarity of solvent (or antisolvent) candidates and the solubility of p-aminobenzoic acid in these solvents ... 130 Figure 5.4. Illustration of the single-stage MSMPR with cooling-antisolvent crystallization ... 1 3 1 Figure 5.5. Calibration curve of (a) solute concentration measurement based on the HPLC peak at the retention time of 4.38 minutes and (b)P
polymorph mass ratio using the XRPD peak at 20=20.21' normalized to the peak at 20=9.70 ... 134 Figure 5.6. (a) Desupersaturation profile and (b) crystal polymorphism of the batch crystallization at 5 C ... 135 Figure 5.7. (a) Concentration profile of the unseeded single-stage MSMPR and (b) solute concentration profile after the addition of theP
crystals at the metastable a form-specific steady state ... 13 8 Figure 5.8. Steady state mother liquor concentration of the single-stage MSMPRs at different temperatures (DMSO-water ratio: 20-80, v/v) ... 141 Figure 5.9. Steady state mother liquor concentration of the polymorph-specific MSMPRs at different temperatures with DMSO-water ratio of 10-90 (v/v), and (b) 30-70 (v/v) ... 142 Figure 5.10. Steady state mother liquor concentration of the polymorph-specific MSMPRs at different temperatures with DMSO-water ratio of 30-70 (v/v) ... 142 Figure 5.11. The kinetic prefactors of growth and nucleation of the two polymorphs under different antisolvent com positions ... 146Figure 5.12. The supersaturation terms of growth and nucleation of the two polymorphs under different antisolvent com positions ... 146 Figure 5.13. Illustration of the two-stage MSMPR with cooling-antisolvent crystallization ... 151
Figure 5.14. Model predictions and the experimental results of the two-stage MSMPR with the solvent-antisolvent composition in the first stage of 30/70 ... 153 Figure 5.15. Model predictions and the experimental results of the two-stage MSMPR with the solvent-antisolvent composition in the first stage of 20/80 ... 154 Figure 6.1. X-ray powder diffraction patterns of the form A of compound C ... 163 Figure 6.2. Optical microscope image of the compound C crystals ... 163 Figure 6.3. Illustration of the (a) single-stage MSMPR and (b) multi-stage MSMPR with cooling-antisolvent crystallization ... 164 Figure 6.4. Calibration line of the solute concentration of Compound C as a function of the peak area of the characteristic peak at 3.42 minutes retention time ... 166 Figure 6.5. Decision tree for designing MSMPR experiments to construct the kinetic model for any given com pound ... 170 Figure 6.6. Illustration of a "swing" of the crystallizer solvent composition designed to obtain crystal growth and nucleation kinetics across solvent composition ... 172 Figure 6.7. Schematic plot for optimizing the MSMPR cascade system ... 183 Figure 6.8. Polymorphic specific regimes of p-aminobenzoic acid; the dominant polymorph within the kinetic competition regimes is determined by the solvent composition ... 186 Figure 6.9. The effect of the temperature and antisolvent composition in the first stage on the final polymorphism of the two-stage MSMPR cascade ... 189 Figure 6.10. The final process yield in the second stage when varying the temperature and
antisolvent com position in the first stage ... 190 Figure 6.11. The polymorphism and mean size of the two-stage MSMPR with different ratio of the total residence time assigned to the first stage (1't stage temperature: 30'C) ... 191
Figure 6.12. The polymorphism and mean size of the two-stage MSMPR with different ratio of the total residence time assigned to the first stage (1st stage temperature: 5'C) ... 193
Figure 6.13. The polymorphism and mean size of the two-stage MSMPR with different ratio of the total residence time assigned to the first stage (1st stage temperature: 15'C) ... 194
Figure 6.14. Process yield of the two-stage MSMPR at different second stage temperature and antisolvent com position ... 195 Figure 6.15. The steady state (a) polymorphism and (b) mean crystal size of the two-stage MSMPR at different second stage temperature and antisolvent composition ... 196 Figure 6.16. The final yield of the two-stage MSMPR at different temperature and antisolvent com position in the first stage ... 198 Figure 6.17. The final polymorphism of the two-stage MSMPR at different temperature and antisolvent composition in the first stage ... 199 Figure 6.18. The average crystal size at the outlet of the two-stage MSMPR at different temperature and antisolvent composition in the first stage ... 200 Figure 6.19. Determining the window of operation of the two-stage MSMPR cascade in order to reach the target yield (>0.9) ... 202 Figure 6.20. The final polymorphism of the two-stage MSMPR at different temperature and antisolvent composition in the first stage ... 203 Figure 6.21. The attainable region of the MSMPR cascade ... 204 Figure 6.22. The evolution of the solute concentration and crystal size in transient single-stage M SM PR crystallization ... 206 Figure 6.23. The evolution of the chord length distribution over the course of the transient MSMPR crystallization experiment ... 207 Figure 6.24. The evolution of the solute concentration and crystal size in as the solvent composition in the MSMPR swing from one set-point to another ... 208 Figure 6.25. The evolution the chord length distribution in the MSMPR crystallizer as the solvent composition swing from one set-point to another ... 209 Figure 6.26. Parameter estimation strategy for the transient MSMPR experiment ... 210 Figure 6.27. Parameter estimation strategy for the solvent swing experiments ... 211 Figure 6.28. The fitting results of the solute concentration and the mean crystal of the transient MSMPR (10'C, solvent/antisolvent: 60/50) ... 212
Figure 6.29. The fitting results of the solute concentration and the crystal size distribution at steady state (20'C, solvent/antisolvent: 60/50) ... 213
Figure 6.30. The predicted solute concentration and the crystal size distribution against the experimental values obtained in the solvent swing MSMPR experiment ... 215 Figure 6.31. The fitted model with the exponent g and b relaxed against the experimental values obtained in the solvent swing MSMPR experiment ... 216 Figure 6.32. The yield and mean crystal size in single-stage MSMPR increases with increasing total residence tim e ... 2 18 Figure 6.33. Simulation results of the two-stage MSMPR cascade systems adopting two different paths on the phase diagram ... 219 Figure 6.34. The yield and mean crystal size at the final stage as different ratio of the total residence time is assigned to the first stage which contains the solvent composition of 7 5v o l% ... 2 2 0 Figure 6.35. The yield and mean crystal size at the final stage as different ratio of the total residence time is assigned to the first stage of which the temperature is 20'C ... 222
List of Tables
Table 2.1. Experimental Conditions for Unseeded MSMPR Cooling Crystallization Experiments ... . . 3 9 Table 2.2. Experimental Results from the Unseeded Cooling Crystallization of L-glutamic Acid
under Various MSMPR Residence Times and Temperatures ... 41
Table 2.3. Experimental Results for Seeded MSMPR under 25'C ... 43
Table 2.4. Estimated parameters for growth and nucleation at 25'C ... 49
Table 3.1. Experimental Results from Unseeded and Seeded Batch Crystallization ... 68
Table 3.2. Experimental Results from the 5'C Seeded Cooling Crystallization of p-aminobenzoic Acid in Single Stage MSMPR under Various MSMPR Residence Times and Feed C oncentrations ... 70
Table 3.3. Experimental Results of Single Stage MSMPR with Various Stage Temperatures ... 7 3 Table 3.4. Estimated parameters for crystal growth and secondary nucleation of p-aminobenzoic acid (with 95% confidence interval) ... 76
Table 4.1. Polymorphism of the 30'C to 5'C MSMPR cascade ... 104
Table 4.2. Estimated parameters for crystal growth and secondary nucleation of p-aminobenzoic acid (with 95% confidence interval) ... 114
Table 5.1. Batch crystallization of p-aminobenzoic acid ... 128
Table 5.2. Experimental Conditions for the MSMPR Cooling-Antisolvent Crystallization E xperim ents ... 132
Table 5.3. Polymorphism of the metastable and stable steady states ... 137
Table 5.4. Polymorphism of the stable steady state at the transition temperature (15 C) ... 143
Table 5.5. Polymorphism of the metastable and stable steady states ... 149
Table 5.6. Simulation results of the two-stage MSMPR ... 152
Table 6.2 Operating conditions of steady state MSMPR experiments used for parameter estimation of p-aminobenzoic acid ... 174 Table 6.3 Operating conditions of transient MSMPR experiments used for parameter estimation of com pound C ... 175 Table 6.4. Kinetic parameters of a and
P
p-aminobenzoic acid at the solvent-antisolvent composition of 30/70, 20/80 and 10/90 ... 187 Table 6.5. The kinetic parameters of compound C at the solvent-antisolvent composition of 60/50 and the temperature of 10 C ... 212 Table 6.6. The kinetic parameters of compound C at the solvent-antisolvent composition of 60/50 and the temperature of 20'C ... 213 Table 6.7. The kinetic parameters of compound C fitted from the solvent swing experiment from the initial solvent-antisolvent composition of 30/10 to the final composition of 50/10 ... 214 Table 6.8. The kinetic parameters of compound C fitted from the solvent swing experiment while the exponent g and b are relaxed ... 216Chapter 1: Introduction
1.1 Continuous Crystallization of Small Molecule Pharmaceuticals
Crystallization is one of the most widely applied purification and separation methods in the pharmaceutical industry, a crucial unit operation in the production of more than 90% of pharmaceutical active pharmaceutical ingredients (API).1 Mechanistically, crystallization is the
phase transition of molecules from the solution state to the solid state. The orderly structured crystalline form facilitates the rejection of impurity from the solid product. Hence, this process is mainly utilized for purification; it also determines several crucial solid state properties of the API, e.g. crystal size distribution (CSD), crystal morphology and polymorphism. These properties can significantly affect the quality of the final product by influencing the processability in the downstream, such as filtration, drying, and tableting.2 They also directly
impact the stability, permeability and solubility of the API, which in turn determines the bioavailability of the final drug product.3 Indeed, the precise control of the crystallization process is the key objective for pharmaceutical manufacturing. With the regulatory agencies' increasing focus on the "quality by design" principle for pharmaceutical process design, it is crucial to design crystallization processes such that high quality API can be reliably delivered for formulation and ultimately to the patients.
Whilst continuous crystallization gained success in the food, fertilizer as well as other commodity chemicals industries, batch crystallization is still the dominant separation process in pharmaceutical manufacturing.4 Batch crystallization, although appears to be a simple process, actually possesses very complex dynamics. Such complexity in batch dynamics causes high variability between batches, making quality control very costly.5 Out-of-specification product is
not uncommon in batch crystallization. To avoid the heavy loss from rejecting the entire batch, milling and recrystallization units are often added to the manufacturing process.6 In addition, batch process contains other inherited drawbacks such as high labor cost, large requirement for capital investment, and long development time for scaling up. These disadvantages of batch manufacturing result in the current paradigm shift from batch process toward continuous process in pharmaceutical manufacturing. Continuous crystallization takes root in the industry mainly due to two main reasons: control and economics. Continuous process, known as the ultra-lean way of manufacturing, provides more efficient use of solvents, labor, energy, and plant footprint, as well as minimizes capital cost, reactor downtime for maintenance and cleaning.7-10 These
advantages make such process economically highly competitive under large scale manufacture. In the process control point of view, continuous processes provide the possibility of fast response, online measurement and control. The extensive control technologies developed in other industries for continuous manufacturing can be applied directly. In addition, being able to be robustly operated at steady states, continuous manufacturing contain high reproducibility; thus, it reduces the difficulty and cost for quality control. Albeit the great benefits of continuous crystallization, there are also many barriers hindering the transition from batch to continuous processing, notably the lack of understanding of the fundamental dynamics in continuous crystallization, the systematic process design procedure, and the robust control strategy which ensures the consistency and quality of the final drug product.
1.2 Polymorphism in Pharmaceutical Crystallization
Polymorphism is the ability of solid material to adopt different packing arrangement or conformation in the crystal lattice while being molecularly identical. This phenomenon is crucial in the pharmaceutical industry since solid physical properties are highly correlated with its three
dimensional crystal structure. The change from one polymorph to another indicates the change in crystal stability, solubility, compressibility, crystal morphology as well as the nucleation and growth kinetics. The change in these properties can influence the pharmacokinetics for API in the human body, altering the blood level curve of the drug from what is designed originally through formulation." This would undermine the effectiveness of the drug product. The alternation of these physical properties can also impact the manufacturability in the downstream process and the quality of the final product.11 Furthermore, polymorphism has frequent occurrence among organic crystals. Some would suggest that every substance is potentially polymorphous.12 Exaggerated such statement may be, it is uncommon to see massive recall of certain drug due to the occurrence of new polymorph in manufacturing after the drug enters the market. The most recent cases of massive recall, for instance, are Neupro (2008), Coumadin (2010) and Avalide (2010).13 The losses from the recalls are immense. As a result, precautious polymorph screening in the drug development phase and precise crystal polymorph control in manufacture is now a common practice in the industry. Exhaustive and systematic studies on the control of polymorphism in batch crystallization are made to achieve selective crystallization of the desired polymorph. The most direct and effective method for polymorph control is seeding of the desired polymorph under supersaturated solution where nucleation is limited.'4 Other methods such as adding impurities/additives, and specific control on supersaturation can be used to perform polymorph-selective batch crystallization.1-" Whilst there is comprehensive understanding of polymorphism in batch, there are very few, if any, studies that are focus on the control of polymorphism in continuous crystallization process. The fact that continuous processes, in general, possess more controllability as compared with batch processes indicates the great potential of polymorph control in continuous crystallization. The objective of this
thesis, therefore, is to elucidate the polymorphism in continuous crystallization processes and develop control strategies to achieve high polymorph selectivity.
1.3 Motivation and Thesis Outline
1.3.1 Deficiencies of Current Research
1. Systematic study on the polymorph-selective continuous crystallization is not found in the literature. Standard guideline for designing continuous crystallization process with polymorph control is yet to be developed.
2. Current understanding of polymorphism in batch crystallization, although as exhaustive as it is, is insufficient to be applied to the continuous system. Several key areas shall be investigated, to include:
(1) the dynamics of polymorphic transformation in continuous system,
(2) the effect of process operating conditions, e.g. temperature, residence time, and antisolvent addition, on the steady state conditions as well as the start-up dynamics of continuous crystallization.
1.3.2 Objectives
To address the abovementioned issues, the main focus of the present thesis is to elucidate the polymorphism in continuous crystallization processes and develop control strategies to achieve high polymorph selectivity while targeting other control objectives such as yield and crystal size distribution. The objectives of this thesis are:
1. To elucidate the dynamics for continuous crystallization of organic crystals with various polymorphs, identifying the key factors that determine the predominance of specific polymorph in a continuous crystallization process.
2. To conduct systematic research identifying the effect of process operating conditions on the selectivity and yield of the desired polymorph in a continuous crystallization process. Studies on both the final steady state and the start- up dynamics will be performed.
3. To establish mathematical model, namely, the population balance model, which describes the crystallization dynamics of polymorphous substances.
4. To study polymorphism in crystallization process with various continuous crystallizer configurations and under different methods of supersaturation creation.
5. To develop a standard procedure, with least number of experiments needed, which can be used to attain the required kinetic and thermodynamic parameters for mathematical modeling.
6. To selectively crystallize the desired polymorph (can be either the metastable form or the stable form) in the following polymorph systems:
(1) Monotropic system with two or more polymorphs,
(2) Enantiotropic system with two or more polymorphs. The relative stability of the desired polymorph is based on the outlet temperature.
7. To utilize the model for the optimization of the continuous crystallization process achieving the target polymorph selectivity, yield and crystal size distribution.
1.3.3 Thesis Overview
In Chapter 2, we present the study of polymorphism of the monotropic L-glutamic acid in continuous mixed-suspension, mixed-product removal (MSMPR) crystallization. The polymorph dynamic connecting the startup state polymorphism to the steady state polymorphism is identified. Selective crystallization of either the metastable a polymorph and
P
polymorph is achieved in single-stage MSMPR. Seeding, which is the traditional polymorph control strategy, is found to be ineffective in altering the steady state polymorphism. Steady state polymorphic transition from the metastable steady state to the stable steady state was observed for the first time. Chapter 3 presents the polymorph dynamic of the enantiotropic system in continuous crystallization. Using p-aminobenzoic acid as the model compound, we found that the governing dynamics of the process polymorphism can be categorized into three temperature regimes. At temperatures far above the transition point, the steady state polymorphism is mediated by the relative thermodynamics of the polymorphs. Near the transition point, the energy barriers for growth and nucleation of the polymorphs determine the final polymorphism; and below the transition point, the process polymorphism is governed by the kinetic competition between the polymorphs where both the kinetic prefactor terms and the supersaturation terms play an important role. In Chapter 4, we explored the possibility of polymorph control via MSMPR cascade design. Using the two-stage MSMPR as the model system, the design principal is to supply sufficient crystal number and surface area of the desired polymorph from the first stage to help it outcompete the undesired polymorph at the second stage. The polymorph purity of the a p-aminobenzoic acid is successfully improved from Owt% to 75wt%. Other strategies such as solid recycle, liquid recycle and thermal cycling, are also investigated to achieve polymorph control. Chapter 5 investigates the polymorphism in continuous cooling-antisolventcrystallization. High yield is achieved due to the massive surface area provided by the use of antisolvent. The stage temperature is found to be the key process variable determining the steady state polymorphism. The thermodynamics of the polymorphs is the governing factor at temperatures away from the transition point while the solvent effect on the kinetic prefactors mediates the polymorphism near the transition temperature. Combining the comprehensive polymorph studies of the previous chapters, Chapter 6 provides the systematic approach to design and optimize the MSMPR cascade in order to achieve the control of polymorphism while reaching other control objectives, such as yield and crystal size distribution. A decision tree is developed based on the solid properties of the active pharmaceutical ingredient for designing MSMPR experiments to construct the kinetic model of the compound. Process sensitivity and optimization are conducted to determine the operational window and the attainable region of the MSMPR cascade. Chapter 7 more broadly examines the impact of this thesis on continuous crystallization and provides recommendations on future research directions arising from the natural extension of the ideas of this thesis.
References
(1) Variankaval, N., Cote, A. S., Doherty, M. F. AIChE Journal, 2008, 54(7), 1682-1688.
(2) Morissette, S. L., Almarsson, 0., Peterson, M. L., Remenar, J. F., Read, M. J., Lemmo, A. V., Ellis, S., Cima, M. J., Gardner, C. R., Advance Drug Delivery
Review, 2004, 56(3): 275-300.
(3) Tung, H., Paul, E. L., Midler, M., McCauley, J. A., Crystallization of Organic
Compounds: an Industrial Perspective, 2009, Hoboken, NJ: Wiley.
(4) Leuenberger, H. European Journal of Pharmaceutics and Biopharmaceutics, 2001 52(3), 289-296.
(5) Gherras, N., Serris E., Fevotte, G., International Journal of Pharmaceutics, 2012 439(1-2), 109-119.
(6) Plumb, K., Chemical Engineering Research and Design, 2005, 83(6): 730-738. (7) Alvarez, A. J., Myerson, A. S. Crystal Growth & Design, 2010, 10(5), 2219-2228. (8) Cervera-Padrell, A. E., Skovby, T., Kiil, S., Gani, R., Gernaey, K. V., European
Journal of Pharmaceutics and Biopharmaceutics, 2012, 82(2), 437-456.
(9) Vervaet, C., Remon , J. P. Chemical Engineering Science, 2005, 60(14), 3949-3957.
(10) Lindenberg, C. Optimizing the precipitation of organic compounds. Doctoral
Thesis, 2009, Swiss Federal Institute of Technology Zurich, Zurich, Switzerland
(11) Mangin, D., Puel, F., Veesler, S., Organic Process Research & Development, 2009 13, 1241-1253.
(12) Kuhnert-Brandstatter, M., Pharmazie in unserer Zeit, 1975, 4, 131-37
(13) Lee, A. Y., Erdemir, D., Myerson, A. S., Annual Review of Chemical and
Biomolecular Engineering, 2011, 2, 259-280.
(14) Beckmann W., Organic Process Research & Development, 2000, 4, 372-83.
(15) Davey, R. J., Blagden, N., Potts, G. D., Docherty, R., Journal of the American Chemical Society, 1997, 119:1767-72.
(16) Torbeev, V., Shavit, E., Weissbuch, I., Leiserowitz L., Lahav M., Crystal Growth &
(17) Hermanto, M. W., Chiu, M. S., Woo, X. Y., Braatz, R. D., AIChE Journal, 2007,
Chapter 2: Polymorph Dynamic in Continuous Crystallization:
Monotropic System
2.1 Introduction
In recent years, there has been increased interest in moving pharmaceutical manufacturing from batch to continuous processes due to economic and control benefits. 1-2 Current studies on
continuous crystallization of pharmaceuticals has been focused on methods to achieve the desired yield, purity and crystal size distribution (CSD). - Nevertheless, very few studies have been conducted on the control of polymorphism in continuous crystallization.8 Although there are many studies on polymorph dynamics and control in batch systems, there is no systematic study in the continuous framework. The fundamental differences between batch and continuous crystallization, notably, the residence time distribution and nucleation dynamics, indicates that the polymorph control strategies used in batch operation may not be applicable in the continuous systems. The design strategies used in batch systems may not be applicable in continuous crystallization.
In batch crystallization process, primary nucleation is the dominant phenomenon at the beginning of the process when supersaturation is high. Depending on the relative nucleation rates between the polymorphs, either pure metastable polymorph or concomitant polymorph of the organic compound could be obtained in the crystallizer. Crystal growth becomes significant after the first appearance of nuclei. Nucleation is then limited as supersaturation is depleted by crystal mass deposition. As the mother liquor concentration drops below the solubility of the metastable polymorphs due to the growth of the stable polymorph, the mass deposition of the metastable crystals would be limited and the crystals would start to dissolve. This polymorph
conversion phenomenon is known as solvent mediated transformation. With sufficient period of time, all the crystals in the batch would be converted to the thermodynamically most stable form at the final temperature. Many batch polymorph control strategies are developed based on the crystallization dynamics described above. Seeding of the desired polymorph is one of the most direct and common polymorph control strategies in batch systems. It is designed with a carefully controlled desupersaturation profile in order to avoid the primary nucleation of undesired polymorphs.9~11 Additives addition and solvent selection are other common techniques utilized to either inhibit the primary nucleation of the unwanted forms or to enhance/inhibit the solvent mediated transformation toward the most stable form depending on whether or not the most stable polymorph is desired.1 2
-14 Model-free control strategies are also developed based on the batch dynamics. In-situ monitoring of the crystallizer polymorphism is implemented such that if the nucleation of undesired polymorph is detected, the system would respond to re-dissolve the crystals by raising the temperature of the crystallizer. Such strategies ensure that undesired crystals are suppressed throughout the crystallization process.
However,t st ged pd t ies dcvclopcd for the batch systems may not be applicable to the
continuous systems. Unlike batch operation, in continuous crystallization, nucleation (particularly secondary nucleation) is always occurring. In addition, crystals are constantly removed from the crystallizer. Thus, the efficacy of seeding in controlling polymorphism in continuous systems may be low since the initial seeds are washed out after several residence times and new crystals are formed constantly from nucleation. That being said, it is still interesting to investigate whether different seeding conditions can lead to different steady states. In addition, since continuous processes do not operate at equilibrium conditions and must have finite supersaturation at the exit, it is possible for the steady state concentration to be higher than
the solubility of both the most stable polymorph and one or more metastable polymorphs. This is particularly true if the differences in solubility of different polymorphs are small. Thus, in many cases, solvent mediated transformation to the most stable form cannot occur at normal operating conditions.
Two types of continuous crystallizers-the plug flow reactors (PFR) and mixed suspension the mixed product removal (MSMPR) crystallizers-are most commonly used in the pharmaceutical industry. In fact, under the residence time distribution (RTD) point of view, any continuous crystallization process can be represented by the combination of the non-mixing PFR and the perfect mixing MSMPR.1 5 An ideal PFR is dynamically identical to the batch system. We expect it to demonstrate similar polymorph dynamic to a batch process where the steady state polymorphism is determined by the seeding conditions (or nucleation conditions) at the early segment of the PFR and the desupersaturation profile at the latter segment of the PFR. Hence, a more interesting case is to study the polymorphism in MSMPR crystallization. Operating at stable steady states, MSMPR crystallizers are robust against process disturbances and are relatively easy to control. In addition, MSMPR systems allow slow flow rate such that APIs with slow kinetics can be crystallized in the crystallizer as longer residence times can be achieved. Given that crystallizers in batch systems are of the stirred tank type, the MSMPR perhaps affords the most convenient route of transition from batch to continuous operation.
In this chapter, we report the polymorph dynamics in continuous crystallization. We aim to answer several key questions on polymorphism in continuous crystallization:
* How can our knowledge on batch polymorphism be transferred to continuous crystallization?
" What is the dynamic path connecting the startup states and the steady states? And how
are the steady states connected with each other?
" What are the intrinsic factors of the polymorphs and the external process parameters that are most important in determining the steady state polymorphism?
The monotropic L-glutamic acid is selected as the model compound. It contains one metastable a polymorph and one stable
P
polymorph. The compound is widely used for studying batch polymorphism.16-18 Through this study, we elucidated the dynamic path from startup toward multiple steady states among which one is the dynamically most stable steady state. Polymorphic transition from the metastable steady state to the most stable steady state was identified. Our work on the identification of the polymorph dynamic pathway in continuous crystallization shed light on the control of polymorphism in continuous crystallization. In addition, the effect of process parameters, i.e. crystallizer residence time and temperature, on L-glutamic acid polymorphism in MSMPR crystallizer was studied.2.2 Materials & Methods
The monotropic L-glutamic acid is selected as the model compound. This amino acid has two polymorphs: the metastable a form and the most stable
P
form. The most stablep
polymorph (>99% pure) was obtained from Sigma-Aldrich, St. Louis, USA. The metastable a form was produced from fast cooling of aqueous L-glutamic acid solution with a concentration of 40g/kg solvent. The solution, stirring at 300 rpm, was heated up to 85'C until clear and crash cooled to15'C. Primary nucleation occurred shortly after the reactor temperature reached 15'C.
Immediately afterwards, the slurry was filtered, washed and dried. The crystals polymorphism was further verified by X-ray powder diffraction (XRPD) to be pure a polymorph. The XRPD
patterns and the optical microscope images of the two polymorphs are shown in Figure 2.1 and Figure 2.2, respectively. The metastable a crystals are prismatic whereas the most stable
p
crystals are needles.
rj)
1,
I'
_ 1 1 ~i 5 10 15 20 25 30 35 40 2 Theta (degrees) (b) 5 10 15 20 25 30 35 40 2 Theta (degrees) 0 Figure 2.1. X-ray powder diffraction patterns of (a) the metastable (I form and (b) the stablep
form.
'Il
(a)
(b)
Figure 2.2. Optical microscope image of (a) the metastable cx form and (b) the stable
P
form.1I
rj~(a)
ji
The MSMPR crystallizer is setup as illustrated in Figure 2.3. As described in the previous chapter, the main component of the system is a 300 mL glass-jacketed crystallizer (VWR international) with overhead mechanical stirring (IKA) and internal temperature control (Thermo Scientific SC100-A25). The working volume in the crystallizer was 150 mL and was controlled by the position of the outlet. The outlet utilized an intermittent withdrawal scheme which was set to remove all the slurry above the controlled level. Each withdrawal took away 10% of the slurry volume every one tenth of a residence time. This removal scheme ensured that there was no size classification upon withdrawal. The withdrawal rate was sufficiently high such that there was no slurry residual left in the outlet tubing (discharge time was around 30 seconds). The MSMPR system was run for up to 140 hours without clogging issues. The crystal size distribution in the crystallizer was monitored online by focus beam reflectance measurement, FBRM (Lasentec, Mettler Toledo).
L
- - Level control
Figure 2.3. Schematic plot for the MSMPR crystallizer.
Analytical methods described in the previous chapter are used to characterize the solution and solid state of the crystallization process. The mother liquor concentration during MSMPR crystallization was measured using Fourier Transform Infrared Spectroscopy (FTIR). All measurements were conducted offline using a FlowIR instrument from Mettler Toledo. Liquid
samples were filtered and heated to 70'C to ensure no crystallization occurring after being taken out from the crystallizer. The mother liquor was then fed to the FlowIR instrument for concentration measurement. Note that the IR measuring chamber was also controlled at 70'C by a feedback temperature control device to mitigate the effect of temperature on IR spectroscopy. The solute concentration of L-glutamic acid was derived from the measured IR absorbance based on the Lambert-Beer's Law. The absorbance of the carboxylate stretching band at 1402 cm-1 was used for the concentration measurement. Two points baseline (1382 cm-I and 1434 cm') was applied to mitigate the effect of noise. Linear correlation between the solute concentration and the IR absorbance at 1402 cm4 was identified as shown in the calibration line below.
0.02 R2=0.999 8 0.015 0.01 m 0.005 0 10 20 30 40 50
Solute concentration (g/kg solvent)
Figure 2.4. Calibration line of the FTIR absorbance at 1402 cm' against predetermined L-glutamic acid solute concentrations.
The polymorphism of the solids was characterized by Raman spectroscopy and X-ray powder diffraction (XRPD). Although only used as a qualitative measuring tool for L-glutamic acid polymorph mass content, Raman spectroscopy (RAMANRXN2TM HYBRID, Kaiser) was utilized for determining the extent of the polymorph crystallization process. It allows online
monitor of polymorph transformation and crystallization dynamics in MSMPR crystallizer. The characteristic peak for the metastable a form is at 472 cm-I while the characteristic peak for the stable
P
form is at 468 cm-1. The characteristic peaks intensity remains relatively constant upon reaching the steady state.Quantitative measurement for the polymorphic content was determined offline by XRPD, which was obtained using a PANalytical X'Pert PRO Theta/Theta powder X-ray diffraction system with a monochromatic Cu Ka radiation source and nickel filter (?,= 1.5418 A). Solid samples were filtered and dried overnight in a vacuum oven. A total mass of 250mg crystals was weighted out from each sample. The collected samples were then grinded in an agate motor and pestle for about 3 minutes. The grinded crystals were subsequently placed on a zero background disk and scanned from 5-40 degrees. All measurements were conducted with the generator voltage at 45kV and tube current at 40mA. An X'celerator detector was utilized for acquiring the diffraction pattern. The samples were rotated during data collection to reduce the effects of preferred orientation. The polymorph mass content, represented by the mass of a form over the
tJt L CysLUI IIIas, VVas ULAminU firm lf peak, iaiu Uetween the characistic peaks o
a and
3
polymorph. The characteristic peak for the metastable a form is at 260 and that for the stablep
form is at 10'. Standard samples were prepared by mixing pure a andP
crystals. A calibration line was obtained by correlating the peak height ratio against the predetermined polymorph mass content.0.8 R2= 0.9706 ~0.8 -0. 0.4 0.2 0 20 40 60 80 100
a form Mass Content (wt%)
Figure 2.5. Calibration line of the XRPD peak height percentage of a polymorph against known polymorph mass contents.
In addition, focus beam reflectance measurement (FBRM) from Lasentec was applied to track the evolution of particle sizes. The Lasentec S400 probe measured the chord length distribution (CLD) online.
2.3 Experimental Setup
Batch Crystallization Experiment. A batch cooling crystallization experiment was carried out with the same vessel (300 mL glass-jacketed crystallizer) used for the MSMPR. An aqueous L-glutamic acid solution with 40g/kg solvent was prepared by dissolving
P
form L-glutamic acid in deionized water at 85'C. The clear solution was then cooled in the batch to the set-point temperature (25'C or 45'C) and was then held until equilibrium.Continuous Crystallization Experiment. Cooling crystallization was performed using the MSMPR platform described previously. A 40g/kg solvent L-glutamic acid aqueous solution was prepared as feed solution. The feed was kept at 85'C and pumped into the crystallizer at constant
flow rate by a peristaltic pump (Masterflex, Thermo Scientific). The inlet flow rate was set in accordance to the desired residence time. The inlet transfer lines were heated with 85'C hot water to avoid primary nucleation in the feed stream. The MSMPR was operated either with or without seeding. For an unseeded MSMPR, the crystallizer was first operated as a batch with clear L-glutamic acid solution (40g/kg solvent) until primary nucleation occurred and crystals became visible in the suspension. Subsequently, the feed was added to the crystallizer and the intermittent withdrawal scheme was initiated. For a seeded MSMPR, the crystallizer was started up with the addition of either pure
P
or pure a crystals to the clear solution. In this paper, the amount of crystals added is presented as the seed mass compared to the solid mass in an equilibrium batch. The particle size distribution, crystal polymorphism and solute concentration were monitored from startup phase to steady state.2.4 Connecting Batch to Continuous Crystallization
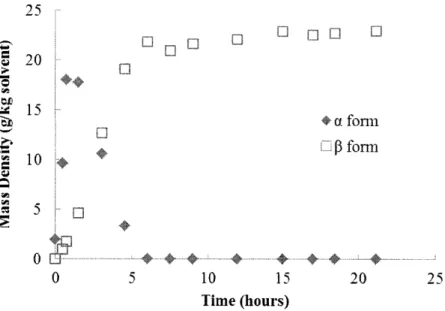
Batch crystallization of L-glutamic acid was used to obtain preliminary knowledge of the compound's polymorph kinetics. The unseeded batch experiments with an initial concentration of 40g/kg solvent were conducted under 25'C and 45'C, respectively. The polymorph mass content at a given time was acquired by XRPD. Combined with the mother liquor concentration data obtained from FTIR measurement, the time evolution of the mass density of the two polymorphs was determined. The experimental results are presented in Figure 2.6 and Figure 2.7.
It was found that in both cases, the metastable a form was the dominating form at the beginning of the crystallization process, indicating that L-glutamic acid follows the Ostwald's rule of stages that the thermodynamically less stable crystal formations are kinetically more favorable during nucleation.19 As the mother liquor (ML) concentration decreased below the solubility of the a
polymorph, the stable
P
crystals grew at the expense of the metastable a crystals. Both batch experiments reached equilibrium shortly after all a crystals were depleted. The time required for complete solvent mediated transformation was found to be shorter at higher temperature-under25'C full transformation to the stable polymorph was about 45 hours while it only took 6 hours
under 45C-a result of a generally faster growth/dissolution kinetics and a larger solubility differences between the metastable and stable polymorphs at higher temperature.
~I.. 35 30 25 20 15 10 5 0 4 Li 0 + a form f3 form 4 10 20 30 Time (hours) 0 40 50 60
Figure 2.6. Mass density profile of a and
P
form L-glutamic acid in 25'C batch crystallization experiment.25 20 . 15 + a fon 43 form 104 0 5 10 15 20 25 Time (hours)
Figure 2.7. Mass density profile of a and f form L-glutamic acid in 45'C batch crystallization experiment.
An interesting question herein is how the batch polymorph dynamic data can be used to facilitate the design of the MSMPR crystallization. A rudimentary way to connect batch to continuous crystallization is to consider each fluid element as a small batch. As shown in Figure 2.8, the fluid element is subject to a particular residenre time distribution curve. In a NSMPR
crystallizer, the residence time distribution is a Poisson distribution of which the mean value is the stage residence time. We can correlate the steady state polymorphism in a single-stage MSMPR to the polymorph ratio in each fluid element exiting the crystallizer. For example, Figure 2.8 (a) shows a fluid element entering as a clear solution into the crystallizer and exiting in a relatively short residence time. Since at the a polymorph is dominating at the early part of a batch process, we expect the a form to be the dominant form in the fluid element at the outlet of the crystallizer. Similarly, in Figure 2.8 (b), if the residence time of the fluid element is longer, we expect a more prevalent presence of the


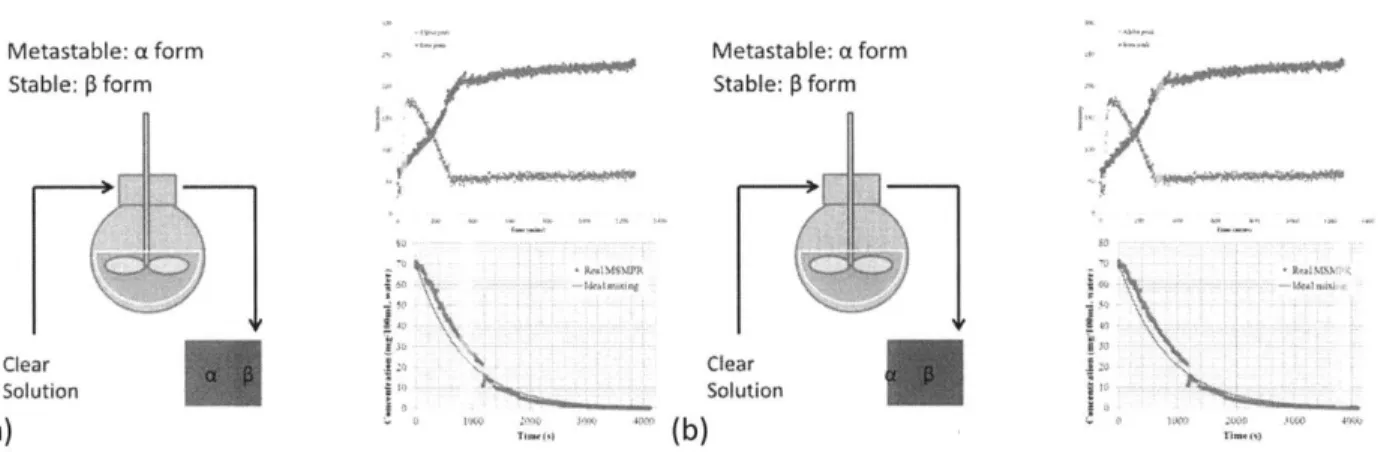


![[PDF] Cours applications en Turbo Pascal pdf | Cours informatique](data:image/gif;base64,R0lGODlhAQABAIAAAP///wAAACH5BAEAAAAALAAAAAABAAEAAAICRAEAOw==)