How do construction sites affect cycling and walking? Perspectives from a panel of experts Juan Torres, Ph.D.
Address for correspondence: Juan Torres, Ph.D., Université de Montréal, Pavillon de la Faculté de l'aménagement, École d'urbanisme et d'architecture de paysage. CP 6128 Succursale Centre-ville, Montréal (Québec) H3C 3J7 Canada. jj.torres.michel@umontreal.ca
Abstract
The impact of traffic disruptions provoked by construction sites can be major, especially for active modes of transportation like walking and cycling. Understanding this impact is necessary, although difficult given the lack of analytic tools for studying ephemeral alterations of the circulation space. The aim of our study was to establish an analytic framework for understanding the impact of construction sites on active transportation. The research included semi-structured interviews with ten experts and a three-round Delphi study during which an expanded group of experts (29 participants) developed a list of influential factors. The length of detours caused by construction sites was the most influential factor on walking; the temporary organization of traffic flow space (sharing the roadway) was the most important for cycling. These results provide guidance for empirical studies, in order to understand and mitigate the negative effects of construction works on active transportation.
Keywords
Introduction
In North America, the deterioration of road infrastructure, sewage and water supply networks has made major road construction projects necessary (Jeyapalan, 2003; Shoup, 2010). This is true for Montréal, where the municipality “has decided to invest massively over the next 10 to 20 years in repairs, given the deteriorated state of its infrastructures” (City of Montreal, 2010). These investments have led to a proliferation of work sites. While construction zones (roads and buildings) are part of the daily experience of citizens, they also disrupt their living space for periods that can extend over several months, if not years, affecting not only their travel in motor vehicles but also, perhaps even more so, their active transportation, whether on foot or on bicycle. At a time when walking and cycling are encouraged as part of a healthy lifestyle (WHO, 2010) and sustainable mobility (ITF, 2011), the transportation issues associated with construction sites deserve our undivided attention. In the city’s Transportation Plan, the City of Montreal (2008) recognizes these issues and makes them a priority for intervention, especially in terms of safety (cf. the section “Travel Safety and Quality of Life – Non-Negotiable!” p. 154). This article focuses on this issue and offers an analytic framework for understanding the potential impacts of road construction sites on active transportation. It is based on research carried out from June 2010 to May 2011 in Quebec, under the auspices of the Social Sciences and Humanities Research Council of Canada (SSHRC) and of the University of Montréal.
1. Research Problem and Theoretical Framework
The advantages of active transportation have been amply documented in recent years, particularly with respect to public health (Frank et al. 2004; Government of Québec, 2010). Furthermore, active transportation is an essential component of public transportation, since people normally begin or end their trips on foot (Vélo Québec, 2009). In the context of a growing reliance on motor vehicles, associated among other things with urban sprawl (Handy et al. 2005), planning environments that are favourable to active transportation is therefore an increasingly important goal for local communities, especially urban communities. Empirical data show, furthermore, that the urban setting can be very favourable to walking and cycling compared to areas with lower population density (particularly in North America) (Ewing and Dumbaugh, 2009). It so happens that it is also in urban settings where one finds the greatest concentration of construction sites and that their impact on people’s mobility can be felt the most.
The study of the influence of construction sites on walking and cycling is part of a wider trend in research on the factors affecting active transportation behaviour. Ecological models (Sallis and Owen 2002) are often adopted to study these multiple factors (individual, social, environmental, etc.). Using these models, a growing literature focuses on the influence of objective qualities of the built environment on walking and cycling. As for walking, systematic literature reviews put forward urban density, mixed land use and distance to non-residential destinations as factors that prove to be important in many studies (Saelens and Handy 2008), as well as the aesthetic attributes of the milieu, the convenience of facilities for pedestrian and the accessibility of destinations (Owen et al. 2004). Alfonzo (2008) also identifies the urban design features related to both accessibility and safety as being associated with the amount of walking that adults do in their neighbourhood. As for cycling, recent research focuses on factors related to land-use patterns and transportation infrastructure: distance to work (Handy and Xing 2011, Broach et al. 2012), connectivity (Titze et al. 2008), availability of separate cycling facilities at heavily travelled roads and intersections and traffic calming in neighbourhoods (Pucher and Buehler
2008) prove to be particularly influential. The aesthetic attributes of the milieu are also an important motivator for cycling (Winters et al. 2011). The systematic reviews of studies addressing active transportation in general show that higher densities, connectivity and mixed land use support walking and cycling (Saellens et al. 2003; Wendel-Vos et al. 2007). In fact, these factors result in variations in terms of distance, which appears in a number of recent studies as a very influential factor on active transportation, especially for children (Pont et al. 2009). These findings are consistent with the three core dimensions of the built environment or “3 Ds” (density, diversity and design) affecting active commuting and, more largely, modal choice (Cervero, 2002; Cervero and Kockelman, 1997; Ewing 2005).
However, these studies focus on the impact of relatively “stable” characteristics of the built environment: land-use patterns, transportation infrastructure and urban design attributes take a relatively long time to change. To our knowledge, few studies exist which look at the impact on mobility of ephemeral environmental changes, such as those associated with construction sites. Yet, while these are ephemeral by definition, they are a constant in the always changing urban landscape. For Glaser (2008), they are even a structural characteristic of human settlements. Major construction sites such as those involved in repairs to urban infrastructures can lead to a major reorganization of traffic and affect local conditions for mobility. In some cases, construction sites make it possible to walk or cycle in spaces inaccessible to motor vehicles. However, they can also cut off routes and create congestion, which are unfavourable conditions for active transportation (Saelens and Handy, 2008). When construction sites are smaller, as in road repairs to a section of a residential street, the effects can be minimal. However, the proliferation of construction sites, further accentuated during the summer season in the context of climates like that of Quebec, can exacerbate their effects, as modest as they may be individually. This being said, construction sites have evolved significantly over the years. With a view to greater social acceptability, builders, local communities and other stakeholders sometimes adopt strategies which aim to attenuate the impact of construction activities on the lives of residents, including with respect to mobility. This is the spirit behind programs like “Considerate Constructors” in the United Kingdom, a national certification system which recognizes the commitment of building entrepreneurs to running their construction sites following a “Good Neighbour Code of Considerate Practice.”1 In Montréal, it is especially during major road work that measures are taken to mitigate the nuisances produced by construction sites.2 It is in order to develop the knowledge necessary to support such measures that, in the summer of 2010, we carried out a study on the characteristics of road construction sites affecting active transportation. Our main goal was to develop an analytical framework that would eventually allow us to evaluate and compare construction sites in order to contemplate construction practices which would increasingly encourage walking and cycling. Our research question was thus formulated as follows: in what way do road construction sites affect walking and cycling, either positively or negatively?
1 The code covers several aspects of how the construction site is run, such as cleanliness, safety, communications with residents, nuisance mitigation, etc.
2 On June 22, 2011, the provincial Ministry of Transportation and the Montréal Metropolitan Community announced the setting up of a committee with the mandate to plan and coordinate roadwork, as well as nuisance mitigation measures, especially with respect to congestion.
We therefore focused on environmental changes brought about by construction sites affecting walking and cycling. We assumed from the start that the opportunities and obstacles offered by construction sites could vary, among other things according to the means of transportation used. Thus a construction site considered by the car-driver a potential obstacle can offer the possibility of a short-cut to the pedestrian.
While users (pedestrians and cyclists) are an important source of information for understanding the role of construction sites on their mobility, existing knowledge nevertheless made it difficult to elaborate a specific research tool to gather data from them. Because of this and the exploratory nature of our study, we decided to turn to experts (Maleki, 2009).3 We sought to identify the environmental factors a group of experts would associate with the impacts (both positive and negative) of construction sites on foot and bicycle travel. The goal was thus to build an analytic framework that could eventually (in future research projects) serve as a reference for inquiring directly with users (pedestrians, cyclists, etc.). The following section describes our exploratory approach in detail.
3. Method
Our study was carried out in two stages: semi-structured interviews with ten experts and a three-round Delphi study with an expanded group of experts (29 participants).All research ethical standards were respected (ethical certificate CPER-10-085-D).
For the first stage, the semi-structured interviews were conducted using an interview guide with a variety of experts from the following areas: urban and transportation planning, civil and transportation engineering, transportation security and public health. We also chose our interviewees in order to get the point of view of the local/provincial government, the professional practice and the active transportation advocacy groups (Table 1).
The interview guide was in two sections: the first included general questions on the participants’ professional ties and expertise; the second elicited their opinion on the characteristics of road construction sites having an influence (positive or negative) on walking or cycling. More precisely, this part of the interview was conducted around the following general question: “From your experience as an expert in [field of expertise], how can construction sites influence (positively or negatively) walking and cycling?”. Interviews were recorded and transcribed for analysis, carried out with the help of conceptualizing categories (Paillé and Mucchielli, 2003). This qualitative method of analysis includes the coding of material (interview transcripts in our case) in order to identify significant concepts in the responses of participants and relate them to each other within an interpretive model. Our interpretive model took the shape of a preliminary list which included 25 grouped factors in four categories according to the nature of their influence on walking and cycling (see Results, Table 2).
The second stage was a Delphi study (Linstone and Turoff, 1975). This kind of study includes “a structuring process for collecting and distilling knowledge from a group of experts by means of a series of questionnaires interspersed with controlled opinion feedback” (Ziglio, 1996: 3). Because participants are anonymous, they feel free to communicate, even within a large group. 3 Experts seemed especially relevant to us because of the knowledge they could provide both on spatial practices and on
According to Linstone and Turoff, (1975 : 4), this is a particularly useful approach for exploratory research when “[t]he problem does not lend to precise analytical techniques but can benefit from subjective judgements on a collaborative basis.” It is also useful for enabling a large number of individuals, representing diverse backgrounds, to interact without the logistical constraints and without the costs of regular face-to-face exchanges.
Used for the first time in the early 1950s in a military context, Delphi studies became widespread in different disciplines as of the 1960s. They can be prospective (forecasting) or descriptive, allowing a diagnosis to be made of a particular problematic situation. Prospective Delphi exercises have been conducted for instance in the field of planning since the early 70s, particularly for land-use (Ewing and Bartholomew 2009) and transportation forecasting (Clay et al. 2012; Cochrane 2012; Rodrigue 2013). The descriptive Delphi method was used in the area of active transportation by Pikora et al. (2003) to identify the environmental determinants of walking and cycling. In their case, the Delphi study involved 34 panel members. The approach proved extremely useful at a time when research on environmental factors affecting walking and cycling was developing. Today, very relevant models exist explaining the influence of the built environment on active mobility (see Section 2). However, with regard to a less documented subject like the influence of construction sites on active mobility, the Delphi approach provides an interesting research strategy.
For our Delphi study, we expanded our initial group of experts in active transportation to whom we submitted successive surveys in order to develop and establish a hierarchy in an initial list of factors which had emerged from the interviews. Out of an initial pool of 80 invited experts, 29 took part in the complete study, including five of the experts interviewed during the first step of the research. We made contact with participants by e-mail to explain the project and submit a consent form to them. Our 29 participants were all experts on active mobility, either because of their professional practice or their academic experience. They represent the perspectives of different disciplines (urban planning, engineering, etc.) and stakeholders (government agencies, private firms, advocacy groups, etc.). Table 1 summarizes their profile.
Table 1. Field of activity and expertise of participants.
Field of activity Expertise
Activities in which participants took part
1 Academic research (local university) Road safety D
2 Academic research (local university) Transportation planning D
3 Academic research (local university) Transportation planning D
4 Academic research (local university) Transportation planning D
5 Academic research (local university) Transportation planning D
6 Advocacy group (local) Active transportation and urban planning D
7 Advocacy group (provincial) Active transportation planning D
8 Advocacy group (provincial) Active transportation planning I
9 Advocacy group (provincial) Cycling planning D
10 Advocacy group (local) Mobility for disabled people D
11 Advocacy group (local) Mobility of the elderly D
12 Advocacy group (provincial) Physical activity D
14 Government (local) Active transportation planning I 15 Government (local) Civil engineer (construction sites management) I
16 Government (local) Urban design D
17 Government (local) Urban planning D
18 Government (local) Urban planning and design I
19 Government (provincial) Cycling planning I & D
20 Government (provincial) Public health D
21 Government (provincial) Public health and urban planning I & D
22 Government (provincial) Road safety D
23 Government (provincial) Road safety D
24 Government (provincial) Transportation engineering I
25 Government (provincial) Signage D
26 Government (provincial) Transportation planning D
27 Professional services (local) Active transportation and urban planning D 28 Professional services (provincial) Active transportation and urban planning D 29 Professional services (provincial) Active transportation and urban planning I & D 30 Professional services (provincial) Active transportation security I & D
31 Professional services (provincial) Traffic management D
32 Professional services (provincial) Transportation engineering I & D
33 Public transport agency (local) Public transportation D
34 Public transport agency (local) Public transportation and urban planning D Activities: I = Interview; D = Delphi study
“Local” refers to the Montreal metropolitan area; “provincial” refers to Quebec, in Canada.
Our Delphi study involved three rounds of e-mail exchanges to define the influential factors (1st round), weighting them (2nd round) and validating the weights (3rd round). During the first round, we asked each participant to check or, where appropriate, suggest modifications to the preliminary list of factors affecting walking and cycling which had emerged from the first stage of our research (the semi-structured interviews). For each factor on the list, we included a description as well as one or several concrete examples. Table 3 (see the Results section) shows the results from the responses of participants and includes the descriptions and examples used for illustrating each factor.
During the second round of the study, we submitted Table 3 to participants. We also submitted two evaluation grids, each with the same 17 factors identified. On the first grid, participants had to indicate the relative influence of each factor on walking. We asked each participant to give a score between 1 and 10 to the influence of each factor, 1 being the lowest influence on walking and 10 the highest influence on walking. On the second grid, participants had to proceed in the same way, but with regard to the influence of each factor on cycling. Participant responses were compiled. We calculated the average for the estimated influence of each factor on each mode. For example, we calculated the average of the scores given to the influence of the factor "length of detours" on walking and then we calculated the average of the scores given to the influence of the same factor on cycling.
In the third (last) round of the Delphi study, we sent each expert the two evaluation grids, this time with the average score obtained by each factor from round 2 (i.e. its relative influence on
walking or cycling) and the provisional rankings based on these averages (the highest rank for the highest average score). In light of these average scores and rankings, we asked participants to confirm or modify the scores they previously gave (second round). Each participant could therefore react to these provisional results in order to influence the final averages and rankings. Responses were compiled and analysed. We recalculated the average for the estimated influence of each factor on each mode. For each average, we also calculated the standard deviation in order to make clear which factors essentially achieved consensus in terms of their relative importance (i.e., to which factors the experts had assigned similar scores).
4. Results
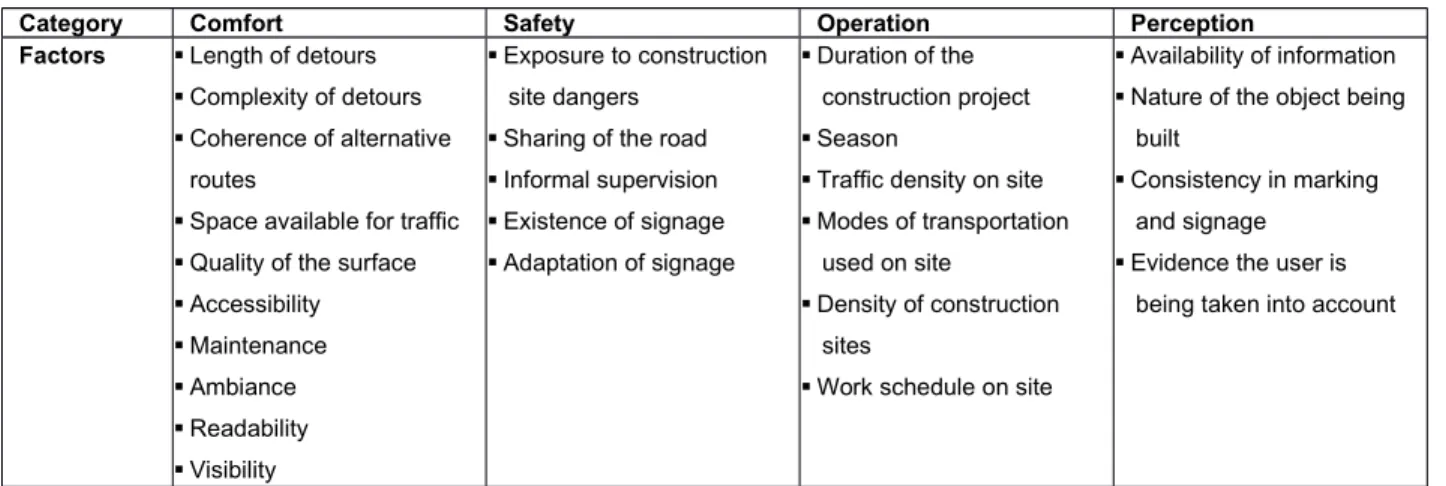
Table 2 shows the factors which emerged from the qualitative analysis of interviews carried out during the first stage of our research. There are 25 factors grouped into four thematic categories. One of these categories is comfort, with factors that determine the easiness and convenience of movement; safety refers to exposure to road hazards or attack; operation includes factors related to the physical and temporal context of the construction site; finally, perception brings together factors that could affect how users perceive the construction site. Besides this list, the analysis of the interviews showed the experts to be concerned about the cumulative effects of factors which could exacerbate their individual effects. For example, the impact of a long detour could be even more important if the travel had to take place on road surfaces in poor shape. In what the experts said, we also noted particular concern for “vulnerable” users, such as children, people with disabilities and the elderly. For these groups of street-users, certain factors would be of major importance.
Table 2. Preliminary list of construction site factors identified by experts as potentially influent on walking and cycling.
Category Comfort Safety Operation Perception
Factors Length of detours Complexity of detours Coherence of alternative
routes
Space available for traffic Quality of the surface Accessibility Maintenance Ambiance Readability Visibility Exposure to construction site dangers
Sharing of the road Informal supervision Existence of signage Adaptation of signage Duration of the construction project Season
Traffic density on site Modes of transportation
used on site
Density of construction sites
Work schedule on site
Availability of information Nature of the object being
built
Consistency in marking and signage
Evidence the user is being taken into account
In light of the comments gathered during the first round of the Delphi study, we excluded our initial categories. In effect, according to the participants, these categories posed several problems in that they overlapped, making it difficult to evaluate and create a hierarchy for each factor. For example, the factor “quality of the surface” could be important (although in different ways) both in terms of comfort and of safety. The repetition of factors in different categories, for its part,
made the process of consulting participants too laborious. It was in this spirit that the use of a list of factors without categories or repetitions proved more appropriate.
We then simplified the list in three ways: a) eliminating redundant factors, b) splitting up factors which were too inclusive, and c) redefining factors to make their meaning clearer and more neutral. The factor “complexity/simplicity of alternative routes” illustrates well our intent to be neutral in naming factors, allowing us to come back to the initial idea of considering the construction site not only as an obstacle (complexity of routes), but also as an opportunity (simplicity of routes) for walking and cycling. Finally, we made the description of each factor more explicit and provided additional examples (Table 3).
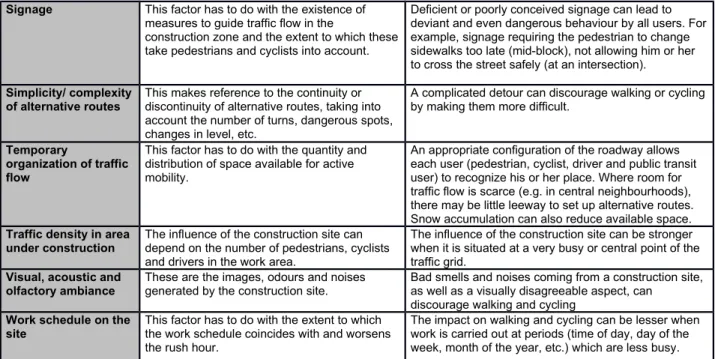
Table 3. Potential construction site factors influent on walking and cycling, revised after the first Delphi round and provided to experts in the second and third rounds (in alphabetical order).
Factor Definition Examples
Availability of information
Access to information on the nature of the site, the estimated duration of the work, possible disruptions, a contact number in case of problems, etc.
Information (on site or elsewhere) allows passers-by to understand the nature of the construction site and adjust their tolerance for nuisances. Appropriate information can contribute to the acceptability of a site.
Cleanliness/dirtiness of surfaces
This factor has to do with the different surfaces pedestrians and cyclists are in contact with (ground, walls, temporary ceilings, etc.).
A dirty construction site (muddy ground, dusty barriers, etc.) can discourage pedestrians or cyclists from coming through.
Clear or obstructed views
This refers to the possibility of seeing and being seen in the construction site.
The absence of visual obstacles and hiding places can facilitate walking and cycling in the construction area.
Density of
construction sites This factor speaks to the number, the importance and the proximity of sites. A large number of construction sites in a given area (in a neighbourhood, along a roadway, etc.) can exacerbate their individual influence.
Duration of the work This factor has to do with the duration of the construction which can last several days to several months, even years.
The impact of the construction site and the long-term effects on mobility can vary according to the duration of the work.
Formal and informal supervision
This refers both to the presence of supervisors and to how the site is run.
Maintaining commercial activity while construction proceeds and the presence of supervisors can reassure passers-by.
Length of detours Determined by the permeability of the network, the size, the shape and the location of the construction site, etc.
A detour occasioned by construction work can discourage walking and cycling, especially when the detour is relatively long with respect to the distance travelled.
Lighting This has to do with how lit up the work site is, especially at night time.
The lack of lighting on a construction site can discourage walking and cycling.
Protection from/exposure to construction site dangers
This factor has to do with the degree to which pedestrians and cyclists are protected from or exposed to the activities or materials of the construction site.
Protective barriers and sheets can shelter pedestrians from trucks, explosions or falling materials on the construction site.
Regularity/ irregularity of surfaces
This refers to the presence or absence of anomalies on surfaces pedestrians and cyclists are in contact with.
Holes in the ground, protruding plates of metal, loose gravel and stakes or nails which stick out from protective walls are examples of irregularities which can make active transportation difficult, especially for persons with a mobility impairment.
Season This refers to the period of the year when the work is carried out.
Construction work can have a great impact during seasons when active transportation is most used. Work sites can also accentuate traffic difficulties caused by snow accumulation.
Signage This factor has to do with the existence of measures to guide traffic flow in the
construction zone and the extent to which these take pedestrians and cyclists into account.
Deficient or poorly conceived signage can lead to deviant and even dangerous behaviour by all users. For example, signage requiring the pedestrian to change sidewalks too late (mid-block), not allowing him or her to cross the street safely (at an intersection).
Simplicity/ complexity
of alternative routes This makes reference to the continuity or discontinuity of alternative routes, taking into account the number of turns, dangerous spots, changes in level, etc.
A complicated detour can discourage walking or cycling by making them more difficult.
Temporary
organization of traffic flow
This factor has to do with the quantity and distribution of space available for active mobility.
An appropriate configuration of the roadway allows each user (pedestrian, cyclist, driver and public transit user) to recognize his or her place. Where room for traffic flow is scarce (e.g. in central neighbourhoods), there may be little leeway to set up alternative routes. Snow accumulation can also reduce available space.
Traffic density in area under construction
The influence of the construction site can depend on the number of pedestrians, cyclists and drivers in the work area.
The influence of the construction site can be stronger when it is situated at a very busy or central point of the traffic grid.
Visual, acoustic and olfactory ambiance
These are the images, odours and noises generated by the construction site.
Bad smells and noises coming from a construction site, as well as a visually disagreeable aspect, can
discourage walking and cycling
Work schedule on the site
This factor has to do with the extent to which the work schedule coincides with and worsens the rush hour.
The impact on walking and cycling can be lesser when work is carried out at periods (time of day, day of the week, month of the year, etc.) which are less busy.
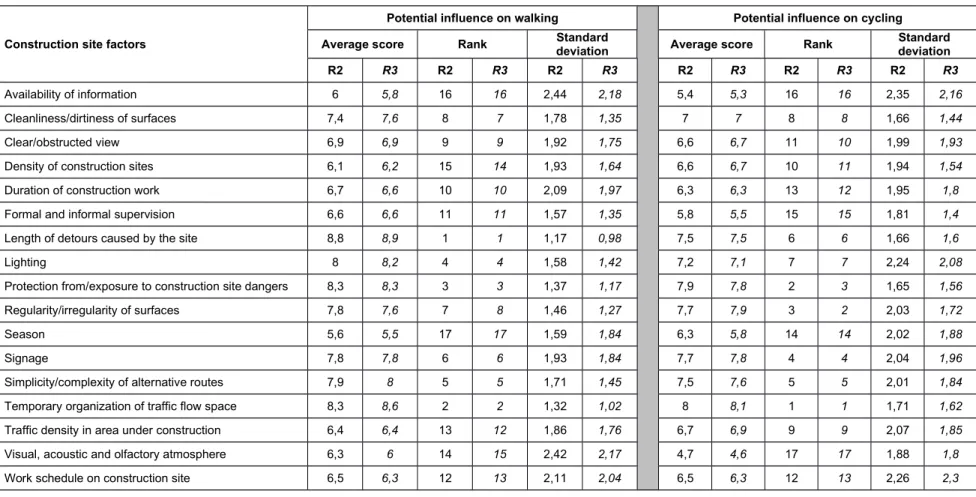
Table 4 includes two sections, one for walking and the other for cycling. In each section, we show three values calculated for each factor from the responses of experts during the second and third rounds of the Delphi study: average score, rank and standard deviation. Average score was calculated from the scores given by participants according to the estimated influence of each factor on walking or cycling, on a 1 to 10 scale (see the Method section). A high score meant a relatively greater influence. Ranking is based on the factors’ average scores (in the first rank is the factor with the highest average score). Finally, standard deviation expresses how much the scores allotted by experts vary from the average.
Table 4. Average scores, ranking and standard deviation for each factor with potential influence on walking and cycling, from values provided by 29 experts in rounds 2 and 3 of the Delphi study.
Construction site factors
Potential influence on walking Potential influence on cycling Average score Rank Standarddeviation Average score Rank Standarddeviation
R2 R3 R2 R3 R2 R3 R2 R3 R2 R3 R2 R3
Availability of information 6 5,8 16 16 2,44 2,18 5,4 5,3 16 16 2,35 2,16
Cleanliness/dirtiness of surfaces 7,4 7,6 8 7 1,78 1,35 7 7 8 8 1,66 1,44
Clear/obstructed view 6,9 6,9 9 9 1,92 1,75 6,6 6,7 11 10 1,99 1,93
Density of construction sites 6,1 6,2 15 14 1,93 1,64 6,6 6,7 10 11 1,94 1,54
Duration of construction work 6,7 6,6 10 10 2,09 1,97 6,3 6,3 13 12 1,95 1,8
Formal and informal supervision 6,6 6,6 11 11 1,57 1,35 5,8 5,5 15 15 1,81 1,4
Length of detours caused by the site 8,8 8,9 1 1 1,17 0,98 7,5 7,5 6 6 1,66 1,6
Lighting 8 8,2 4 4 1,58 1,42 7,2 7,1 7 7 2,24 2,08
Protection from/exposure to construction site dangers 8,3 8,3 3 3 1,37 1,17 7,9 7,8 2 3 1,65 1,56
Regularity/irregularity of surfaces 7,8 7,6 7 8 1,46 1,27 7,7 7,9 3 2 2,03 1,72
Season 5,6 5,5 17 17 1,59 1,84 6,3 5,8 14 14 2,02 1,88
Signage 7,8 7,8 6 6 1,93 1,84 7,7 7,8 4 4 2,04 1,96
Simplicity/complexity of alternative routes 7,9 8 5 5 1,71 1,45 7,5 7,6 5 5 2,01 1,84
Temporary organization of traffic flow space 8,3 8,6 2 2 1,32 1,02 8 8,1 1 1 1,71 1,62
Traffic density in area under construction 6,4 6,4 13 12 1,86 1,76 6,7 6,9 9 9 2,07 1,85
Visual, acoustic and olfactory atmosphere 6,3 6 14 15 2,42 2,17 4,7 4,6 17 17 1,88 1,8
Work schedule on construction site 6,5 6,3 12 13 2,11 2,04 6,5 6,3 12 13 2,26 2,3
R2= Second round R3= Third round
Note: For each factor, the average score was calculated from the scores given by participants according to the weight of the influence of each factor on walking or cycling, on a 1 to 10 scale. A high score meant a relatively greater influence. Ranks are based on factors’ average scores. Scores were rounded to the nearest decimal. Following the Delphi method, average scores and ranks from round 2 were supplied to participants before round 3.
As of the second round we observed a difference between those factors which were most important (with higher average scores) for walking and cycling. The length of detours caused came at the head of the list as the most important factor for walking, while it was in sixth place for cycling. The temporary organization of traffic space proved to be the most important factor for cycling. The third round gave similar results, with only three reversals in the ranking. These reversals prove to be more important for cycling, since one of them is for factors in second and third place: “Regularity/irregularity of road surfaces” (moving to second place) and “Protection from/exposure to work place dangers” (slipping to third place).
Calculating standard deviation based on average scores allows us to identify the degree of consensus with respect to each factor’s importance. For walking, the strongest consensus (least standard deviation) is found for the most important factors. For cycling, the tendency is less clear. This being said, in both cases the factor “availability of information” raised the greatest divergences of opinion (the greatest standard deviation). Finally, between the second and third rounds of the Delphi study, we observed an increase in consensus on the scores allocated to all factors, with the exception of “season,” which did, however, remain in last place in importance for walking.
That said, despite increasing consensus, standard errors remain important, making the gaps between contiguous rankings not significant (Figures 1 and 2). However, we can observe a difference between the top four factors with potential influence on walking and the last seven, and between the top eight and the last two. We can also observe a significant difference between the top four and the last four factors with potential influence on cycling.
Figure 1. Average scores and standard errors for each factor with potential influence on walking Le ng th o f d et ou rs c au se d by th e si te Te m po ra ry o rg an iz at io n of tr af fi c fl ow s pa ce Pr ot ec ti on fr om /e xp os ur e to c on st ru ct io n si te d an ge rs Li gh ti ng Si m pl ic it y/ co m pl ex it y of a lt er na tiv e ro ut es Si gn ag e Cl ea nl in es s/ di rt in es s of s ur fa ce s R eg ul ar it y/ ir re gu la ri ty o f s ur fa ce s Cl ea r/ ob st ru ct ed v ie w D ur at io n of c on st ru ct io n w or k Fo rm al a nd in fo rm al s up er vi si on Tr af fi c de ns it y in a re a un de r co ns tr uc ti on W or k sc he du le o n co ns tr uc ti on s it e D en si ty o f c on st ru ct io n si te s V is ua l, ac ou st ic a nd o lf ac to ry a tm os ph er e A va il ab il it y of in fo rm at io n Se as on 0 1 2 3 4 5 6 7 8 9 10
Figure 2. Average scores and standard errors for each factor with potential influence on cycling Te m po ra ry o rg an iz at io n of tr af fi c fl ow s pa ce R eg ul ar it y/ ir re gu la ri ty o f s ur fa ce s Pr ot ec ti on fr om /e xp os ur e to c on st ru ct io n si te d an ge rs Si gn ag e Si m pl ic it y/ co m pl ex it y of a lt er na tiv e ro ut es Le ng th o f d et ou rs c au se d by th e si te Li gh ti ng Cl ea nl in es s/ di rt in es s of s ur fa ce s Tr af fi c de ns it y in a re a un de r co ns tr uc ti on Cl ea r/ ob st ru ct ed v ie w D en si ty o f c on st ru ct io n si te s D ur at io n of c on st ru ct io n w or k W or k sc he du le o n co ns tr uc ti on s it e Se as on Fo rm al a nd in fo rm al s up er vi si on A va il ab il it y of in fo rm at io n V is ua l, ac ou st ic a nd o lf ac to ry a tm os ph er e 0 1 2 3 4 5 6 7 8 9
5. Conclusion and applications
The formulation of the factors on this list remains embryonic. Follow-up work in order to explore the points of view of pedestrians and cyclists or to assess the actual impact of the identified factors on their daily commuting activities would be worth pursuing. This being said, our results may facilitate such work, eventually providing guidance in order to mitigate the negative effects of construction works on active transportation.
Our results confirm several studies reviewed by Saelens and Handy (2008) and Pont et al. (2009) which identify distance as an important determinant for walking to precise destinations on a daily basis. The highest ranked factor with potential influence on walking is indeed the length of the detours caused by construction sites, especially since such detours can be major with respect to pedestrian trips. For example, for an 800 m trip (about a 10-minute walk), going around a one
hectare block because of a closed street in a rectangular grid can mean an additional 25% to the distance traveled. Furthermore, it can be seen that the same factor is much less important for bicycle trips, which are normally longer (Vélo Québec, 2009), making the detours, therefore, relatively less significant. Note, however, that distance remains an influent determinant of cycling as well (Handy and Xing 2011, Broach et al. 2012). Evidence from Metro Vancouver (Winters et al. 2011) actually suggests that cycling commuters do not detour far off the shortest route and, when they do, it is for using routes with more bicycle facilities. We can observe that the length of the detour caused by the construction site and regularity/irregularity of road surfaces show the greatest disparities in classification by mode: differences in rank of five and six places respectively between walking and cycling. Although the average scores are similar, these ranking differences (i.e. the relative hierarchy of factors with potential influence) confirm the idea that the impact of construction sites varies according to the type of travel.
Besides the length of the detours caused by construction, the two most important factors for pedestrians have to do with the temporary organization of traffic space (sharing the road) and protection/exposure to construction site dangers. In both cases, reference is made to traffic flow and the way pedestrians are confronted in this space with car and bicycle traffic, as well as the materials and activities of the construction site. These factors thus refer to travel safety which, whether real or perceived, is an important determinant of walking (Alfonzo et al. 2008), especially for children (McMillan, 2005). For cycling, temporary organization of traffic space and protection/exposure to construction site dangers are also highly ranked (1st and 3rd place respectively). This is consistent with the results from a case-crossover study in Vancouver and Toronto (Teschke et al. 2012), where construction affecting transportation corridors was associated to increased risks of injuries to bicyclists (while the risks were lower on streets without parked cars, with bike lanes and in local streets).
It is important to note that the construction site disrupts the physical framework of trips taken, if only temporarily. It therefore directly affects the third “D” or the “design” dimension of the built environment affecting transportation, as defined by Cervero and Kockelman (1997). More precisely, the construction site disrupts the urban design qualities related to walkability, as defined by Ewing et al. (2006). Factors with spatial characteristics do find themselves fairly high up in the rankings. Normally they are given higher weight than factors linked to time (duration of construction, work schedules, etc.). Surprisingly, the season the work takes place turned out to be the least important factor for walking (and the 4th least important for cycling), despite the fact that the concentration of construction sites in the summer and difficulties getting around in areas under construction because of snow accumulation in winter seemed to us from the interviews to be significant problems. It should be made clear that while low in the rankings, this factor did receive averages of more than five points out of ten in importance. It is probably a factor that accentuates other problems in terms of travel safety and comfort. Its importance could also be viewed differently by actual walkers and bicycle riders, or simply during a site assessment. We can affirm that if construction sites are to be used as opportunities to encourage walking, alternative routes must be carefully designed in order to minimize detours and to offer an appropriate environment to pedestrians. This is a major challenge, since even without construction sites, walking is no longer the dominant mode of transportation even for short trips. In the Montréal metropolitan area, for example, 55% of trips under 1.6 km in length are motorised (Morency et al. 2007). In this context, any obstacle created by construction work
becomes an additional motivation to use motorized travel, particularly the car. The car does indeed become especially attractive since the driver can easily ignore his or her immediate surroundings and the effect of the detour can be much less onerous.
The relationship between the different factors identified is very important, as they can have major cumulative effects. A study focusing on such effects on the basis of field observations could give us a better understanding of the influence of construction sites on active modes of transportation, especially for children and people with reduced mobility.
References
Alfonzo M, Boarnet MG, Day K, McMillan T, Anderson CL. 2008. The Relationship of Neighbourhood Built Environment Features and Adult Parents' Walking. Journal of Urban Design 13 (1): 29-51.
Broach J, Dill J, Gliebe J. 2012. Where do cyclists ride? A route choice model developed with revealed preference GPS data. Transportation Research Part A: Policy and Practice 46 (10): 1730–1740.
Cervero R. 2002. Built Environments and Mode Choice: Toward a Normative Framework. Transportation Research D 7 (4): 265–284.
Cervero R, Kockelman K. 1997. Travel Demand and the 3Ds: Density, Diversity and Design. Transport Research D 2 (3):199-219.
City of Montreal. 2008. Plan de transport 2008 – Réinventer Montréal. Ville de Montréal.
City of Montreal. 2010. Des investissements massifs. Info-Travaux web page: http://ville.montreal.qc.ca/portal/page?
_pageid=7097,71511574&_dad=portal&_schema=PORTAL [last accessed : 16 September 2010].
Clay M, White W, Holley P, Curry M. 2012. Data Development for Implementing Integrated Land-use and Transportation Forecasting Models in Medium-sized Metropolitan Planning Organizations. Planning Practice & Research 27 (2): 263-274.
Cochrane K. 2012. Freight on Transit Delphi Study. Master of Applied Science. Department of Civil Engineering, University of Toronto.
Ewing R. 2005. Can the Physical Environment Determine Physical Activity Levels? Exercise and Sport Sciences Reviews 33 (2): 69-75.
Ewing R, Dumbaugh E. 2009. The Built Environment and Traffic Safety: A Review of Empirical Evidence. Journal of Planning Literature 23 (4): 347-367.
Ewing R, Bartholomew K. 2009. Comparing Land Use Forecasting Methods: Expert Panel Versus Spatial Interaction Model. Journal of the American Planning Association 75 (3): 343-357.
Ewing R, Handy S, Brownson RC, Clemente O, Winston E. 2006. Identifying and Measuring Urban Design Qualities Related to Walkability. Journal of Physical Activity and Health, 3 (Sup 1): 223-240.
Frank LD, Andresen MA, Schmid TL. 2004. Obesity Relationships with Community Design, Physical Activity, and Time Spent in Cars. American Journal of Preventive Medicine 27 (2): 87-96.
Glaser MA. 2008. Construction Site: Metamorphoses in the City. Baden: Lars Müller.
Gouvernement du Québec. 2010. Saines habitudes de vie. Web page on the Quebec portal: www.saineshabitudesdevie.gouv.qc.ca [last accessed: 12 September 2010].
Handy S, Cao X, Mokhtarian PL. 2005. Correlation or Causality Between the Built Environment and Travel Behavior? Evidence from Northern California. Transportation Research Part D: Transport and Environment 10 (6): 427-444.
Handy S, Xing Y. 2011. Factors Correlated with Bicycle Commuting: A Study in Six Small U.S. Cities. International Journal of Sustainable Transportation 5 (2): 91-110.
ITF – International Transport Forum. 2011. Transport for Society. 2011 Annual Summit Highlights. OECD.
Jeyapalan JK. 2003. The Future of America's Water is in Our Hands. In ASCE Proceedings of International Conference on Pipeline Engineering and Construction 2003. Reston, VA: ASCE.
Linstone HA, Turoff M. 1975. The Delphi Method. Techniques and Applications. London: Addison-Wesley Publishing Company.
Maleki K. 2009. Méthodes quantitatives de consultation d’experts. Delphi, Delphi public, Abaque de Régnier et impacts croisés. Paris: Publibook.
McMillan, T. 2005. Urban Form and a Child's Trip to School: The Current Literature and a Framework for Future Research. Journal of Planning Literature 19: 440-456.
Morency C, Demers M, Lapierre L. 2007. Les « Pas en réserve » : une mesure originale du potentiel d’activité physique dans la mobilité quotidienne. 75th Congress of the Association francophone pour le savoir (ACFAS): Trois-Rivières.
Owen N, Humpel N, Leslie E, Bauman A, Sallis JF. 2004. Understanding Environmental Influences on Walking; Review and Research Agenda. American Journal of Preventive Medicine 27 (1): 67-76.
Paillé P, Mucchielli A. 2003. L’analyse qualitative en sciences humaines et sociales. Paris: Armand Colin.
Pikora T, Giles-Corti B, Bull F, Jamrozik K, Donovan R. 2003. Developing a Framework for Assessment of the Environmental Determinants of Walking and Cycling. Social Science & Medicine 56, 1693–1703.
Pont K, Ziviani J, Wadley D, Bennett S, Abbott R. 2009. Environmental Correlates of Children’s Active Transportation: A Systematic Literature Review. Health & Place 15: 849–862. Pucher J, Buehler R. 2008. Making Cycling Irresistible: Lessons from The Netherlands, Denmark
and Germany. Transport Reviews: A Transnational Transdisciplinary Journal 28 (4): 495-528.
Rodrigue J-P. 2013. The Geography of Transport Systems (3rd Edition). New York: Routledge. Saelens B, Handy SL. 2008. Built Environment Correlates of Walking: A Review. Medicine &
Science in Sports & Exercise 40 (7): 550-566.
Saelens B, Sallis J, Frank L. 2003. Environmental Correlates of Walking and Cycling: Findings From the Transportation, Urban Design, and Planning Literatures. Environment and Physical Activity 25 (2): 80-91.
Sallis J, Owen N. 2002. Ecological Models of Health Behavior. In Glanz K, Rimer BK, and Lewis FM. (eds.). Health Behavior and Health Education: Theory, Research, and Practice. San Francisco: Jossey-Bass, pp. 462-484.
Shoup D. 2010. Putting Cities Back on Their Feet. Journal of Urban Planning and Development: 136(3), 225-234.
Teschke K, Harris M A, Reynolds C, Winters M, Babul S, Chipman M, Cusimano M, Brubacher J, Hunte G, Friedman S, Monro M, Shen H, Vernich L, Cripton P. 2012. Route Infrastructure and the Risk of Injuries to Bicyclists: A Case-Crossover Study. American Journal of Public Health 102(12): 2336–2343.
Titze S, Stronegger WJ, Janschitz S, Ojad P. 2008. Association of Built-Environment, Social-Environment and Personal Factors with Bicycling as a Mode of Transportation among Austrian City Dwellers. Preventive Medicine 47: 252-259.
Vélo Québec. 2009. Planning and Design for Pedestrians and Cyclists. A Technical Guide. Montreal: Vélo Québec.
Wendel-Vos W, Droomers M, Kremers S, Brug J, van Lenthe F. 2007. Potential Environmental Determinants of Physical Activity in Adults: A Systematic Review. Obesity Reviews 8: 425-440.
Winters M, Davidson G, Kao D, Teschke K. 2011. Motivators and deterrents of bicycling: comparing influences on decisions to ride. Transportation 38: 153-168.
Winters M, Teschke K, Grant M, Setton E, Brauer M. 2011. How far out of the way will we travel? Built environment influences on route selection for bicycle and car travel. Transportation Research Record 2190:1-10.
WHO – World Health Organization. 2010. Global Recommendations on Physical Activity for Health. World Health Organization.
Ziglio E. 1996. The Delphi Method and its Contribution to Decision-Making. In M. Adler & E. Ziglio Gazing into the Oracle: The Delphi Method and its Application to Social Policy and Public Health. London: Jessica Kingsley Publishers.