HAL Id: hal-00301372
https://hal.archives-ouvertes.fr/hal-00301372
Submitted on 10 Aug 2004HAL is a multi-disciplinary open access
archive for the deposit and dissemination of sci-entific research documents, whether they are pub-lished or not. The documents may come from teaching and research institutions in France or abroad, or from public or private research centers.
L’archive ouverte pluridisciplinaire HAL, est destinée au dépôt et à la diffusion de documents scientifiques de niveau recherche, publiés ou non, émanant des établissements d’enseignement et de recherche français ou étrangers, des laboratoires publics ou privés.
Long-range transport of ozone and related pollutants
over the North Atlantic in spring and summer
S. A. Penkett, M. J. Evans, C. E. Reeves, Kathy S. Law, P. S. Monks, S. J. B.
Bauguitte, J. A. Pyle, T. J. Green, B. J. Bandy, G. Mills, et al.
To cite this version:
S. A. Penkett, M. J. Evans, C. E. Reeves, Kathy S. Law, P. S. Monks, et al.. Long-range transport of ozone and related pollutants over the North Atlantic in spring and summer. Atmospheric Chemistry and Physics Discussions, European Geosciences Union, 2004, 4 (4), pp.4407-4454. �hal-00301372�
ACPD
4, 4407–4454, 2004
Long-range transport of ozone and related
pollutants S. A. Penkett et al. Title Page Abstract Introduction Conclusions References Tables Figures J I J I Back Close Full Screen / Esc
Print Version Interactive Discussion
© EGU 2004
Atmos. Chem. Phys. Discuss., 4, 4407–4454, 2004 www.atmos-chem-phys.org/acpd/4/4407/
SRef-ID: 1680-7375/acpd/2004-4-4407 © European Geosciences Union 2004
Atmospheric Chemistry and Physics Discussions
Long-range transport of ozone and
related pollutants over the North Atlantic
in spring and summer
S. A. Penkett1, M. J. Evans2, C. E. Reeves1, K. S. Law2, P. S. Monks3, S. J. B. Bauguitte1, J. A. Pyle2, T. J. Green1, B. J. Bandy1, G. Mills1,
L. M. Cardenas1, H. Barjat4, D. Kley5, S. Schmitgen5, J. M. Kent4, K. Dewey4, and J. Methven6
1
University of East Anglia, School of Environmental Sciences, Norwich NR4 7TJ, UK 2
University of Cambridge, Centre for Atmospheric Science, Lensfield Road, Cambridge CB2 1EW, UK
3
University of Leicester, School of Chemistry, University Road, Leicester LE1 7RH, UK 4
Meteorological Research Flight, Bldg Y46, DRA, Farnborough, Hants. GU14 0LX, UK 5
Kernforschungsanlage, Institut f ¨ur Chemie (ICH 2), Postfach 1913, 52425 J ¨ulich, Germany 6
University of Reading, Department of Meteorology, PO Box 243 Earley Gate, Reading RG6 6BB, UK
Received: 13 May 2004 – Accepted: 30 June 2004 – Published: 10 August 2004 Correspondence to: S. A. Penkett ([email protected])
ACPD
4, 4407–4454, 2004
Long-range transport of ozone and related
pollutants S. A. Penkett et al. Title Page Abstract Introduction Conclusions References Tables Figures J I J I Back Close Full Screen / Esc
Print Version Interactive Discussion
© EGU 2004
Abstract
This paper presents strong experimental evidence for a major perturbation in ozone concentrations over large parts of the North Atlantic Ocean from the surface to 8 km associated with continental pollutants. The evidence was gathered in the course of 7 flights by the UK Meteorological Office C-130 aircraft based on the Azores, and 4 ferry
5
flights between the UK to the Azores in spring and summer 1997 as a component of the NERC-funded ACSOE project. The total latitude range covered was approximately 55◦N–25◦N, and the longitude range was approximately 0◦ to 40◦W. Many profiles were made between the sea surface and altitudes up to 9 km to survey the composition of the marine atmosphere.
10
The C-130 aircraft was comprehensively equipped to measure many chemical and physical parameters along with standard meteorological instrumentation. Thus it was able to measure ozone and speciated NOy, along with tracers including water vapour, carbon monoxide and condensation nuclei, in near real time. The overall ‘picture’ of the troposphere over large parts of the North Atlantic is of layers of pollution from the
conti-15
nents of different ages interspersed with layers of air uplifted from the marine boundary layer. The lowest ozone concentrations were recorded in the marine boundary layer where there is evidence for extensive ozone destruction in summer.
Flights were made to penetrate the outflow of hurricane Erica, to determine the southerly extent of polluted air in summer, to examine the impact of frontal systems
20
on the composition of remote marine air, and to trace long-range pollution from the west coast of the USA interspersed with air with a stratospheric origin. In one of the spring flights it is possible that a plume of polluted air with high ozone and NOy, and with an origin in southeast Asia, was intercepted off the coast of Portugal. The concen-trations of NOxin this plume were sufficient for ozone formation to be continuing along
25
its track from west to east.
The instrument to measure NOyalmost certainly was only measuring the sum of or-ganic nitrates (mostly in the form of PAN) plus NOx. The high correlation between NOy
ACPD
4, 4407–4454, 2004
Long-range transport of ozone and related
pollutants S. A. Penkett et al. Title Page Abstract Introduction Conclusions References Tables Figures J I J I Back Close Full Screen / Esc
Print Version Interactive Discussion
© EGU 2004
and ozone under these conditions strongly suggests a non-stratospheric source for most of the ozone encountered over large parts of the atmosphere upwind of Europe. There was a marked seasonal variation in the NOy with about twice as much present in the spring flights than in the summer flights. The overall ozone levels in both spring and summer were somewhat similar although the highest ozone concentration
encoun-5
tered (∼100 ppbv) was observed in summer in some polluted layers in mid Atlantic with an origin in the boundary layer over the southeastern USA.
The bulk of the pollutants, ozone, CO, and NOy, were in the free troposphere at altitudes between 3 and 8 km. The only instances of pollution at lower levels were in the form of ship plumes, which were encountered several times. The data therefore
10
strongly support the need for more in-situ aircraft experiments to quantify and under-stand the phenomenon of long-range transport of pollution from continent to continent. Observations at ground-based stations are inadequate for this purpose and satellite data is incomplete both in terms of its altitude detail and in the extent of chemical speciation, particularly for ascertaining whether chemical production and destruction
15
processes for ozone are occurring.
1. Introduction
Long-range transport of air pollution was first studied in detail in the context of acid rain; it was shown that sensitive ecosystems in Scandinavia and North America were subject to deposition of acid pollutants from sources hundreds of miles upwind (Calvert, 1983).
20
The real extent and impact of long-range transport from natural and anthropogenic sources is of course much larger and capable of affecting the whole atmosphere. Vol-canoes for instance are capable of putting large amounts of sulphur gases into the stratosphere where they are converted to aerosols which can easily be detected in the ice core record (Hammer et al., 1987). In the troposphere smoke from large forest
25
fires in Idaho in the western USA. early in the twentieth century was reported to have blackened the skies over London after transport across the North Atlantic (US Forest
ACPD
4, 4407–4454, 2004
Long-range transport of ozone and related
pollutants S. A. Penkett et al. Title Page Abstract Introduction Conclusions References Tables Figures J I J I Back Close Full Screen / Esc
Print Version Interactive Discussion
© EGU 2004
Service Information Board in Idaho).
This is not surprising since the products of biomass burning have been shown more recently to spread from both South America and Africa over the South Atlantic Ocean (Browell et al., 1996), and even as far as Fiji in the South Pacific (Blake et al., 1999). Also emissions of nitrogen oxides from power plants on the South African Plateau have
5
been observed by satellite as plumes of NO2 reaching Australia (Wenig et al., 2003) and carbon monoxide from forest fires in Canada can be detected in ground-based records in Europe (Forster et al., 2001).
A number of systematic studies have been carried out on pollution transport in the North Atlantic region, including WATOX (Western Atlantic-Ocean
Experi-10
ment)(Galloway et al., 1988) which showed the large scale export of oxidised nitro-gen from the USA. to the western Atlantic, the AEROCE (Atmosphere/Ocean Chem-istry Experiment) Project (Arimoto et al., 1995), which clearly showed the impact of sulphur pollution along the Atlantic shores, both east and west, and the EUROTRAC (European Experiment on Transport and Transformation of Environmentally relevant
15
Trace Constituents in the Troposphere over Europe) TOR (Tropospheric Ozone Re-search) programme which demonstrated the transport of photochemical oxidants from Europe, Africa and North America to islands in the Atlantic such as Tenerife (Schmitt and Volz-Thomas, 1997) and Spitzbergen (Solberg et al., 1997a, b). More recently the IGAC (International Global Atmospheric Chemistry Project) NARE (North Atlantic
20
Regional Experiment) programme quantified emissions of ozone and carbon monox-ide from North America into the Atlantic atmosphere (Fehsenfeld et al., 1996; Penkett et al., 1998) and long-range transport of these trace gases has indeed been detected at Mace Head in western Ireland during ACSOE (Atmospheric Chemistry Studies in an Oceanic Environment) experiments (Evans et al., 2000). Most of the programmes
25
referred to in this paragraph were ground based and whilst they clearly indicated the phenomenon of long-range transport in the Atlantic region, the full extent of it was perhaps unrecognised until more measurements have become available from aircraft and remote sensing (Trickl et al., 2003; Stohl et al., 2002; Reeves et al., 2002). Stohl
ACPD
4, 4407–4454, 2004
Long-range transport of ozone and related
pollutants S. A. Penkett et al. Title Page Abstract Introduction Conclusions References Tables Figures J I J I Back Close Full Screen / Esc
Print Version Interactive Discussion
© EGU 2004
and Trickl (1999) and Trickl et al. (2003) have found from lidar observations several instances of ozone rich air in the free troposphere over central Europe that can be traced back to the boundary layer over North America by trajectory analysis and par-ticle model calculations. Furthermore plumes of enhanced concentrations of carbon monoxide (CO), oxidised nitrogen compounds, NOy and several volatile organic
com-5
pounds (VOCs) sampled by a research aircraft (during CONTRACE) over central and northern Europe have been attributed, through backward particle modelling, to emis-sions over North America (Stohl et al., 2003a, b).
This paper reports observations of extensive layers of air pollution up to 8 km altitude over a substantial part of the central and eastern North Atlantic in spring and summer
10
1997 in some joint experiments involving four aircraft, the UK Meteorological Office C-130, NOAA (National Oceanic and Atmospheric Administration) P3, NASA (National Aeronautics and Space Administration) DC8, and DLR (German Aerospace Research Center) Falcon. The individual programmes were ACSOE and NARE (C-130), NARE (P3), Subsonic Assessment Ozone and Nitrogen Oxide Experiment (SONEX)(DC8)
15
and (Pollution from Aircraft Emissions in the North Atlantic Flight Corridor) POLINAT (Falcon). This paper focuses on results collected only by the C-130 during detachment from its base in southern England to the island of Santa Maria in the Azores in April and September 1997. The study was carried out as part of the UK Natural Environ-ment Research Council (NERC) community programme ACSOE which also included
20
extensive ground-based and ship experiments studying many aspects of the chemistry of the atmosphere over the Atlantic Ocean. It provides an excellent example of how research aircraft can be deployed to intercept pollution and as such is a precursor to a large international study of transatlantic pollution planned for the summer of 2004 (ICARTT)(Lawrence et al., 2003).
ACPD
4, 4407–4454, 2004
Long-range transport of ozone and related
pollutants S. A. Penkett et al. Title Page Abstract Introduction Conclusions References Tables Figures J I J I Back Close Full Screen / Esc
Print Version Interactive Discussion
© EGU 2004
2. The Azores detachment
The UK Meteorological Office C-130 aircraft flew to the island of Santa Maria (35◦N, 25◦W) in the Azores on 2 April 1997 returning on 12 April 1997, and flew again on 13 September 1997 returning on 23 September 1997. From this base it completed 7 flights into the atmosphere over the middle of the North Atlantic Ocean. The flight
5
programme in April was unfortunately curtailed due to an aircraft malfunction but much useful data was obtained for comparison with the September flight series.
In all the ACSOE C-130 experiments consisted of 3 flights in spring; a ferry flight to the Azores (A533), a westerly flight from the Azores to a position close to 40◦N, 40◦W (A534), and a return ferry flight (A536). A southerly flight (A535) was cancelled due to
10
problems with the aircraft. In late summer 7 flights were made purely for ACSOE and one flight, the return ferry flight (A581) was a joint ACSOE/TACIA (Testing Atmospheric Chemistry in Anticyclones) flight which had the alternative objective of studying high levels of photochemical air pollution formed in an anticyclone over the coastal seas close to Europe. The seven ACSOE flights were the outward ferry flight (A574), a
15
flight to study air associated with Hurricane Erica (A575), a deep southerly flight, which attempted to determine the southern boundary of polluted air over the North Atlantic (A576), an intercomparison flight with the NOAA P3 (A577) had a similar track to the spring Flight A534, a radiometer test flight for a newly installed j (O1D) radiometer (upward and downward facing)(A578), a cross frontal study, which also attempted to
20
intercept air previously investigated in flight A577 (A579), and an intercomparison flight with the DLR Falcon focusing on higher altitude horizontal legs (A580) rather than profiles down to the surface, which was the case for most of the other flights. The tracks of ten of the flights are shown in Fig. 1. Taken together they constitute an extensive study of the North Atlantic atmosphere centred on the Azores.
25
The main chemical objectives of the flights included a study of ozone/CO relation-ships in changing water vapour regimes, perturbation of the photochemical equilibria involved in the production and loss of peroxides by NOx, a study of NOy/ozone
rela-ACPD
4, 4407–4454, 2004
Long-range transport of ozone and related
pollutants S. A. Penkett et al. Title Page Abstract Introduction Conclusions References Tables Figures J I J I Back Close Full Screen / Esc
Print Version Interactive Discussion
© EGU 2004
tionships, of the chemical form of NOy, and in situ ozone production and loss rates (Reeves et al., 2002). An overall objective was a survey of the composition of air over the Atlantic Ocean between the North American and European/North African conti-nents to determine the extent to which it is impacted by air pollution. The flights there-fore contained many vertical profiles from the surface to altitudes up to 8 km to detect
5
the presence and determine the frequency of polluted layers seen on previous flights over the Atlantic in 1993 during the Oxidising Capacity of the Tropospheric Atmosphere programme (OCTA) and the first NARE experiments (McKenna et al., 1995; Penkett et al., 1995; Fehsenfeld et al., 1996). The main theme of this paper therefore is a study of the impact of air pollution transported from the adjacent continents into the North
10
Atlantic, and the extent to which ozone concentrations in the middle troposphere over the Atlantic in spring and summer are influenced both by tropospheric production and by stratospheric injection. This is a continuing theme which will be taken up in a further large international multi-aircraft campaign to be conducted in the summer of 2004.
3. Aircraft instrumentation
15
A full list of the instrumentation flown on the C-130 in the Azores detachment is shown in Table 1; only the instruments which provided data for use in this paper are described here.
3.1. Ozone
A commercial instrument was used to measure ozone (Thermo Environmental
Instru-20
ments Inc. model 49 U.V. Photometric Ozone Analyser). It has been modified from standard with the addition of a drier, and separate pressure and temperature sensors. The inlet from the port air sample pipe is pumped via a buffer volume to maintain the in-let at near surface pressure. All surfaces in contact with the sample including the pump are of PTFE or PFA Teflon. The instrument has a range of 0–2000 ppb, a detection
ACPD
4, 4407–4454, 2004
Long-range transport of ozone and related
pollutants S. A. Penkett et al. Title Page Abstract Introduction Conclusions References Tables Figures J I J I Back Close Full Screen / Esc
Print Version Interactive Discussion
© EGU 2004
limit of 2 ppb and an accuracy of 2% (manufacturers’ quotes). The data are sampled with a frequency of 1 Hz then smoothed over a 5-s period. The calibration is carried out annually against a traceable standard from the National Physics Laboratory (NPL). Local checks are carried out against a transfer standard (DASIBI).
3.2. Carbon monoxide
5
Carbon monoxide was measured using a resonance fluorescence instrument that is described in detail in (Gerbig et al., 1999). The CO monitor operated with an accuracy of 3% at a 1-s time resolution. Precision and accuracy of the instrument was also established by an intercomparison with a second instrument on the US NOAA WP-3 aircraft during the same campaign (Holloway et al., 2000).
10
3.3. NOxy
A four channel chemiluminescence analyser, referred to as the NOxysystem, was used to measure nitric oxide (NO), nitrogen dioxide (NO2) and total reactive nitrogen (NOy) defined as NOy=NO+NO2+ HONO+HNO3+HO2NO2+NO3+2N2O5+CH3C(O)O2NO2 (PAN)+other organic nitrates+aerosol nitrate). Detection of NO and NO2was achieved
15
by sampling air at 1 L at STP min−1 from a rear facing stainless steel tube (to help exclude aerosols >1 µm) lined with 1400 (6 mm OD) PFA which was outside the pres-sure boundary of the aircraft layer and forward of the propellers. NO2 was converted by photolysis to NO and NOyspecies were reduced to NO by CO-catalyzed reduction (0.3% v/v) in gold tubes maintained at 300◦C. The converted sampled air on entering
20
the gold plated reaction vessels was mixed with humidified ozone. Each NOy inlet consists of a modified Rosemount sampling head fitted on the inlet window, standing outside the aircraft pressure boundary layer. This type of inlet had previously used for aerosol sampling from aircraft by Foltescu et al. (1995), and was subsequently tested for sampling NOy. It allows fast sampling of aerosols up to ∼4 µm. This is particularly
25
ACPD
4, 4407–4454, 2004
Long-range transport of ozone and related
pollutants S. A. Penkett et al. Title Page Abstract Introduction Conclusions References Tables Figures J I J I Back Close Full Screen / Esc
Print Version Interactive Discussion
© EGU 2004
NOy budget. A short (<100 mm) heated gold-plated stainless steel tube (1400 OD) fit-ted upstream of the NOyconverter allows calibration gases to be added to the sample matrix as close to the inlet as possible. Both inlet tube and NOyconverter are housed in a cylindrical canister bolted to the inlet window. HNO3 wall losses are minimised by heating the short inlet tube before the sample enters the heated converter however,
5
as discussed below, it is believed that HNO3 was not measured efficiently, if at all, in the Azores flights, and the NOychannel was almost certainly measuring only the sum of organic nitrogen plus NOx. Sensitivity checks of the two NO detectors were deter-mined in-flight by adding a standard concentration of NO in N2(Scott speciality gases) of 1.01±0.1 ppmv. The NO standard was diluted into the 1 L STP min−1 sample air
10
stream at a rate of 3,cm3STP min−1 by means of a mass flow controller (Tylan) yield-ing a resultyield-ing mixyield-ing ratio of 3.3 ppbv NO. Linear interpolations between the in-flight calibrations were used to provide minimal error. NO2calibrations were made possible by photolysis of zero grade air (producing ozone) which reacted with the NO calibration gas to obtain a 90% conversion to NO2. The conversion efficiency of the NO2
photol-15
ysis cell and gold converters was checked during the flight; it did not vary significantly and was close to 100% for the NOyconverters and 35% for the NO2photolysis cell. In flight zeros were performed regularly and zero air artefacts were determined on take-off and landing. In the spring flights the 2σ detection limit (DOL) of the NOxyinstrument (based on 10-s averages) were about 5 pptv, 9 pptv, and 8 pptv for the NO, NO2, and
20
NOy channels, respectively. In the summer flights the performance of the instrument declined such that only the NOydata was used. The detection limit was approximately twice that of the spring flights. A comparison of the performance of the fully-developed instrument with a modified NOy inlet to measure NO, NO2, NOy and NOy-HNO3 has been made subsequently in 2000 against an instrument to measure NO and NOy on
25
ACPD
4, 4407–4454, 2004
Long-range transport of ozone and related
pollutants S. A. Penkett et al. Title Page Abstract Introduction Conclusions References Tables Figures J I J I Back Close Full Screen / Esc
Print Version Interactive Discussion
© EGU 2004
3.4. CN
Condensation nuclei (CN) were measured with an ultrafine condensation particle counter, TSI Inc model A3025 CN, on flights carried out during September 1997. This device draws in air, through a sample pipe situated on the starboard side of the air-craft, and saturates it with n-butanol. The level of saturation is maintained such that
5
only heterogeneous condensation occurs onto the small particles within the air sample. Butanol droplets are subsequently counted by measurement of scattering of laser light: the instrument is capable of counting between, 0.01 particles and 9.99×10⁴ particles cm−3. The smallest CN to be detected have diameters around 3 nm: calibration with particles of diameter 5 nm found the detection efficiency, at this lower end of the size
10
range, to be approximately 50%. The upper size range of the instrument is limited to around 1 µm due to the inlet, which is not designed for isokinetic sampling.
3.5. PCASP (Passive Cavity Aerosol Sampling Probe)
A Particle Measuring Systems (PMS) Passive Cavity Aerosol Spectrometer Probe (PCASP) Model 100X instrument, mounted externally on the aircraft’s port-side, was
15
used to measure concentrations of accumulation mode aerosol on flights carried out during spring 1997. This instrument counts particles, by measurement of the scattering of laser light. From a knowledge of the scattering properties of spherical water droplets the particles are sorted into 15 channels spaced pseudo-logarithmically over the diam-eter range 0.10 µm to 3.00 µm. Only bulk paramdiam-eters are discussed in this paper, i.e.
20
summations over the discrete PCASP particle size distribution. The PCASP instrument has a number of limitations, which are briefly described in Osborne et al. (2001), but these are not thought to be significant in our analysis of the data.
A PMS PG-100 particle generator is used to emit a series of National Institute of Standards and Technology (NIST) traceable latex nanospheres from Duke Science
25
ACPD
4, 4407–4454, 2004
Long-range transport of ozone and related
pollutants S. A. Penkett et al. Title Page Abstract Introduction Conclusions References Tables Figures J I J I Back Close Full Screen / Esc
Print Version Interactive Discussion
© EGU 2004
3.6. Water
A General Eastern thermo-electric hygrometer, model 1011B, was used for humidity measurements. At lower temperatures the instrument is less reliable: the accuracy decreases (±0.25 K at 0 K and ±1 K at 213 K) and the instrument takes longer to equi-librate. Thus use of the General Eastern instrument below −20◦C is subject to error
5
within rapidly changing air masses. However, in regions of the flight where there is little change in dew point we have been able to use the data down to approximately −30◦C. 3.7. Trajectories
A major feature of this study was the availability of trajectory data with a high time resolution, which enabled the origin of the air, or at least its course over the previous
10
6 days, to be known all along the aircraft track. This proved to be extremely useful so much so that a significant part of the content of this paper is a discussion of the most likely origin of the pollutants including ozone, that were observed over the Atlantic Ocean in 1997.
Back trajectories were calculated from the aircraft position every time its location
15
changed by more than 100 m in altitude or 0.1◦in position. The trajectories were calcu-lated using European Centre for Medium-Range Weather Forecasting (ECMWF) T106 winds (approximately 1◦ by 1◦ winds)(ECMWF, 1995) with 31 vertical levels using the code of Methven (Methven, 1997). Back trajectories were initialised to the nearest timestep (15 min) of the trajectory calculations. (See Methven et al., 2001, for more
20
details on the UK Universities’ Global Atmospheric Modelling Project (UGAMP) trajec-tory model and an evaluation of its ability to estimate the origin of air masses observed at a ground station.) Accuracy was assessed by comparing the observed time series of constituents (e.g. ozone) with those simulated by the CiTTyCAT chemistry model (Evans et al., 2000) driven by the trajectory model. It was shown that the correlation
25
between the observed and modelled ozone fluctuations that can be related to air mass origin was 85%. The ability of the trajectory model to simulate the finescale tracer
ACPD
4, 4407–4454, 2004
Long-range transport of ozone and related
pollutants S. A. Penkett et al. Title Page Abstract Introduction Conclusions References Tables Figures J I J I Back Close Full Screen / Esc
Print Version Interactive Discussion
© EGU 2004
structure flown through by an aircraft was demonstrated by Methven et al. (2003). Air masses manifest as filaments on horizontal surfaces with widths greater 30 km can be accurately simulated by the trajectory model to the extent that corresponding fea-tures observed in mixing ratio along a flight track can be related to the origin of that air mass. The specific humidity and equivalent potential temperature were used as
5
thermodynamic coordinates to identify different air masses in the observations and to relate them to the modelled structure. Almost all ozone fluctuations along the flight track were explained by crossing between air masses defined in this way and their av-erage composition. Thus the chemical composition and thermodynamic structure were intimately related since both were strongly influenced by the origin of the air masses.
10
In this paper, although chemical concentrations are not modelled it will be assumed that the origin of features wider than 30 km on level flight (about 5 min of flight) can be traced by the trajectory model. The main limitation of the model is that trajectories are calculated following the flow resolved in the ECMWF analyses. If a back trajectory passes through a region experiencing convection it will follow the area-averaged flow
15
through the region, taking no account of sub-grid scale convective updrafts or com-pensating subsidence. If polluted air is uplifted by convective updrafts in this region the “trajectory origin” will not reflect the fact that some of the air has recently been perturbed by surface emissions.
4. Results
20
Results are presented from the September flights A575, A576, A577, and A580 to show the general features encountered during late summer over the Atlantic particularly the layered structures containing high concentrations of pollutants. In the spring results from flights A534 and A536 are presented. Flights A534 and A577 took place in the same part of the atmosphere and therefore allow a spring/summer comparison (see
25
Fig. 1).
ACPD
4, 4407–4454, 2004
Long-range transport of ozone and related
pollutants S. A. Penkett et al. Title Page Abstract Introduction Conclusions References Tables Figures J I J I Back Close Full Screen / Esc
Print Version Interactive Discussion
© EGU 2004
This shows the precision of the trajectory analyses in A580 which are then used to determine the sources of pollution over the Atlantic seen in other flights, particularly A575 and A534.
4.1. Flight A580, 21 September 1997: origin of layers over the North Atlantic
Flight A580 shows to particularly good effect the usefulness of the trajectory data with
5
respect to the prediction of air mass origin. This flight was an intercomparison flight between the DLR Falcon and the Met Office C-130 focusing on the composition of air above 6 km. Trajectories used for flight planning suggested that boundary layer air from over the USA. would be encountered along the flight and indeed filaments of polluted air were visible to observers in the cockpit of the C-130. Other planning information,
10
provided by NILU from its chemical forecast model (Flatøy et al., 2000), suggested that air of recent stratospheric origin would also be encountered. Of particular interest on this flight (and others) were several occasions when ozone, CO and CN increased simultaneously, and others as where CN increased but ozone and CO decreased.
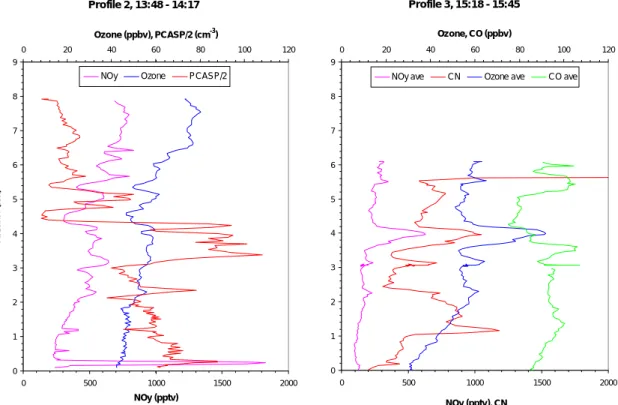
One of each of these features is presented to show the precision of the trajectory
15
data. Figure 2 shows both chemical data for a period between 13:45 and 14:45 UT and trajectory data for short periods corresponding to events involving O3, CO and CN. In the inset on the left hand panel a period is marked with an arrow (at 13:50 UT) when the CN concentration increases and the CO and ozone decreases simultaneously. Ac-cording to the trajectories the air sampled during this short period had been uplifted
20
from the marine boundary layer over the middle of the Atlantic, or the Sargasso Sea, possibly by a frontal system. A later period of the flight at about 16:30 UT also shows the same pattern of anticorrelation between CN and CO and ozone; this time trajecto-ries suggest the air to have been uplifted from the Pacific Ocean close to 50◦N. Shown in the inset of the right hand panel is an arrow pointing to a later period (14:40 UT)
25
when all three components, CN, CO and ozone, increase simultaneously. The trajec-tories at this time show an origin over Canada with uplift early in the trajectory. This is clearly continental pollution, from the boundary layer over North America. The close
ACPD
4, 4407–4454, 2004
Long-range transport of ozone and related
pollutants S. A. Penkett et al. Title Page Abstract Introduction Conclusions References Tables Figures J I J I Back Close Full Screen / Esc
Print Version Interactive Discussion
© EGU 2004
correlation between a boundary layer origin for the air and an increase in pollutant level in the instrument readings for CO, CN, NOy and ozone, was frequently observed in all the summer flights.
One other feature of Flight A580 (not shown) is a pulse of ozone reaching nearly 120 ppbv at about 17:00 UT. The origin of this air was over the Aleutian Islands in the
5
Pacific Ocean at an altitude of 10 km so it is quite likely that the ozone was of strato-spheric origin. This was indicated by the CN count which remained low throughout the ozone pulse and the CO, which was mostly anticorrelated; also the potential vorticity 5 days previously was about 10 PVU, i.e. >3.5 PVU which is observed for stratospheric air. This was the only air with an elevated ozone concentration which could most
prob-10
ably be ascribed to the stratosphere during the whole series of flights based in the Azores shown in Fig. 1. By inference the majority of the ozone observed during these flights had an origin in the troposphere, or at least could not be ascribed with any certainty to the stratosphere.
The relevance of flight A580 to the subject of this paper is that it clearly shows the
15
types of phenomena which were observed and the relationship between trajectories and data patterns associated with the presence of continental boundary layer air in-terleaved with marine boundary layer air and with stratospheric air. The observations of layers in the mid troposphere where CN increased and CO and ozone declined are very interesting since they suggest that uplift of marine boundary layer air leads to
20
new particle production in the free troposphere. This has been observed elsewhere in flights over the Pacific (Clarke et al., 1999).
4.2. Flight A575, 14 September 1997: transport of polluted air from North America by hurricane Erica
The purpose of this flight was to sample air that had been influenced by Hurricane
25
Erica. The aircraft therefore flew south from the Azores, turned west to make an in-ception and flew back to the Azores on a northwesterly course, through Erica’s outflow (see Fig. 1). The altitude pattern on this flight was more typical of that adopted for the
ACPD
4, 4407–4454, 2004
Long-range transport of ozone and related
pollutants S. A. Penkett et al. Title Page Abstract Introduction Conclusions References Tables Figures J I J I Back Close Full Screen / Esc
Print Version Interactive Discussion
© EGU 2004
September flights with deep profiles from the surface to altitudes of the order of 7 km, which was the usual ceiling for the C-130 aircraft on these long flights over ocean. Dur-ing Flight A575 eight deep profiles were made along with two shallow profiles. These served to define the composition of the air throughout much of the lower and mid tropo-sphere over the Atlantic and the changes in composition between the free tropotropo-sphere
5
and marine boundary layer.
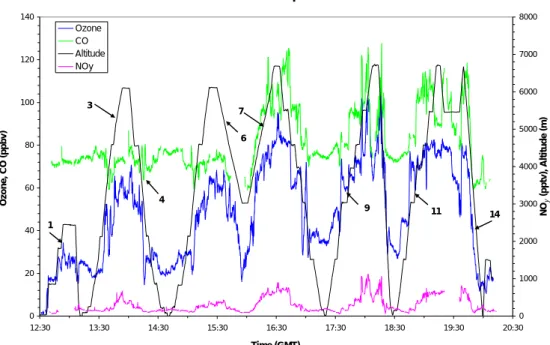
The chemical composition of the air on Flight A575 showed some remarkable fea-tures, particularly in the air influenced by the hurricane following uplift by a frontal sys-tem over North America several days earlier. Figure 3 shows the time series for altitude, ozone, CO and NOy during the flight from 12:30 to 20:30 UT with numbered profiles.
10
The maximum ozone concentration in air outside the hurricane’s influence in profiles 1 to 6, up to about 16:10 UT, was about 65 ppbv. After 16:10 UT, however, in profiles 7–12 when the aircraft flew into the outflow from the hurricane (as identified by satellite photographs), ozone, CO and NOyconcentrations in the free troposphere above 4 km were much higher with ozone reaching 100 ppbv on occasion, CO increasing from the
15
80 ppbv average to 120 ppbv, and NOy reaching over 1000 pptv with an average of 800 pptv. The CN concentrations were also elevated, relative to background levels, with maximum values in the region of 2000 cm−3 and these were closely correlated with ozone, CO and NOyin a similar manner to that shown in Fig. 2.
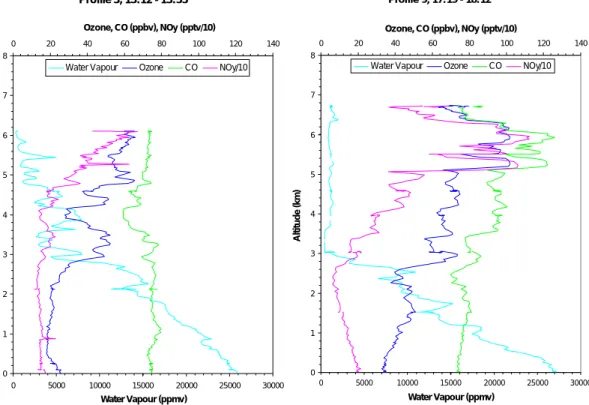
The origin of the air below 3 km in profile 3 (Fig. 4, left hand panel) is the African
20
continent followed by a transit over ocean at the same maintained level. There is a marked break above 3 km where the air becomes more layered and positive correla-tions develop between the 3 pollutants, ozone, CO and NOy. The origin of the air is the mid Atlantic free troposphere and this is a typical profile for air in this region with aged air masses in layers most probably with a continental origin. Many other profiles taken
25
during the ACSOE campaign are similar. There are parts of the upper profile where there are good correlations between the 3 pollutants and parts when the correlation is weaker, perhaps due to chemical aging. Interestingly in Profile 3 (not shown) there is a section between 5 and 6 km where CN and ozone are anticorrelated suggesting uplift
ACPD
4, 4407–4454, 2004
Long-range transport of ozone and related
pollutants S. A. Penkett et al. Title Page Abstract Introduction Conclusions References Tables Figures J I J I Back Close Full Screen / Esc
Print Version Interactive Discussion
© EGU 2004
of marine air similar to that shown in Fig. 2 on Flight A580. This also appears to be a very common occurrence. The CN profile also shows some sharp layers in the first kilometre with maximum concentrations of the order of 3500 cm−3. The layer with the largest CN concentration correlates very well with the sharp spike in NOy shown just below 1 km in the profile suggesting that it could be associated with an exhaust plume
5
from a ship at latitude 35◦N, longitude 24◦W in mid Atlantic south of the Azores. Other plumes of this nature were also observed in the ACSOE flights suggesting a signifi-cant source of NOx from ships in the marine boundary layer (see for instance in flight A534)(Lawrence and Crutzen, 1999; Kasibhatla et al., 2000).
Profile 9 below 5 km shows very similar features to Profile 3 up to 5 km (Fig. 4, right
10
hand panel) with ozone, CO and NOy well correlated in layers between 3 and 5 km and the maximum ozone concentration not exceeding 70 ppbv. Between 5 and 6.5 km however, layers were present where the pollutants were positively correlated and the ozone concentration increased to above 100 ppbv, the CO increased to above 120 ppbv and NOy exceeded 1 ppbv. The largest concentration variation was in the NOy which
15
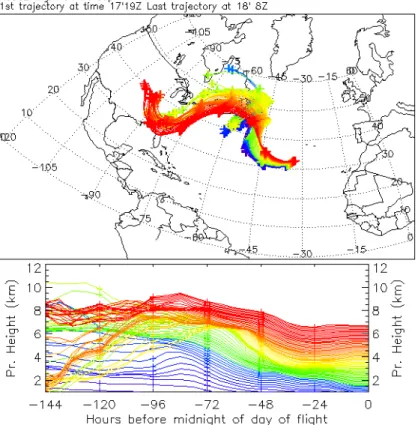
increased from about 100 pptv at 2.5 km to 1100 pptv at 6 km. The trajectories for this profile are shown in Fig. 5. They are all from the west of the profile with those for the most polluted layers between 5 and 6 km having an origin in the boundary layer over the mid western/southeastern USA. Trajectories for Profiles 8, 10, 11 and 14 all showed similar uplift of boundary layer air from the same region. The origin of the air
20
at the bottom of Profiles 8, 9, 10 and 11 is from mid Atlantic whereas the origin of the air for Profile 14 is again from the African continent. The ozone concentrations in the air from the east are significantly lower than those from the west near the surface no doubt reflecting the large source of ozone over the North American continent.
The behaviour of water vapour in Fig. 4 is interesting in that it consistently shows
25
anticorrelation with ozone in the various layers. This is shown to better effect in Fig. 4 (left hand panel) where the water vapour concentrations are high enough throughout the profile for correct measurement by the instrument. Above 3 km there is total an-ticorrelation between ozone and water vapour even in the layers where ozone, NOy
ACPD
4, 4407–4454, 2004
Long-range transport of ozone and related
pollutants S. A. Penkett et al. Title Page Abstract Introduction Conclusions References Tables Figures J I J I Back Close Full Screen / Esc
Print Version Interactive Discussion
© EGU 2004
and CO correlate well. In Fig. 4 (right hand panel) where the water vapour concentra-tions are significantly lower above 3 km there are more regions where ozone and water vapour correlate positively, particularly between 3.4 and 5.2 km, although the positive correlation again breaks down in the more polluted layers between 5.2 and 6.6 km and above. This evidence suggests that a negative correlation between water vapour and
5
ozone should not necessarily be used to indicate a stratospheric origin for ozone. Only when the water vapour concentrations are less than 100 ppm should water vapour be used as a tracer of stratospheric air with some confidence. Further the water vapour has a big impact on the in situ photochemical ozone loss, such that layers with more water vapour have greater ozone loss (Reeves et al., 2002). Thus an anti-correlation
10
between ozone and water vapour may not be due to transport of ozone rich air from the stratosphere, but rather photochemical loss of ozone in moist air (Reeves and Penkett, 2003).
4.3. Flight A576, 16 September 1997: latitudinal extent of polluted air over the North Atlantic
15
Flight A576 was undertaken to contrast the air composition over the mid Atlantic at latitudes between 30 and 50◦N with that further south, in particular with air which had originated over Africa. The flight was directed due south from the Azores at 38◦N down to 24◦N and it returned along a very similar track as shown in Fig. 1. The chemical data shown in Fig. 6 appear to be highly symmetrical about the mid point of the flight at about
20
16:10 UT when the aircraft reversed course, with the highest concentrations of ozone, CN and CO being seen at the top of the most southerly Profiles 8 and 9 at latitude 26◦N. The most polluted air was experienced at the lowest latitude; the trajectories had an origin over Bermuda and had probably previously originated over the USA (not shown). Ozone reached about 90 ppbv and both CO and NOy were obviously elevated
25
above background with CO increasing from 70 to over 100 ppbv and NOy reaching 700 pptv at 6 km from about 60 pptv at the surface. The ratio of NOyto ozone (∼8) was higher in the more polluted air as indicated by higher CO or CN.
ACPD
4, 4407–4454, 2004
Long-range transport of ozone and related
pollutants S. A. Penkett et al. Title Page Abstract Introduction Conclusions References Tables Figures J I J I Back Close Full Screen / Esc
Print Version Interactive Discussion
© EGU 2004
The trajectories for the tops of Profiles 3 and 4, and 5 and 6 had a Caribbean origin. Here the ozone was mostly less than 60 ppbv and the anticorrelation between ozone and CN at about 13:30 UT was most probably caused by uplifted marine boundary layer air as illustrated in Fig. 2. The sharp layers in NOy, CO and ozone seen in Profile 4 and in Profiles 13 and 14 were encountered at approximately the same position, 32◦N
5
27.5◦W on the outward leg and 31.5◦N and 27◦W on the return leg, so they are almost certainly the same feature. According to the trajectory analysis the origin of the layers at 4 km, containing ozone concentrations up to 80 ppbv, was the free troposphere over the Eastern USA at similar altitudes. This would suggest that the layers are very stable over the ocean, probably reflecting lower convective activity away from the land.
10
The origin of the air at the base of Profiles 8 and 9 is clearly African in origin. The low level African air contained the lowest concentrations of ozone and NOyof all the flights undertaken in April or September and its composition contrasts strongly with air of a North American origin. The minimum ozone level of 10 ppbv recorded during the entire mission was observed in Profile 8 just below the top of the MBL (Fig. 6). In this profile
15
the NOy increased to 60 pptv near the surface from its minimum value close to 20 pptv between 1 and 2.5 km. The low ozone and NOymay be due to heterogeneous loss on Saharan dust. This has been observed recently in some studies on Mount Cimone in northern Italy when air from the Sahara was being sampled (Bauer et al., 2004).
A large spike was seen for CN at the top of the MBL on both Profiles 8 and 9 as the
20
aircraft went into and out of the boundary layer (Fig. 6); the origin of these spikes is not known but it is unlikely to be a ship plume since the NOy did not show a similar spike. A spike in CN occurs on other occasions when the aircraft enters the MBL so it may be a common phenomenon perhaps associated with particle production in the marine atmosphere. The data patterns on Flight A576 (Fig. 6) again emphasise the complex
25
layered structure of the troposphere and the strong influence of pollution which gives rise to high ozone concentrations over much of the atmosphere over the North Atlantic that was sampled by the C-130 in late summer 1997 down to latitudes of about 25◦N.
ACPD
4, 4407–4454, 2004
Long-range transport of ozone and related
pollutants S. A. Penkett et al. Title Page Abstract Introduction Conclusions References Tables Figures J I J I Back Close Full Screen / Esc
Print Version Interactive Discussion
© EGU 2004
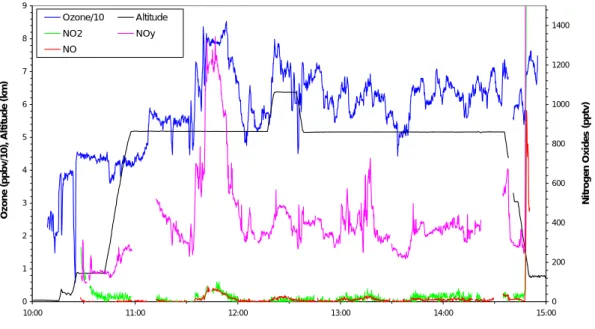
4.4. Flight A536, 10 April 1997: possible evidence for long-range transport of pollution from Asia to Europe
Flight A536 took place on 10 April 1997 and it was the return ferry flight from the Azores to Boscombe Down in southern England. There was no specific tracer instrument for pollution on this flight (that is, no CO, CN or PCASP). However, the ratio of NOy to
5
ozone serves as a good tracer of the origin of the air, particularly when values for this ratio are 10 and more, which in terms of pptv/ppbv are most unlikely to be found in the stratosphere (Murphy et al., 1993). Figure 7 shows the chemical data record for the whole flight when large concentrations of ozone (up to 85 ppbv), NOy(up to 1200 pptv) and NOx(NO+NO2≈80 pptv) were experienced in a clearly delineated flow of polluted
10
air at about 5.4 km altitude.
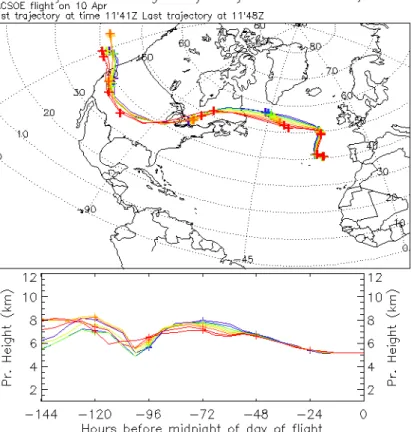
According to the trajectory analysis for the period 11:41 to 11:49 UT the air in ques-tion had passed over North America at a similar altitude (6 to 8 km) without indicaques-tion of intercepting boundary layer air, at least the trajectories did not dip below 5 km (Fig. 8). Its origin could therefore be west of the USA and Canada, although convection could
15
have uplifted North American air and not be seen by the trajectory analysis; this is less likely in spring however. Its potential vorticity over the track of the 6-day trajectory did not exceed 1 PV unit and the ratio of NOyto ozone was about 15, so it is most unlikely to have originated in the stratosphere. The plume between 11:30 and 12:00 UT could therefore have been Asian pollution, in which case its origin was at least 20 000 km
20
from its interception location.
There has been much recent discussion about the impact of Asian pollution on air quality in the USA and it has been shown that the pollution travels furthest in the spring months (Yienger et al., 2000; Bey et al., 2001; Jaffe et al., 1999; Jacob et al. 1999; De-Bell, et al., 2004). The observations made on Flight A536 in April 1997 could therefore
25
represent one of the first reported observations of ultra-long-range transport of pollu-tion across continents and oceans in the Northern Hemisphere, in this case transport of Asian pollution to the atmosphere off the coast of Portugal. Transport of air with low
ACPD
4, 4407–4454, 2004
Long-range transport of ozone and related
pollutants S. A. Penkett et al. Title Page Abstract Introduction Conclusions References Tables Figures J I J I Back Close Full Screen / Esc
Print Version Interactive Discussion
© EGU 2004
ozone from the tropical Pacific has already been observed in the upper troposphere over Wales showing the potential for discrete transport in the free troposphere over very large distances (Davies et al., 1998; Trickl et al., 2003).
The trajectories for the whole flight showed many different origins with those between 10:30 to 11:30 UT originating over the Atlantic Ocean interspersed with air uplifted from
5
the centre of the USA., from about 11:40 to beyond 12:00 UT being possibly from Asia, from 12:30 to 13:45 UT having an Iberian/African, origin, and from 14:00 UT onwards being part of a large anticyclone localised over southern Britain. The highest levels of pollutants on this occasion were in the air with an origin west of the USA; this was clearly delineated by its composition and by the switch in trajectories from southwest
10
to west once the high concentrations of pollutants were encountered, and round to the east afterwards. The episode well illustrates the capability of fully instrumented aircraft platforms to investigate large-scale pollution events of hemispheric significance. Much more needs to be known about the extent of this phenomenon which will have a large impact on the composition of air throughout the troposphere and levels of ozone
15
experienced at the surface.
4.5. Flights A534 (7 April 1997)/A577 (18 September 1997): spring versus summer profiles of ozone and NOy
These two flights were made in a very similar location (see Fig. 1) but one was in spring on 7 April 1997 and the other was in late summer on 18 September 1997; the summer
20
flight (A577) was in fact an intercomparison flight with the NOAA P3 aircraft. Similar air masses were being sampled in both flights in that they mostly had passed over the USA from a westerly origin. On Flight A534 the aircraft passed through a minor front in level flight at about 12:30 UT and many measured quantities showed an instantaneous change, i.e. ozone, NOy, peroxides and particle number (PCASP). A deep profile was
25
made from the maximum altitude (8 km) to the surface from 13:48 to 14:17 UT at about 44◦N and 39◦W. This revealed the presence of layers but the degree of concentration variation from layer to layer was significantly less than in the summer flights (Fig. 9, left
ACPD
4, 4407–4454, 2004
Long-range transport of ozone and related
pollutants S. A. Penkett et al. Title Page Abstract Introduction Conclusions References Tables Figures J I J I Back Close Full Screen / Esc
Print Version Interactive Discussion
© EGU 2004
hand panel). This is a feature which has been observed by us when comparing ozone profiles collected in spring and summer over several years in the OCTA experiment in 1991 and 1994 (McKenna et al., 1995) and in the present ACSOE series in 1997. In winter profiles the layering is even less marked according to OCTA measurements (McKenna et al., 1995).
5
Unfortunately for the ACSOE spring flights it was not possible to fit the CO or the CN instruments. The aircraft did fly with the PCASP fitted however. This instrument provides a record of particle number within the size range 0.1 to 3 microns along with details of average particle radius etc. The PCASP signal always increases when the aircraft penetrates the boundary layer and generally declines with altitude. The PCASP
10
is usually a good tracer of pollution in the free troposphere and this is shown to good effect in Fig. 9 (left hand panel) for the 1348 profile. The PCASP signal tracks the ozone and NOysignals faithfully, albeit with a general decrease with increasing altitude, whereas ozone and NOyboth show a general increase with altitude. Below 2 km there is a divergence associated with a change in trajectories which have a more northerly
15
origin. All signals now are seemingly independent, except that NOyand PCASP both reveal the presence of a plume close to the surface, which is almost certainly from a ship since the NO signal also increased markedly, and much the of the NOywas NOx. The position of the interception of this plume was close to 43◦5000N, 39◦W, i.e. mid Atlantic.
20
The average ozone concentration encountered on Flight A577 in September 1977 was similar to that encountered on Flight A534 in April 1997 (50–60 ppbv), but on Flight A577 the ozone concentration declined much more rapidly near the surface due probably to the greater efficiency of photochemical ozone destruction processes at the higher water vapour concentrations and photolysis rates in summer (not shown).
25
Surface ozone concentrations at 44◦N and 36◦W were in fact between 30 and 40 ppbv rather than 50 ppbv, also there was a prominent layer with an origin in the mid-Western USA where the ozone increased from 60 to 95 ppbv at about 4 km (Fig. 9, right hand panel). There was a substantial difference in the NOy/ozone ratios between the two
ACPD
4, 4407–4454, 2004
Long-range transport of ozone and related
pollutants S. A. Penkett et al. Title Page Abstract Introduction Conclusions References Tables Figures J I J I Back Close Full Screen / Esc
Print Version Interactive Discussion
© EGU 2004
periods with more NOy relative to ozone being present in spring than summer. The NOy/ozone ratio (pptv/ppbv) for A534 in the spring varied from a minimum of 4 to a maximum of 16 with an average close to 7. For Flight A577 in the summer the minimum was under 2, and the maximum was about 8 with an average of 4. In general the NOy/O3ratio increased with altitude on all flights. The peaks in ozone in the profile
5
shown in Fig. 9 (right hand panel) were mostly correlated with CO, although there were parts of the profile where ozone and CO were anticorrelated. The CN concentrations in Flight A577 were the highest recorded in all flights. The maximum concentration was about 93 000 cm−3 at the top of the profiles shown in Fig. 9 (right hand panel) and it exceeded 3000 cm−3 for a period of about 20 min during the descent before the
10
ascent profile shown in Fig. 9 (right hand panel). These large CN concentrations did not appear to be associated with uplift of marine boundary layer air.
The contrast between spring and summer profiles shown in Fig. 9 emphasises the differences and similarities between the mechanisms for creating much of the ozone over the North Atlantic throughout the year. It is very likely that most of the ozone has a
15
tropospheric origin in both spring and summer but it is also likely that there is more uplift of boundary layer air pollution ozone in summer (i.e. transport predominates)(Collins et al., 2000; Jacob et al., 1997), whereas in spring ozone formation in the free troposphere away from the source may also be important (Penkett and Brice, 1986; Zanis et al., 2000, 2003; Li et al., 2002).
20
5. Discussion
The main purpose of this paper is to present results on the distribution of ozone over the mid Atlantic Ocean in spring and summer focusing on the source of elevated ozone concentration observed in layers between 4 and 8 km. Trajectory data for Flight A575, the hurricane flight, clearly show that the large ozone concentrations found in the upper
25
levels above 3 km originate in the boundary layer over the continental North America 6 days previously, but for many of the other flights examined (A576, A577, A579 and
ACPD
4, 4407–4454, 2004
Long-range transport of ozone and related
pollutants S. A. Penkett et al. Title Page Abstract Introduction Conclusions References Tables Figures J I J I Back Close Full Screen / Esc
Print Version Interactive Discussion
© EGU 2004
A580, A534 and A536) the actual ground-base source of the ozone is not given by the 5-day trajectory. Since many of the high-level trajectories appear to pass over the American continent at the level they are encountered over the Atlantic, they may have an origin west of the American continent. It is very likely, however, that many of the trajectories would have experienced convection whilst over North America, a process
5
which is not included in the trajectory analysis.
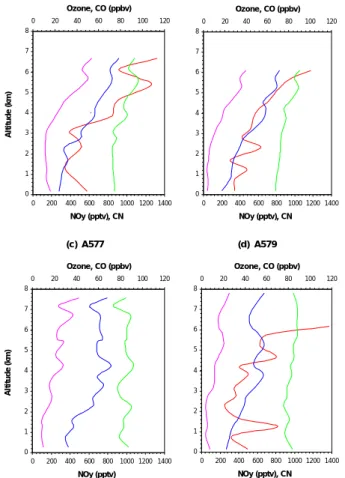
The ozone is present in layered structures and usually there is a positive correlation with other species such as CO, CN and NOyalthough occasionally ozone is negatively correlated with CN in layers with high CN. The layering is a very general feature and is undoubtedly related to the overall vertical and horizontal transport processes which
10
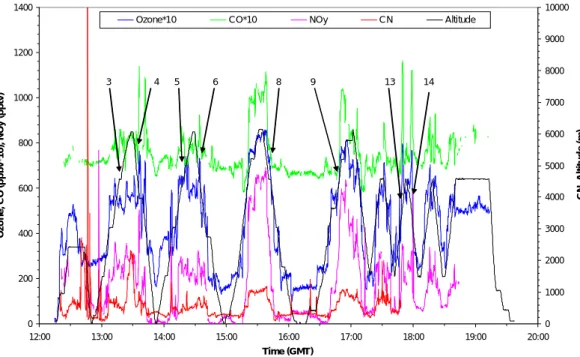
occur in the troposphere. In addition to the detailed features shown in individual pro-files which can be related to specific trajectories, the composite propro-files for ozone, CN, CO and NOyreveal some important general features. Figure 10 shows four composite profiles obtained by binning all data in 0.5 km ranges for the whole flights ((a) A575, (b) A576, (c) A577 and (d) A579). In all cases NOy and ozone increase substantially
15
with altitude. This could be interpreted in terms of a stratospheric source for the ozone; however, both CO and CN, which are tracers of surface emissions, also increase signif-icantly with height in the composite profiles. This is less true for CO in A577 and A579 but the same structures are revealed in A577 above 2 km for CO, ozone and NOy. The actual reason why the CN count should be higher in the free tropospheric air than its
20
average value in the marine boundary layer is not clear. It has been suggested that it is caused by new particle formation in the absence of larger marine aerosol particles which are removed by clouds in the ascending air (Clark et al., 1999). Even so the CN is still clearly a tracer of uplifted surface air.
The general picture of the atmosphere over the Atlantic Ocean at mid latitudes during
25
the sampling periods is therefore of long-range transport of ozone pollution from the continents at altitudes above 3 km interspersed with uplifted marine boundary layer air. Only rarely is any trace of stratospheric influence detected. Below 3 km there is evidence both for less polluted air being transported off the African continent, for less
ACPD
4, 4407–4454, 2004
Long-range transport of ozone and related
pollutants S. A. Penkett et al. Title Page Abstract Introduction Conclusions References Tables Figures J I J I Back Close Full Screen / Esc
Print Version Interactive Discussion
© EGU 2004
polluted marine air, and possibly for ozone destruction in the summer marine boundary layer below 2 km (Reeves et al., 2002). A possible explanation is that as polluted air masses are transported into the mid and upper troposphere less O3 is lost via O3 destruction due to lower water vapour (Reeves et al., 2002) and also O3 production efficiency increases with altitude (Wild et al., 1996).
5
Whereas there is a divergence between the behaviour of ozone and CO at lower al-titudes, ozone and NOyboth decline substantially all the way to the surface. The actual form of the NOy measured in these flights is not defined by measurement; however there is strong evidence that it is mostly PAN plus NOx. This is a function of the inlet used on the C-130 at the time of the experiment. Intercomparison with the NOAA P3
10
NOx/NOy measurement system in Flight A577 showed that the UEA system was not capable of detecting HNO3due to losses on the inlet lines which were stainless steel, and that the C-130 NOy signal very closely resembled the sum of organic nitrogen compounds determined by the P3 with a small constituent of NOx (Bauguitte, 2000).
It is reasonable to conclude therefore that the C-130 NOy signal is mostly organic
15
nitrogen in the form of PAN with some residual inorganic nitrate contribution particularly nearer the surface. Subsequent tests carried out with the original NOy inlet when a PAN instrument was also on board the C-130 in spring 2000 showed good agreement with PAN being at least 90% of the NOy signal. Also the original NOy inlet used in 1997 has been compared directly on the C-130 in summer 2000 during the EXPORT
20
experiment over central Europe with a new inlet very similar to the NOAA P3 inlet used in 1997 (Ryerson et al., 1999). This showed conclusively that the old inlet does not pass HNO3, provided the HNO3concentration remains low (i.e. less than 0.3 ppbv). As the HNO3concentration approaches 2 ppbv, which is typical of the lower stratosphere, then the original inlet passes approximately 50% of the HNO3. This was determined
25
by comparing the total NOy from both inlets with the sum of NO+NO2+PAN+HNO3. The present inlet system on the C-130 consists of two new NOAA inlets (Ryerson et al., 1999) with a nylon tube fitted to one of the inlets to remove HNO3. The details are not discussed here but it does appear to perform well with total measured NOy being
ACPD
4, 4407–4454, 2004
Long-range transport of ozone and related
pollutants S. A. Penkett et al. Title Page Abstract Introduction Conclusions References Tables Figures J I J I Back Close Full Screen / Esc
Print Version Interactive Discussion
© EGU 2004
very close to the sum of NO+NO2+PAN+HNO3measured separately, see (Brough et al., 2003).
If the form of NOy measured in 1997, both in spring and summer, is indeed mostly PAN then this is a strong indicator that most of the ozone present over the altitude range studied (0 to 8 km) is of tropospheric origin. Correlation plots of NOy:O3 for the
5
flights A534 and A577 are shown in Fig. 11; these both took place in a similar part of the atmosphere with similar back trajectories for the air being sampled . For the spring flight (A534) there is a high degree of correlation between NOy and ozone (R2=0.71) (Fig. 11, upper panel), and the slope of the line is 14.4 which is effectively the average NOy:O3ratio throughout the flight. There is an intercept on the ozone axis at zero NOy
10
of about 25 ppbv ozone.
For flight A577 the correlation for the whole flight reduces to 0.48, but for the period 13:30–18:10 UT, which constitutes well over half of it, R2 increases to 0.66 (Fig. 11, lower panel). For the A577 flight the slope of the NOy to ozone plots reduces to 6.3 or 6.9, respectively. This is similar to the average NOy/ozone ratio found by Ziereis
15
et al. (2000) in the POLINAT experiment carried out over the Atlantic in Septem-ber/October 1997. Also in the summer flight (A577) there is a distinct part of the plot, for ozone less than 40 ppbv, where ozone and NOyare not correlated. NOyis approxi-mately constant at about 100±50 pptv for ozone varying between 20 and 40 ppbv. This behaviour would be expected if most of the NOyabove 100 pptv were PAN. The
com-20
ponent of NOy below 100 pptv could either be an artefact, which has been suspected for the type of NOyconvertor in use here, or possibly inorganic nitrate salts which could be detected using the original inlet system used in 1997 (see aircraft instrumentation section). These have been measured at this level in the Atlantic region (Prospero et al., 1995; Spokes et al., 2000). Another possible cause of the residual NOyis short-chain
25
organic nitrates, which are known to have a marine origin (Atlas et al., 1993). The greater abundance in spring of the component of NOyfor ozone above 40 ppbv fits well with previous data on the seasonality of PAN which shows a pronounced maximum in surface air in April (Penkett and Brice, 1986). The seasonality of PAN in free
tropo-ACPD
4, 4407–4454, 2004
Long-range transport of ozone and related
pollutants S. A. Penkett et al. Title Page Abstract Introduction Conclusions References Tables Figures J I J I Back Close Full Screen / Esc
Print Version Interactive Discussion
© EGU 2004
spheric air is less well known but these data, together with other studies, also suggest a spring maximum, at least up to 8 km (Atlas et al., 2003; Browell et al., 2003).
Observed NOy/ozone ratios (ppt/ppb) of the order of 15 are present for the part of Flight A575 where the air had recently been in the continental boundary layer over the United States (see Fig. 4, right hand panel). Interestingly these higher NOy/ozone
5
ratios would give values of 70 for the ratio of ozone to PAN (ppb/ppb) assuming that all the NOy is PAN. These are very common ratios for these two pollutants in polluted boundary layer air over Europe and North America (Garland and Penkett, 1976). Whilst this does not rule out other major contributors to the NOy measured in these experi-ments it is not inconsistent with the idea that most of the NOy signal is due to PAN. Its
10
high correlation with ozone virtually throughout the data record suggests that a very large percentage of the ozone measured in the spring and summer of 1997 was of tropospheric origin, mostly probably in the form of air pollution transported over long distances (Li et al., 2004).
For the spring campaign the NO component of the NOxy instrument was working
15
reasonably well and the detection limit for NO was less than 10 pptv for a 1-min inte-gration. A plot of NO versus NOyfor Flight A534 is shown in Fig. 12 (upper panel). NO is correlated with NOywith R2∼0.4 and NO is about 2% of the measured NOy accord-ing to the slope of the correlation line. The maximum NO concentration is between 30 and 35 pptv and the majority of the values are less than 10 pptv. Even over the remote
20
oceans of the Southern Hemisphere NO concentrations reach 5 pptv during the day; significantly more NO would be expected over the Atlantic Ocean and indeed values up to 20 pptv at solar noon have been measured by the same instrument in clean marine air reaching Mace Head in western Ireland. A substantial number of the data points on Flight A534 though lie above 15–20 pptv which should allow net ozone formation to
25
occur (Reeves et al., 2002).
Figure 12 (lower panel) shows the plot of NO versus NOyfor Flight A536 (Fig. 7). On this occasion the correlation coefficient R2was over 0.7 and NO represented over 5% of the measured NOy. As in the case of Flight A534 most of the NO was below 20 pptv but
ACPD
4, 4407–4454, 2004
Long-range transport of ozone and related
pollutants S. A. Penkett et al. Title Page Abstract Introduction Conclusions References Tables Figures J I J I Back Close Full Screen / Esc
Print Version Interactive Discussion
© EGU 2004
a substantial proportion lay between 20 and 40 pptv, and in the plume between 11:30 and 12:00 UT values between 40 and 70 pptv were recorded. It has been calculated that instantaneous net ozone production rate in this plume was 0.2–0.4 ppbv/h (Reeves et al., 2002), when sampled just before 12:00 UT. This would equate to daily rates of the order of 1 to 2 ppbv per day and if this were to occur throughout the transit back
5
to its source in Asia (say 10 days) then a significant fraction of the ozone in the plume would been formed in the free troposphere. Even NO values down to 10 pptv will have an impact on the amount of ozone observed by limiting the extent of net-destruction by photochemistry. We have also observed similar and higher NOx concentrations over Europe in the Alps at a similar time of year (Carpenter et al., 2000). This was
10
observed in our experiment on the Jungfraujoch and led us to suggest the possibility of substantial in situ production of ozone in the spring resulting in a contribution to the spring maximum observed on the Jungfraujoch and at other ground-based sites in the Northern Hemisphere (Zanis et al., 2000, 2003).
6. Conclusions
15
The ACSOE flights conducted by the UK Meteorological Office C-130 aircraft based in the Azores found evidence for many layers in the free troposphere with a continental pollution origin interspersed with layers of marine air. Both trajectory data and chemical tracer data provide strong evidence that most of the ozone observed in the troposphere over the North Atlantic in spring and summer has a continental origin. The influence
20
of ozone from the stratosphere appears to be small, at least below altitudes of 8 km. It is possible that a plume of ozone with an origin in Asia was detected off the coast of Portugal in one of the spring flights. The ACSOE flights therefore provide high quality experimental evidence for large-scale ozone pollution throughout most of the troposphere over the North Atlantic Ocean.
25
In general the concentrations of ozone, CO, CN and NOy increase with altitude and as such are anticorrelated with water vapour which declines strongly with altitude. The