HAL Id: insu-01432989
https://hal-insu.archives-ouvertes.fr/insu-01432989
Submitted on 19 Jan 2017
HAL is a multi-disciplinary open access
archive for the deposit and dissemination of
sci-entific research documents, whether they are
pub-lished or not. The documents may come from
teaching and research institutions in France or
abroad, or from public or private research centers.
L’archive ouverte pluridisciplinaire HAL, est
destinée au dépôt et à la diffusion de documents
scientifiques de niveau recherche, publiés ou non,
émanant des établissements d’enseignement et de
recherche français ou étrangers, des laboratoires
publics ou privés.
A model for distortions of polarisation-angle curves in
radio pulsars
J. Dyks, M. Serylak, S. Oslowski, L. Saha, Lucas Guillemot, Ismaël Cognard,
B. Rudak
To cite this version:
J. Dyks, M. Serylak, S. Oslowski, L. Saha, Lucas Guillemot, et al.. A model for distortions of
polarisation-angle curves in radio pulsars. Astronomy and Astrophysics - A&A, EDP Sciences, 2016,
593, A83 (14 p.). �10.1051/0004-6361/201628516�. �insu-01432989�
arXiv:1608.00770v1 [astro-ph.HE] 2 Aug 2016
August 3, 2016
A model for distortions of polarisation-angle curves
in radio pulsars
J. Dyks,
1M. Serylak,
2S. Osłowski,
3,4L. Saha,
1L. Guillemot,
5,6I. Cognard
5,6and B. Rudak
11 Nicolaus Copernicus Astronomical Center, Polish Academy of Sciences, Rabia´nska 8, 87-100, Toru´n, Poland 2 University of the Western Cape, Cape Town, South Africa
3 Fakult¨at f¨ur Physik, Universit¨at Bielefeld, Postfach 100131, 33501 Bielefeld, Germany 4 Max-Planck-Institut f¨ur Radioastronomie, Auf dem H¨ugel 69, 53121 Bonn, Germany
5 Laboratoire de Physique et Chimie de l’Environnement et de l’Espace LPC2E CNRS-Universit´e d’Orl´eans, F-45071 Orl´eans,
France
6 Station de radioastronomie de Nanc¸ay, Observatoire de Paris, CNRS/INSU F-18330 Nanc¸ay, France
Received 2015 August 10; in original form 2015 July 23
ABSTRACT
Context.Some radio pulsar profiles (in particular those of millisecond pulsars) contain wide emission structures which cover large intervals of pulse phase. Local distortions of an average curve of polarisation angle (PA) can be identified in such profiles, and they are often found to be associated with absorption features or narrow emission components.
Aims. The features may be interpreted as a convolution of a lateral profile of an emitter with a microscopic radiation pattern of a non-negligible angular extent.
Methods. We study a model which assumes that such an extended microbeam of the X-mode curvature radiation is spreading the radiation polarised at a fixed position angle within an interval of pulse phase.
Results. The model is capable of interpreting the strongly dissimilar polarisation of double notches in PSR B1821−24A (for which we present new polarisation data from the Nanc¸ay Radio Telescope) and PSR J0437−4715. It also explains a step-like change in PA observed at the bifurcated trailing component in the profile of J0437−4715. A generic form of the modelled PA distortion is a zigzag-shaped wiggle, which in the presence of the second polarisation mode (O mode) can be magnified or transformed into a W- or U-shaped deflection of a total net PA.
Conclusions. The model’s efficiency in interpreting dissimilar polarisation effects provides further credence to the stream-based (fan-beam) geometry of pulsar emission. It also suggests that the microbeam width may not always be assumed negligible in comparison with the angular scale of emissivity gradients in the emission region.
Key words.pulsars: general – pulsars: individual: PSR J0437−4715 – pulsars: individual: PSR B1821−24A – radiation mechanisms: non-thermal.
1. Introduction
Pulsar polarisation escapes thorough understanding despite more than four decades of increasingly deep study, both observa-tional and theoretical. The association of observed polarisation angle (PA, hereafter also denoted by ψ) with a projection of local magnetic field (Radhakrishnan & Cooke 1969) has strengthened the magnetic pole model of a radio pulsar beam. A mathemati-cal formulation of this rotating vector model (RVM, Komesaroff 1970) gives a chance to determine the global geometric param-eters, such as the magnetic dipole inclination α and the viewing angle ζ, both measured with respect to the rotation axis Ω.
Because of the commonly encountered deviations of the ob-served PA from the simple RVM model, several extensions of the model have been made. Blaskiewicz et al. (1991) included the special relativistic effects on the PA curve (see also Dyks 2008), whereas Hibschman and Arons (2001) also included the mod-ification of a local magnetic field by magnetospheric currents. Statistical studies of single-pulse PA distributions (McKinnon & Stinebring 1998, van Straten 2009) have shown the importance of various ways in which two polarisation modes can be com-bined in the presence of observational noise. Single-pulse anal-ysis of polarisation (Edwards, Stappers & van Leeuwen 2003; Rankin & Ramachandran 2003) has shown a spatial (angular)
or temporal separation of orthogonal polarisation modes, inter-preted either in terms of different refraction properties of these modes (Petrova & Lyubarski 2000; Lyubarsky 2008) or different locations of the modes in the radiation pattern of a specific emis-sion mechanism (Dyks et al. 2010, hereafter DRD10). On the theoretical side, the convolution of a spatially extended emis-sion with microphysical radiation beams has been numerically studied for non-coherent emission processes (Wang et al. 2012, Kumar & Gangadhara 2012) with the inclusion of possible prop-agation effects on the observed polarisation properties (Barnard & Arons 1986; Wang et al. 2010; Beskin & Philippov 2012). In these studies, the angular size of the microphysical radiation pattern was negligible in comparison to the angular gradients of emissivity in the emission region. Instead, in this paper we as-sume that these scales are comparable.
Via statistical modelling of single-pulse effects, Luo (2004) has shown that the microbeam effects are capable of generat-ing perceivable non-RVM distortions when radio waves decou-ple from the local plasma close to the emission region. Melrose et al. (2006) have shown that statistical properties of single-pulse emission in both polarisation modes considerably influence the PA distributions observed at a fixed phase, hence they affect the average PA curve. By assuming appropriate populations of
sin-2 Dyks et al.: Model for polarisation distortions in radio pulsars
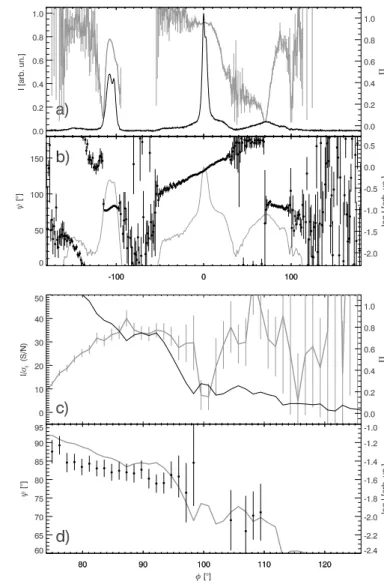
Fig. 1. Linear polarisation properties of PSR B1821−24A as ob-served with GBT in L band (BPDR). Grey curves refer to the vertical axes on the right-hand side. The bottom two panels zoom into the double notches at φ ≈ 100◦. a) Total flux I (black solid) and the linear polarisation fraction Π = L/I (grey). b) The PA (black) and log I (grey). c) The total flux S/N (black solid) and the polarisation fraction (grey). d) The PA (black) and log I (grey). The straight line presents the PA variations anticipated in the absence of the notches. There is a drop in Π and a change in PA at the notches. The zero point of PA (whether observed or modelled) is arbitrary in all figures of this paper.
gle pulses, they were able to reproduce non-trivial distribution of data on the Poincare sphere.
In spite of these developments, it is usually impossible to explain why specific deviations of the average PA curve from the RVM model are observed. Notable exceptions are the orthogonal-mode jumps in PA by about 90◦, which clearly orig-inate from one mode being overtaken by its orthogonal coun-terpart (Cheng & Ruderman 1979, hereafter CR79; Tinbergen 2005). In this paper we attempt to understand less obvious dis-tortions of PA, using a simple physical model of a polarised ra-diation beam, and convolving it with a macroscopic spatial dis-tribution of emissivity. Our approach may be considered com-plimentary to that of Melrose et al. (2006) who modelled the statistical effects of polarised single pulses at a fixed phase. We instead focus on how the microbeam topology relates the PA at
Fig. 2. Linear polarisation properties of PSR B1821−24A ob-served at 1.5 GHz with the Nanc¸ay telescope. The layout is the same as in Fig. 1. The total profile in a) has 2048 samples per period P, whereas resolution of the other data was decreased to 292 bins/P by merging seven adjacent bins.
adjacent pulse longitudes while ignoring most of single-pulse ef-fects. The non-RVM PA distortions may also be caused by multi-ple (Mitra & Li 2004) or radially extended (Dyks 2008) emission heights, return currents (Ramachandran & Kramer 2003), and scattering in the interstellar medium (Karastergiou 2009). None of these effects is included in the present study. Our model has been inspired by the high-quality observations of double notches reported for PSR B1821−24A in Bilous et al. (2015, hereafter BPDR; see Figs. 1 and 2 therein). However, the model is also applicable to the notches and the bifurcated emission component observed on the trailing side of the profile of PSR J0437−4715 (Navarro et al. 1997).
Section 2 describes available polarisation data for pulsars with double features in their average profiles. It is then fol-lowed by the description of model assumptions and the numer-ical method (Section 3). Section 4 presents the results of the model simulations, which are immediately compared to the ob-servations.
2. Observed polarisation of profiles with double features
Bilous et al. (2015) reported high S/N L-band polarimetric ob-servations of a 3.05-millisecond pulsar B1821−24A, which are summarised in our Fig. 1. The profile mostly exhibits a high linear polarisation fraction Π = L/I except for two quasi-orthogonal polarisation jumps at φ ≈ −117◦ and 72◦. A con-siderable drop in Π, however, also occurs at φ ≈ 100◦ where the double notches with a low, shallow central bump are found. Interestingly, even though Π decreases to nearly zero (grey line in Fig. 1c) the PA changes just a little bit, by approximately 15◦ (Fig. 1b and d). Although this change in PA has been described as a jump in BPDR, it may also be interpreted as a zigzag-shaped wiggle around a monotonically decreasing PA (marked with the straight line in Fig. 1d). This work provides a framework which supports this interpretation. In addition to the PA change at the phase of 100◦, the profile of B1821−24A exhibits other inter-esting deflections from a smooth PA curve. There is a zigzag-like wiggle at the second-brightest component (P1, located at
φ = −107◦) and a one-directional PA deflection near the bright-est component (P2, located at φ = 0◦). They are associated with a larger Π and deviate from a smoothly interpolated PA curve less than observed at the double notches. Both P1 and P2 reveal a double structure, although they are not as well resolved and not as symmetric as the prominent double features observed in other pulsars (e.g. the bifurcated precursor of J1012+5307, DRD10). The slight PA distortions associated with these emission compo-nents will be addressed in Section 4.5.
2.1. Observations of B1821−24A with the Nanc¸ay Radio Telescope
The S/N of the profile within the notches observed by BPDR is
≈10 (black solid line in Fig. 1c), which is relatively low. This persuaded us to confirm the presence of the notches using in-dependent observations. PSR B1821−24A is regularly observed with the 100 m equivalent Nanc¸ay Radio Telescope (NRT) as a part of its pulsar timing program. In order to obtain high S/N profile we used 82 observations taken between August 2011 and May 2015 approximately once every two weeks.
The data were recorded with the NUPPI backend (Liu et al. 2014) – a flexible digital signal processor designed for pul-sar observations. First, Nyquist sampled spectra were acquired centred at 1484 MHz in 512 MHz bandwidth with 4 MHz reso-lution producing 128 frequency channels. The data were coher-ently dedispersed in real time using a dispersion measure value of 119.894 pc cm−3 in order to correct for the dispersive delay caused by the interstellar medium (ISM). The data were then transformed from XY auto- and cross-correlations to full Stokes parameters, folded into final full-Stokes pulse profiles with res-olution of 2048 samples per period and written out to disk in PSRFITS (Hotan et al. 2004) format. Each of the 82 observations was then inspected offline for the presence of radio-frequency interference (RFI) using standard pulsar processing tools (PAZ, PSRZAP) from the PSRCHIVE pulsar processing suite (Hotan et al. 2004) by zero-weighting the affected portions of the data.
Flux and polarisation calibration were also performed using the PSRCHIVE software package. A locally generated standard pulsed noise source was recorded to determine the flux scale. The equivalent noise source flux density was obtained by ob-servation of the unpolarised quasar 3C48. Regular obob-servations of linearly polarised pulsar B1929+10 were used to characterise the receiver system’s intrinsic polarisation cross-coupling matrix
(van Straten 2004). The data was then corrected for the effects of rotation measure (RM) using the PSRCHIVE tool RMFIT. This resulted in an average profile with a total integration time of 49.2 hours (≈ 5.8 · 107periods).
The black solid line in panel a of Fig. 2 presents the average profile with 2048 samples per period. To increase the S/N, the rest of the observables in Fig. 2c are plotted after merging seven adjacent bins for a total of 292 samples per period, which is close to the resolution of the BPDR profile. Although the S/N of the Nanc¸ay profile is slightly lower, it does confirm the existence of the double ‘absorption’ feature at φ ≈ 100◦. As in BPDR, the two minima seem to be separated by an indistinct bump. Our data also confirm the change in PA, and the steep decrease in Π nearly to zero at the centre of the notches. In the Nanc¸ay profile P1 and P2 are both clearly double.
Polarised profiles of B1821−24A are also published by Dai et al. (2015), who present the Parkes data at 10, 20, and 50 cm. The change in PA at the phase of the notches is detectable there; however, the double form of the notches or of P1 and P2 is not resolved. The linear polarisation fraction Π considerably de-creases within the notches (from 0.72 to 0.37, Fig. A16 therein), although not down to the near-zero value reported in BPDR. The difference may result from the smearing apparent in the Parkes profile.1
Generally, all available data are consistent with the existence of double ‘absorption’ feature at φ ≈ 100◦, accompanied by the considerable drop in Π and a modest change in the PA value. Bilous et al. (2015) note that giant pulses in B1821−24A occur at the phase of the double notches, and a peak of a narrow com-ponent in an X-ray profile of this pulsar nearly coincides with the notches.
2.2. Linear polarisation of PSR J0437−4715
Another pulsar that will be discussed in terms of our model is PSR J0437−4715, a 5.25 ms pulsar with a long observa-tion record at the Parkes telescope (e.g. Navarro et al. 1997; Oslowski et al. 2014; Dai et al. 2015). Its polarisation proper-ties exhibit interesting similariproper-ties to and differences from the case of B1821−24A. Figure 3 summarises the best available lin-ear polarisation data from Dai et al. (2015).2 Double notches in J0437−4715 lag behind the peak of its brightest component by approximately 69◦and have a pronounced central maximum, reaching a large fraction of the flux observed outside the notches. The linear polarisation fraction Π is decreasing at the minima of the notches by 20-30 per cent of the off-notch value (from 0.75 to 0.6 at the leading-side notch, and by more than a quarter at the trailing notch; see the grey line in Fig. 3c). At each minimum, the PA deflects toward the same direction by ∆ψ ≈ 5◦, which is a different behaviour from B1821−24A. Several other deflec-tions of PA are observed across the profile, including the zigzags in the phase intervals marked with the rectangles in Fig. 3b:
φ ∈ (−70◦, −48◦), φ ∈ (−40◦, −10◦), and φ ∈ (10◦,32◦). These wiggles seem to coincide in phase with broad minima in total intensity, centred at φ ≈ −60◦, −25◦, and 20◦.
There are two more pulsars which exhibit both double notches and PA deflections: B1929+10 and B0950+08. In the 1 The minimum Π measured by BPDR is eight times smaller than its
statistical error, hence this data point is not plotted in panel a of Fig. 1, which only shows the points with Π > σΠ, where σΠis the statistical
error of Π.
2 The data were obtained from the Parkes Observatory Pulsar Data
4 Dyks et al.: Model for polarisation distortions in radio pulsars
Fig. 3. Linear polarisation properties of PSR J0437−4715 ob-served at 1.4 GHz with the Parkes telescope (Dai et al. 2015). The layout is the same as in the previous figures. The rectangles in b) mark the zigzag-shaped PA distortions that are discussed in Section 4.3.
first, the notches are observed at a flux level hundreds of times lower than the peak of its main pulse. Well-calibrated polari-sation data for this weak emission component are not available (L > I in Rankin & Rathnasree 1997). In the case of B0950+08 the polarisation at 1.4 GHz was published in McLaughlin & Rankin (2004), however, for a profile with almost invisible notches, and with a small S/N in L.
3. A model for the polarisation angle deflections
The model assumes that the generic element of a radio emis-sion region in a pulsar magnetosphere has the form of a plasma stream occupying a narrow magnetic flux tube (see Fig. 1 in Dyks & Rudak 2012, hereafter DR12). In a short time interval (quasi-instantaneously), the charges in the stream emit a narrow pattern of radiation beamed nearly along the velocity vector and pointed tangentially to the stream. The angular size of such a microbeam is small but significant, and it needs to be convolved with the spatial extent of the emission region (e.g. with the lat-eral profile of density or emissivity in the stream). When mod-elling the polarisation of notches we assume that the emitted
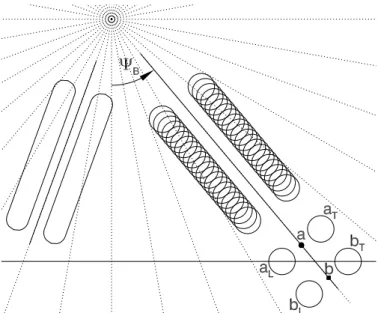
mi-Fig. 4. Sky-projected view of the split-fan beams typical of the X-mode curvature radiation from narrow plasma streams. The continuous beam shown on the left can be decomposed into a sequence of lobe pairs, emitted quasi-instantaneously from dif-ferent points along the stream (shown on the right-hand side), e.g. from the points ‘a’ and ‘b’ in the bottom right corner. The horizontal line marks the passage of the line of sight. The stream’s polarisation angle ΨBis detectable at two pulse
longi-tudes (corresponding to the lobes aLand bT) on the leading and trailing side of the stream.
crobeam has the form of two lobes emitted at a small angle with respect to the plane of the magnetic field (see Fig. 1 in DR12, and Figs. 10 and 11 in DRD10). No radiation is emitted within the plane of the electron trajectory (which in this paper is assumed to coincide with a B-field line). Therefore, charges sweeping along a bent magnetic field, emit a split-fan beam shown on the left-hand side of Fig. 4.
Because the beam is double, each point of the stream (e.g. point ‘a’ in Fig. 4) creates two bright patches of emission on the sky (aL and aT). Therefore, a fairly localised piece of emission region, (e.g. the stream segment between ‘a’ and ‘b’ in Fig. 4) can be detected at two different phases in the profile. For the sightline passing along the horizontal path in Fig. 4, the a-b seg-ment will be detected at the lobe aLand bT.
The process of curvature radiation (CR) in the extraordinary polarisation mode (hereafter the X mode or ⊥-mode) provides an example of such a double-lobed beam. The CR beam emitted in vacuum can be mathematically decomposed into two parts: a filled-in pencil beam polarised in the plane of the B-field and the bifurcated beam polarised at the right angle to the plane of B (see Eq. 6.29 in Rybicki & Lightman 1979; Konopinski 1981, p. 305). In a strongly magnetised plasma, the emitted beam gets decomposed into a similar filled-in part polarised parallel to the B-field line plane (O mode) and a bifurcated X-mode part. In the limit of plasma in infinite magnetic field, only the X mode is emitted, again with the bifurcated beam pattern, and polarised at a right angle with respect to the B plane (Gil et al. 2004). To study the qualitative implications for the observed PA, it is sufficient to use the vacuum formula for the beam shape, which we do in Sect. 3.1 (Eq. 1).
In the quasi-instantaneous X-mode beam, however, the radi-ation is polarised in the k × B direction (see Fig. 1 in CR79 or
Fig. 16 in DRD10), where k is the wave vector pointing towards the observer. The quasi-instantaneous polarisation direction then strongly depends on where exactly our line of sight is pierc-ing the microbeam. A movpierc-ing charge is passpierc-ing this microbeam through our line of sight in a nanosecond timescale (∆t ∼ 1/ν, where ν is the observed frequency). During that time, a limited segment of the charge’s trajectory of length ∆s ∼ cγ2∆t is
ex-posed to the observer. For the charge’s Lorentz factor of γ ∼ 102, the detectable segment is few kilometers in length. The horizon-tal motion of the sightline through the lobe aLin Fig. 4 is several orders of magnitude slower than the fast sweep of the lobe along the guiding magnetic field line. Therefore, if the emissivity does not change along that detectable part of electron trajectory, the observer is exposed to a time-symmetric signal of intensity and an antisymmetric signal of PA. These symmetries ensure that the net PA is orthogonal to the projected B-field for an arbitrary location of sightline in the fully swept-by beam (the split-fan beam).3
Accordingly, the lobe aL, after fully passing through our line of sight, will contribute the PA fixed at the phase-independent value of ψB = ΨB + 90◦, where ΨB is the PA corresponding
to the sky-projected direction of the magnetic field at point ‘a’. Analogically, the trailing-side lobe bT will be polarised at the same angle ψB, because the same magnetic azimuth corresponds
to the emission point ‘b’. If the emissivity and curvature of the B-field line do not change considerably between points ‘a’ and ‘b’, a symmetrical double-peaked emission component will be ob-served. It will be highly polarised and have a phase-independent PA.
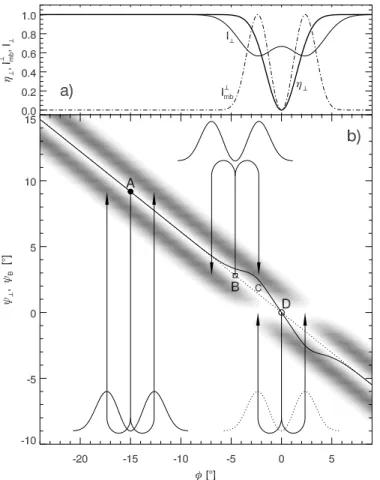
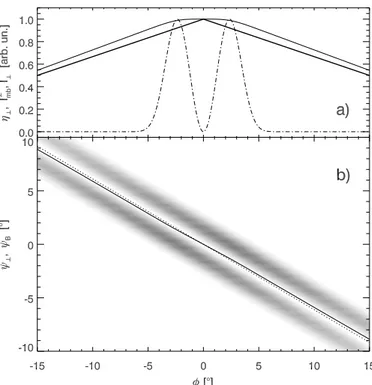
The key assumptions of our model are then the following: 1) At least some parts of average profiles (especially those which exhibit bifurcated features) consist of elementary radiation pat-terns which have the double-peaked cross section such as shown by the dot-dashed line in Fig. 5a. This one-dimensional version of the microbeam pattern (denoted I⊥
mb) needs to be convolved with the macroscopic distribution of emissivity η⊥ within the radio-emitting region; 2) It is assumed that both lobes of the mi-crobeam are highly polarised at a fixed angle (of 90◦ for the X mode) with respect to the projected direction of the magnetic field line at the emission point corresponding to the observed lobes. A reference will be provided by the RVM PA value for the X mode (ψB) or the O mode (ΨB).
3.1. Numerical method
Double notches and bifurcated emission components are be-lieved to be caused by a single void or peak in the spatial emis-sivity profile η⊥. The double form results from the bifurcated na-ture of the microbeam which is convolved with this spatial emis-sivity (DRD10; DR12; cf. older models based on different con-cepts: Wright 2004; Dyks et al. 2007). Therefore, we start with a choice of the macroscopic emissivity η⊥as a function of phase. In most cases we assume that η⊥ has a narrow Gaussian dip (or peak) carved in (or projecting from) a uniform emission compo-nent. An example of this η⊥is presented by the thick solid line 3 This condition of uniform emissivity applies to each electron
in-dividually. However, the single-pulse emission, as determined by the longitudinal plasma density profile in the stream among others, may ex-hibit arbitrary variability. For this reason, the model is consistent with the observed randomness of subpulse shapes (cf. Sect. 3.2 in Luo 2004). However, it is not generally applicable for any pulse components, in particular those for which the single-charge emissivity is variable on the timescale of γ2∆t or those for which our sightline is just grazing the
periferies of the full split-fan beam.
in Fig. 5a. This emissivity is convolved with the perfectly sym-metric elementary emission pattern (dot-dashed line in Fig. 5a). We neglect a possible asymmetry of this micropattern, that may appear while the charges move between points ‘a’ and ‘b’ in Fig. 4. Such asymmetry (and a related distortion of PA) is gener-ally expected when the radio emissivity varies with altitude and the sightline traverses through the split fan at an oblique angle (see Fig. 2 in DR12). Therefore, the dot-dashed line in Fig. 5a presents an effective pattern of the microbeam, mostly formed by emission from different points (‘a’ and ‘b’ in Fig. 4). For the effective microbeam shape we take that part of the vacuum CR beam which is polarised orthogonally to the plane of a B-field line I⊥mb∝ξK1/32 (y) sin2(φ − φ′), (1) where ξ =1/γ2+ (φ − φ′)2, y = 2πνρcrv 3c ξ 3/2, (2)
K is the modified Bessel function, φ′ is the phase of the mi-crobeam centre, and γ is the Lorentz factor of the emitting par-ticles (Rybicki & Lightman 1979). The magnification of the ap-parent microbeam through the non-orthogonal sightline cut at a possibly small α (section 2.2 in DR12) is ignored, i.e. the ob-served width of the microbeam ∆ is set only by the values of
ρcrvand ν. The latter are selected to make the microbeam a few degrees wide in the observed profile. The Lorentz factor γ is fixed at a large (but otherwise arbitrary) value, because neither the scale nor shape of the microbeam depend on γ, whenever
γ ≫(νρcrv/c)1/3. To perform the convolution, a prescription for the B-field-based (RVM) PA curve is selected. Since we focus on narrow phase intervals, we approximate the PA with a lin-ear function of phase (straight dotted line in Fig. 5b). For each pulse phase φ, the contributed flux of the microbeam (centred at an arbitrary phase φ′) is scaled by η
⊥(φ′) and it is assumed to be fully linearly polarised at the angle ψB(φ′). Thus, most of the
flux cumulated at φ originates from two nearby phases on both sides of φ. Since these phases contribute their own values of ψB,
the intrinsic distribution of PA at a fixed φ has a double-peaked form (Fig. 5b), with no radiation corresponding to the central value of ψB(φ). However, the average value of the observed PA,
(denoted by ψ⊥ since it refers to the X mode only), is equal to
ψB(φ). When doing the convolution, we make the normal
transi-tions between I, L = (Q2+ U2)1/2, ψ = 0.5 arctan(U/Q) and the Stokes parameters I, Q = L cos(2ψ), U = L sin(2ψ). The circular polarisation and propagation effects are not studied in this work.
4. Results
In this section we present typical PA distortions implied by the model and discuss them in the light of observations described in Sect. 2. When we refer to data, model parameters are selected manually to obtain a qualitative agreement.
4.1. Origin of PA deflections at double notches
The convolution of the microbeam (dot-dashed line in Fig. 5a) with the spatial emissivity η⊥(thick solid line) produces the dou-ble feature shown by the thin solid line in Fig. 5a. This means that a microbeam such as the one shown in the bottom right cor-ner of Fig. 5b (dotted line) is not contributing its PA at the blank gap around point D in the greyscale distribution of PA. The aver-aging of PA at the phase marked with C then leads to the upward
6 Dyks et al.: Model for polarisation distortions in radio pulsars
Fig. 5. Mechanism of the bidirectional (zigzag-shaped) PA dis-tortion. a) Effective microbeam pattern Imb⊥ (dot-dashed line), and the macroscopic X-mode emissivity η⊥(thick solid) are con-volved into the net intensity profile I⊥ (thin solid). b) PA as a function of phase. The slanted solid line marks ψ⊥, i.e. the net value of the X-mode PA calculated as a fixed-phase average of the bifurcated grey band. The dotted line marks the RVM-based reference (ψB). The double-peaked microbeams, with
ar-rows emerging from points A and B, show how the PA is dis-tributed within the neighbouring pulse longitudes. The void as-sumed in η⊥ at D (φ = 0) creates the horizontal break in the bifurcated PA band (grey). The resulting imbalance of the PA averaging produces the thick solid PA wiggle.
deflection of the net PA because the flux at C is dominated by emission from the phase B, with a larger PA. On the right-hand side of D, the same effect leads to a downward PA deflection of the same magnitude. The outcome is a zigzag-shaped wiggle of the net PA around the reference ψB.
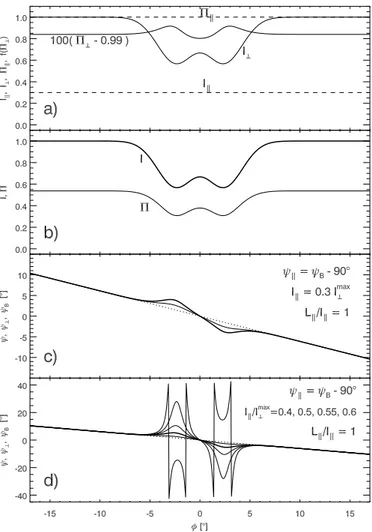
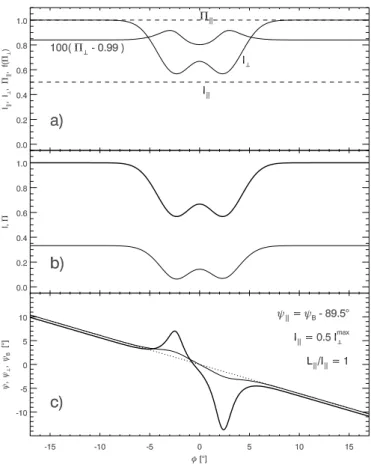
Fig. 6 presents the calculation made for a Gaussian void in the emissivity: η⊥= 1 − exp(−0.5φ2/σ2η), with ση= 1.53◦(thick solid line in panel a), and for the microbeam of the apparent half size δmb = 2.34◦ (dot-dashed line). The reference PA was as-sumed to change with phase at a rate similar to that observed in PSR B1821−24A: ψB = −0.6φ (dotted line in Fig. 6c; straight
solid line in Fig. 1d). The net PA is shown in panel c by a thick solid line, which is made thinner in the central region of the notches where the observed PA is unavailable because of the insufficient S/N. There is a flattening of PA in the outer wings of the notches, which makes the impression of a discontinuous jump in PA similar to the one observed in B1821−24A. Panel b presents the intensity profile (thick solid line) and the linear polarisation fraction Π⊥(top thin line). It is clear that the
convo-Fig. 6. Result of a calculation which produces the PA wiggle at a nearly merged double notch feature. a) Microbeam inten-sity Imb⊥ (dot-dashed line) and the macroscopic emissivity with a Gaussian cavity at φ = 0 (thick solid). b) Net polarisation frac-tion Π⊥(top thin solid) and net X-mode intensity profile (thick solid). The Π⊥is slightly smaller than 1, as shown by the bottom thin line presenting the quantity 100(Π⊥−0.99). c) Net X-mode PA (ψ⊥, solid) overplotted on the reference ψB(dotted). The
cen-tral part of ψ⊥is thinner to reflect the lack of high-quality data points at the centre of notches in B1821−24A (see Figs. 1d and 2d). The result is for ση= 1.53◦, ψB = −0.6φ, ρcrv = 5 × 104cm, and ν = 1 GHz.
lution of a single-mode (X-mode) radiation with similar values of PA (as constrained by the double-peaked PA distribution in Fig. 5b) does not produce perceivable depolarisation. A plot of 100(Π⊥−0.99) reveals that outside the notches Π⊥drops by less than one per cent and is larger at the minima because the contri-bution of depolarising radiation (from a second lobe) is missing there. The modelled change in PA at the notches (by about 6◦) is two times smaller than observed in B1821−24A.
The increase in Π⊥and the small change in PA at the notches are inconsistent with the observations of B1821−24A; however, the result of Fig. 6 does not include the possible contribution of the other polarisation mode, i.e. the ordinary mode (O mode, or
k-mode), which is polarised parallel to the sky-projected B-field. In the following we use the term ‘net PA’ to describe the net (average) PA of a single polarisation mode (either X or O). For an average PA which contains both modes we use the term ‘total net PA’ (or just ‘total PA’).
4.2. Polarisation of notches in the presence of two modes
The effects of adding the O mode are illustrated in Fig. 7, calcu-lated for the same parameters of the X mode as before. We have
Fig. 7. Polarisation of double notches in the presence of two po-larisation modes. a) Intensity and popo-larisation fraction for both modes (⊥-mode: solid line; k-mode: dashed line). Π⊥is indistin-guishable from Πk = 1, hence we plot 100(Π⊥−0.99). b) Total intensity (thick solid line) and the total Π (thin line). c) Total PA
ψ(thick solid line) overplotted on the net PA of the X mode (ψ⊥, thin solid line), and the reference ψB of the RVM model
(dot-ted line). The contribution of the O mode increases the off-RVM amplitude of the total PA. d) Same as in c, but for the increasing contribution of the O mode: Ik/Imax⊥ = 0.4, 0.5, 0.55, and 0.6. The last case (thin line with spikes) undergoes the orthogonal-mode jumps. The unspecified parameters are the same as in Fig. 6.
added a fixed amount of the O mode (Ik = 0.3I⊥max) polarised strictly at a right angle with respect to the reference (RVM) PA of the X mode (ψk = ψB −90◦, i.e. the O mode is polarised
along the projected B field). The linear polarisation properties of both modes are shown in panel a, with I⊥referring to the net profile of the X mode (I⊥ results from the convolution of the curves shown in Fig. 6a). The total net profile (thick solid line in Fig. 7b) shows a drop in I down to 0.55 at the notches’ minima. The total polarisation fraction Π (thin line in panel b) is now de-creasing from 0.54 to 0.3, in qualitative agreement with the ob-servations of B1821−24A. The wiggle of PA (panel c) extends over a larger interval because the O mode ‘attracts’ any non-orthogonal PA values to itself. The presence of the other polar-isation mode then tends to magnify any slight deviations of the primary PA from strict orthogonality. Depending on the relative proportions of both modes, the amplitude of the wiggle can eas-ily be arbitrareas-ily increased. Fig. 7d, calculated for Ik/Imax⊥ = 0.4,
0.5, 0.55, and 0.6, presents how the PA deviation (∆ψ = ψ − ψB)
grows with the increasing contribution of the k-mode. For the se-lected parameters (i.e. for the assumed change in ψB across the
microbeam width), ∆ψ exceedes 10◦for I
kapproaching I⊥with an accuracy of 10%. The largest distortion (for Ik = 0.6Imax⊥ , thin line with spikes) shows the jumps in PA by ±90◦caused by the dominance of the O mode over the primary X mode at the minima of the notches.
The ease of obtaining such large distortions is an impor-tant phenomenon which has a crucial role in shaping the ob-served average PA curve: tiny distortions of PA from the refer-ence ψB, become strongly magnified by the contribution of the
other mode. The original (small) distortions in a single mode naturally result from the non-uniformity of the emission region (convolved with the properties of the microbeam). This makes the primary PA distribution at a given phase a little asymmet-ric with respect to the reference ψB. The incoherent
contribu-tion of the second polarisacontribu-tion mode can amplify these origi-nal PA deflections (characteristic of a single mode) to a very large magnitude, easily comparable to the 90◦ separation be-tween the modes. When both polarisation modes have compara-ble flux, the net PA may be essentially arbitrary, which leads to the randomisation of the fixed-phase PA distributions described in McKinnon & Stinebring (1998) and Melrose et al. (2006).
At a fixed phase, each polarisation mode may then be ex-pected to have the form of an intrinsic PA distribution with a finite width and with a specific shape, which is in general asym-metric with respect to ψB. Therefore, the PA ‘curve’ of pulsars
should rather be understood as a PA stripe or band, as is fre-quently viewed in the greyscale plots presenting the PA dis-tribution as a function of phase (e.g. Stinebring et al. 1984; Edwards & Stappers 2004; Hankins & Rankin 2010; Oslowski et al. 2014). The total net pulsar polarisation can be under-stood as the interaction of these two quasi-perpendicularly po-larised bands of PA. Any skewness of such a PA stripe (i.e. of a single-mode PA histogram at a fixed phase) results in deflec-tions which can be strongly enlarged by the second polarisation mode. However, if both polarisation modes are observed simul-taneously, only the total distribution of PA may be perceivable at a fixed phase and the details of each mode PA distribution undetectable. As explained in Section 4.6, even if the pure X mode is detectable with negligible noise, the bifurcated PA dis-tributions are unlikely to be observable. Our search for them in J0437−4715 was indeed unsuccessful.
The agreement of Fig. 7 with the polarisation data on the double notches in B1821−24A is qualitative only. For example, the modelled polarisation fraction Π does not decrease to such a low value as observed, and is actually slightly larger at the centre of the notches than at the minima. The amplitude of the modelled PA swing barely reaches 10◦as compared to the observed value of 15◦. There may be several reasons for these differences, and we discuss them in Sect. 5.
4.3. Interpreting the polarisation of PSR J0437−4715
The secondary (k) polarisation mode is subject to different con-ditions of amplification and propagation (Melrose 2003; Wang, Wang & Han 2015; Beskin & Philippov 2012). It may undergo its own deflections from ψB, as determined by the skewness of
mode PA distributions, resulting from the convolution of the O-mode emissivity with the O-O-mode microbeam. Since the O-mode is prone to additional propagation effects, e.g. a refraction, the PA of the O mode may possibly be even far from its RVM track. In this paper all these O-mode deflections are parametrised as a
uni-8 Dyks et al.: Model for polarisation distortions in radio pulsars
Fig. 8. Polarisation of double notches in the presence of a con-siderable amount of a quasi-orthogonal secondary polarisation mode (ψk = ψB−89.5◦, Ik= 0.5Imax⊥ ). The layout is the same as in panels a-c of Fig. 7. The PA wiggle in panel c acquired large amplitude and became asymmetric. Unspecified parameters are the same as before.
form shift of ψkwith respect to ΨB, where ψkdenotes the net PA of the parallel mode. We then assume ψk= ΨB+ǫk= ψB−90◦+ǫk, with a small or moderate value of ǫk. This simplification is done to make interpretation easier because in real data the total net PA results from an interplay of the X-mode deflections with the deflections of the O mode.
The summation of such quasi-orthogonal modes (Fig. 8c) slightly displaces the whole net PA curve towards ψk, increases the amplitude of the wiggle, and makes it asymmetric. The wig-gle of Fig. 8c resembles those observed for J0437−4715 in the phase intervals: (−70◦, −58◦), (−40◦, −14◦), and (13◦,33◦) (in-dicated by rectangular boxes in Fig. 3b). As in our simulation, the observed wiggles seem to be associated with minima in in-tensity, revealed by the abrupt changes in the intensity gradient, e.g. at φ = −65◦, −10◦, 10◦, and 15◦. They may also be traced to double minima in Π (grey line in Fig. 3a). The wiggles may then be interpreted as the result of the φ-dependent skewness of the X-mode PA histogram, with the two-directional bias of PA induced by the broad absorption features. Since the observed width of these structures is several times larger than the scale of double notches, their origin is likely dominated by the effects of macroscopic emissivity.
In the case of J0437−4715, the PA at both minima of the dou-ble notches deflects in the same direction, which makes it dif-ferent from B1821−24A. This behaviour readily appears in the model under some circumstances: when the linearly polarised X-mode flux drops considerably at the minima and the O X-mode is not too close to orthogonality with respect to the X mode
(mod-Fig. 9. Polarisation of double notches in the presence of a slightly non-orthogonal secondary polarisation mode (ψk= ψB−
80◦, Ik = 0.3I⊥max). The dashed line in c presents ψoff, i.e. the in-terpolated off-notch trend of the total PA. The total PA at both minima is located below ψoff (see the explanation in Fig. 10).
erate ǫk). In Fig. 9c the O mode is 10◦ off orthogonality, so the overall PA curve is displaced down to the dashed line, which marks the interpolated off-notch trend ψofffor the total PA. Even at the leading-side minimum (φ ≈ −2◦), where the net X-mode PA was above the RVM-based value (ψ⊥ > ψB), the
contribu-tion of the O mode drags the PA across ψBand we get ψ < ψB.
Remarkably, however, the resulting value of the total PA at that phase is even smaller than ψoff, so the PA at both minima stays below the dashed line.
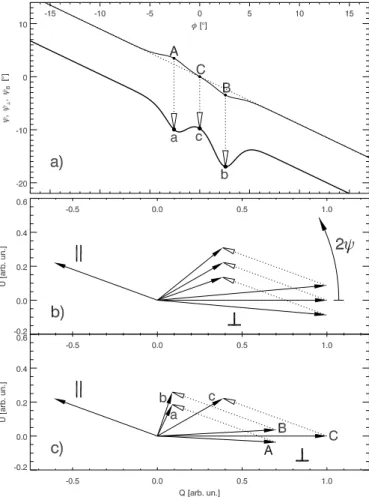
The value of ψ at the centre of the notches does not un-dergo such a large shift and remains closer to ψoff. The reason for which the PA at the leading-side minimum gets overdrawn to the other side of both ψoffand ψB(as compared to its original
lo-cation) is illustrated in Fig. 10. Because of the low polarised flux at the minima, the Stokes vectors representing (L⊥, ψ⊥) (marked with A and B in Fig. 10c) are shorter than the vector C which corresponds to the notches’ centre. Therefore, the addition of the same k-mode vector (representing the fixed amount of the parallel mode) is capable of inducing much larger rotation of PA towards ψkat the minima. Without the drop in flux at the minima, this effect does not show up (Fig. 10b).
Fig. 11 presents a calculation performed to roughly repro-duce the characteristics of the notches in J0437−4715. A rect-angular void in η⊥ has been assumed to reproduce the large depth of notches with a high central maximum (the observed depth possibly approaches ∼ 50%, though the absolute zero flux level for J0437−4715 has not been determined rigorously). For
Fig. 10. Mechanism of transformation of the bidirectional PA distortion (the thin solid X-mode wiggle in panel a) into a one-directional W-shaped deflection of the total PA (thick solid). The Stokes vectors associated with the marked points are shown schematically in panel c. Those with small letters (a, b, c) are the sum of the corresponding X-mode vectors (A, B, C) with the quasi-orthogonal k-mode vector shown on the left. The tran-sition to the W-shaped PA is mainly caused by the drop in the X-mode flux at the minima of double notches (short vectors A and B). Panel b presents a similar sum for the case with no drop in polarised flux at A and B (all ⊥-mode vectors have the same length).
reproduces the 20% drop in Π and the ∼ 5◦ change in PA (the observed deflections are 4◦at the leading-side minimum and 6◦ at the trailing minimum). The modelled deflection of PA reveals similar asymmetry. However, the drop in Π at the trailing min-imum is a bit smaller than at the leading minmin-imum, in contrast with observations (Fig. 3c). Possible reasons for these discrep-ancies are discussed in Sect. 5.
The observed PA exhibits an interesting behaviour at the bi-furcated trailing component (BTC) in J0437−4715 (Fig. 12). On the right-hand side of the BTC, the PA appears to change lin-early; however, it undergoes a step-like drop at the centre of the BTC (dots in panel b). Such a step-like change in PA is natu-rally expected in our ‘fixed-PA microbeam model’ if the emis-sivity η⊥changes more steeply on the leading side of the BTC. Fig. 12 (c and d) presents a sample result obtained for η⊥which rises quickly on the BTC’s left-hand side (following a Gaussian), but decreases linearly on the right (thick line in c). The step-like drop in PA occurs because the PA makes a transition from the single-lobe-dominated value on the left-hand side to the net
Fig. 11. Model results aimed at reproducing the observed prop-erties of the double notches in J0437−4715 (see Fig. 3). A rect-angular void in emissivity, of a half width equal to 0.9◦ (thick line in a), has been assumed to raise the central maximum of I at φ = 0. The layout of panels b-d is analogous to panels a-c in Fig. 7. List of parameters: ψB = −0.9φ, ψk = ψB −60◦,
Ik= 0.3Imax⊥ , ρcrv= 1.4 × 105cm, ν = 1 GHz.
value close to ψBon the right-hand side (see the thin solid curve
for ψ⊥ in panel d). If a fixed fraction of the O mode is added (Ik = 0.3I⊥(φ), Π ≈ 0.54), then the total PA assumes the shape shown with the thick solid line in panel d. The model result does not reproduce the relative flux of the BTC’s peaks (see the thin solid line for I⊥ in panel c). However, the calculation does not take into account several factors that influence the ratio. These include 1) the likely asymmetry of the flux and PA in the effec-tive microbeam, which appears for a non-orthogonal traverse of the sightline through a non-uniform split-fan beam (see Fig. 2 in DR12); 2) the profile of the O mode, the amount of which is increasing towards the left-hand side of the BTC, as suggested by the observed Π (grey line in a); and 3) the relative steepness of η⊥on both sides of the BTC (a guess form of η⊥ was used in Fig. 12). Detailed modelling of this feature is deferred to a future study.
4.4. Non-bifurcated microbeam
In the case of the centripetal acceleration the ordinary mode is emitted into a single-peak microbeam of non-negligible width, such as that shown with the dot-dashed line in Fig. 13. We as-sume that the perceived PA is the same at any direction within the beam and equal to the projected direction of the B-field (ΨB).
10 Dyks et al.: Model for polarisation distortions in radio pulsars
Fig. 12. Comparison of the observed (panels a and b) and mod-elled (c and d) properties of the bifurcated trailing component (BTC) in J0437−4715. The observed properties (I and Π in a;
ψand log I in b) present a zoomed part of Fig. 3. The arrow in b marks a step-like change in PA at the centre of the BTC (the PA is shown with dots). A similar step-like change in PA (solid lines in panel d) occurs for a one-sided emissivity profile (η⊥, thick solid in c) which is decreasing gradually (linearly) on the right-hand side, but much more steeply on the left-hand side (a half-Gaussian with ση= 1◦). The thin solid line in d presents ψ⊥, whereas the thick line presents ψ obtained for a fixed fractional contribution of the O mode: Ik = 0.3I⊥(φ). This is an exemplary result obtained for ψB= −0.9φ, ρcrv = 5 × 104cm.
In this subsection the void in the emissivity will be applied for the O mode only, ηkrefers to the macroscopic emissivity of the O mode, and Ikmbrepresents the O-mode microbeam pattern. By analogy to the X mode (eq. 1), it is assumed that the O-mode microbeam can be approximated by that part of the vaccum CR beam which is polarised in the plane of the guiding B-field line, i.e. Ikmb∝ξ2K2
2/3(y) (Rybicki & Lightman 1979).
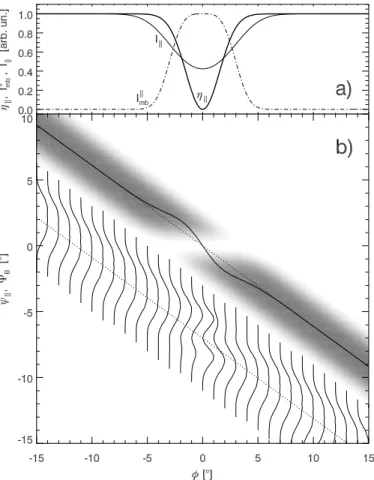
If the other polarisation mode is absent, then a small-amplitude wiggle of PA also appears for the non-bifurcated O-mode beam. This occurs because the single-O-mode deflections de-pend on the asymmetry (or skewness) of the PA distributions at a fixed-phase. In the case of the single-peaked microbeam, the asymmetry is produced by the outer wings of its radiation pat-tern (Fig. 13). Because of the beam’s extension, a narrow dip in emissivity (thick solid line in panel a) results in the horizontal break in the grey PA distribution shown in panel b. The result-ing fixed-φ histograms of PA, which are plotted every 1◦below the grey PA band, are clearly skewed in opposite directions on either side of φ = 0◦. The net PA then exhibits a wiggle similar
Fig. 13. Origin of the zigzag-shaped PA wiggle in the case of the filled-in microbeam of the O mode. The layout is similar to that of Fig. 5, except for the fixed-phase PA distributions which are plotted at 1◦phase intervals in panel b. The minimum in ηk pro-duces the single-minimum dip in the net O-mode intensity (Ik, thin solid line in a) as well as the blank gap in the non-bifurcated grey PA band (panel b). The PA wiggle is again produced by the imbalance of the PA averaging.
to the one for the bifurcated beam, albeit of a smaller ampli-tude. Close to φ = 0◦, where the flux is low, the PA distribution becomes double (the fixed-phase PA histograms in Fig. 13b are normalised to the same peak value).
In the presence of both modes, however, the total PA has different properties than in the previously described case of the void convolved with the bifurcated microbeam. This occurs be-cause the void in ηk produces a single dip in Ik, with the min-imum value (Ik = Ikmin) at the centre (φ = φmin = 0), whereas the maximum deflection of PA occurs in the wings of the feature (at φmax ,φmin).4Therefore, when the contribution of the other mode (X) is increasing, I⊥ first reaches Ikat φmin and produces the orthogonal PA jump there before it is able to considerably distort ψ at φmax. If the modes are strictly orthogonal outside the notches (ψ⊥ = ψB and ψk = ΨB), a large-amplitude
wig-gle similiar to those shown in Fig. 7d can only appear for finely tuned parameters: L⊥ ≈ Lk(φmin) (and L⊥ < Lk) with accuracy of the order of 1%. Otherwise, the wiggle’s amplitude does not increase considerably or the PA jumps by 90◦at φ
min. For modes
4 The subscript ‘min’ refers to the minimum flux of the primary
po-larisation mode (here Ik), whereas ‘max’ to the maximum deflection of
this primary mode PA from the reference PA (here ∆ψk= ψk− ΨB). If
the void is in ηk, we have a single notch with φmin,φmax. For a narrow
Fig. 14. Influence of the secondary polarisation mode (this time it is the X mode) on the polarisation of a single notch domi-nated by the primary O mode. A Gaussian void in emissivity ηk of width ση = 2.53◦is now applied only for the O-mode emis-sion. The layout is analogous to that of Fig. 7, except in panel d the modes are not precisely orthogonal (ψ⊥ = ΨB−85◦). The
contribution of the X mode does not much increase the ampli-tude of the PA wiggle in panel c (cf. Fig. 7c). The slight non-orthogonality of 5◦(panel d) transforms the zigzag-shaped wig-gle into a one-directional U-shaped distortion of PA (imagine a variant of Fig. 10c with the vector C shorter than A and B). List of parameters: ψk= −0.6φ, ρcrv = 104cm, ν = 1 GHz.
that are not exactly orthogonal (ψ⊥ ,ψB), the bidirectional
de-flection of PA (i.e. the wiggle of Fig. 14c) quickly acquires a U-shaped form (Fig. 14d), i.e. it becomes a feature with a sin-gle minimum instead of either the zigzag shape or the W shape. This occurs because the total PA is mostly determined by the U-shaped drop in the net O-mode flux (see the curve for Ik(≈ Lk) in panel a) and much less by the small zigzag deflection of the net PA (panel c). As shown in Fig. 10c, the total PA is mostly determined by the amount of the linearly polarised flux of the primary mode, rather than its PA. This flux (Lk) is minimal at the centre of the U-shaped feature, hence the largest deflection of the total PA occurs there (Fig. 14d). Thus, the total PA also follows a U-shaped curve, just like the Ik(or Lk) does.
We then conclude that the lack of emission at the centre of the microbeam facilitates the appearance of the wiggle-shaped deflections of PA in the average profiles. This is consistent with the fact that the profiles of PSR J0437−4715 and B1821−24A
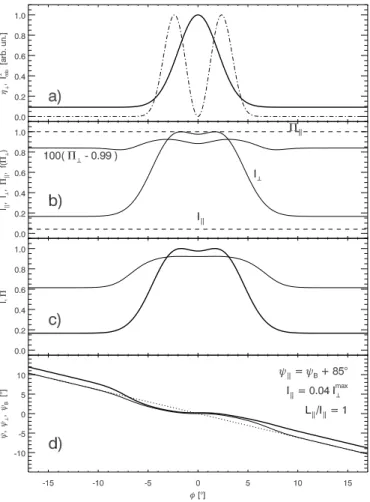
Fig. 15. Modelled polarisation of a bright narrow component projecting from an isotropic background emission. The PA curve exhibits a flattening under the component (panel d), caused by the fixed PA attributed to the microbeam. A small uniform con-tribution of the O mode (Ik= 0.04I⊥max) produces the off-centred, one-directional distortion of PA (thick line in d). Used parame-ters: ψk= ψB+ 85◦, ρcrv = 5 × 104cm.
contain both the wiggle-shaped PA deflections and the bifurcated features (the notches and the bifurcated emission components).
4.5. PA deflections at profile emission components
In the case of PSR B1821−24A, some small distortions of PA appear under its two brightest components (P1 and P2), both of which are double. The wiggle of PA at the second brightest peak (P1 at φ = −105◦in Fig. 1) looks deceptively similar to the mod-elled distortion described for the absorption features (Figs. 6c, and 7c,d). On the other hand, the brightest peak in the profile of B1821−24A (P2 at φ = 0 in Fig. 1), has the PA which de-flects in one direction only (no zigzag) and the deflection is not phase-aligned with the peak; instead, it is located on its leading side.
As shown in Fig. 15, the fixed-PA microbeam model can eas-ily produce off-centred one-directional PA distortions, albeit not of the type observed for the peaks of B1821−24A. Fig. 15 has been calculated for a slightly wider maximum in the X-mode emissivity, η⊥ = 0.1 + 0.9 exp(−0.5(φ/2◦)2), to reproduce the nearly unresolved main component of B1821−24A (P2). When a small amount (only 0.04Imax⊥ ) of a quasi-perpendicular O mode is added (ψk= ψB+ 85◦), the linear polarisation fraction stays very
12 Dyks et al.: Model for polarisation distortions in radio pulsars
single deflection on its leading wing (thick line in d). The zigzag disappears because the convolution of the two modes aligns the off-notch trend of the total PA with the net X-mode PA in the trailing half of the component.
This result is somewhat similar to the observed one; how-ever, unlike in the observation, the PA in Fig. 15 is decreasing with increasing pulse phase φ, i.e. the PA gradient S = dψB/dφ
is negative. Had we changed the sign of S to the observed (pos-itive) value, the one-directional deflection would move to the trailing side of the peak, in conflict with the observation. Had we additionally changed the sign of the modal non-orthogonality (taking ψk = ψB−85◦), the total PA deflection would move to
the leading side, but it would be protruding upward, again in-consistent with data. The reason is that the addition of a bright X-mode component to a low-level X-mode background always results in a flattening of the net PA gradient under the added com-ponent (thin solid line in Fig. 15d); whenever the microbeam width is larger than (or comparable to) the width of the peak in η⊥, the added component contributes the fixed PA value, so a brightening in a profile should always be associated with the flattening of the PA curve. In contrast with this implication, the PSR B1821−24A (though not J0437−4715) exhibits increased
|S | under the bright emission components. A possible reason for this discrepancy may involve unrecognised single-pulse effects (cf. Melrose et al. 2006).
An observational detail that may be of great importance is that a single orthogonal-mode jump (at φ ≈ 70◦in Figs. 1b and 2b) separates the P2 from the double notches in B1821−24A. Therefore, if the notches are interpreted as the signature of the bifurcated X-mode beam, the highly-polarised P2 (and also P1, with its PA being an extrapolation of the linear trend observed near P2) should be dominated by the O-mode emission in the form of the filled-in (non-bifurcated) beam. The bifurcations of the P1 and P2 should then probably be interpreted in terms of macroscopic properties of the emitter or in terms of propagation effects. A possible origin of such macroscopic bifurcations has been suggested in Dyks & Rudak (2015, see figure 12 therein).
Our model of polarisation (based on a wide microbeam) im-plies that any changes in flux in the profile must be unavoidably accompanied by small deviations of PA from the RVM. When the profile emission components extend for wide intervals of phase, and when the flux changes slowly, then the PA distor-tions are not visible as clear local features; however, the net PA is not likely to precisely follow the RVM-based value. This is shown in Fig. 16 where the X-mode η⊥has the form of a wide triangle (thick solid in panel a). The gradual distortion of the net PA (flattening near the flux maximum) is visible in panel b.
4.6. Double-peaked PA distributions
The presented model is supported by the existence of the bifur-cated features in the profiles of B1821−24A and J0437−4715. Superficially, however, one might expect a stronger support to come from a direct observation of the double-peaked PA distri-butions, such as shown in grey in Fig. 5b. The peaks of the pure X-mode PA distributions are separated by ∆|dψB/dφ|, where ∆ is the observed scale of double features. In most cases
dis-cussed before |dψB/dφ| ∼ 1, thus the separation is of the order
of a few degrees. We have searched for the PA bifurcations in J0437−4715 using the polarisation calibrated single-pulse data described in detail in Osłowski et al. (2014). The search was un-successful, even within this part of the profile which contains bifurcated features.
Fig. 16. Polarisation of a very wide emission structure with the triangular emissivity pattern shown in panel a (thick solid line). The net PA (solid line in panel b) nearly follows ψB, but not
exactly.
This can be understood, however, and does not pose a prob-lem for our model because the flux detected at any moment is a convolution of several intrinsic signals (not to mention the in-strumental noise) which can strongly affect the observed two-dimensional (φ, ψ) distributions. Specifically, the flux in each peak of the double PA distribution (as observed at a fixed phase) corresponds to emission from two different (but nearby) phases, and two different (but closely located) emission points in the magnetosphere. For example, at the phase C in Fig. 5, one of the PA peaks originates from phase B, and another one from phase D. If the two emitting points permanently contribute both these PA peaks, only their average (close to ψB) will be
de-tectable at any moment in single-pulse observations. Therefore, for the PA bifurcation to be visible even in the pure X mode, non-simultaneous contributions of flux from both phases should occur. During one star rotation, the flux at the considered phase would have to be strongly dominated by emission from one phase (e.g. B), during another rotation by the other phase (D). The bifurcation will be lost if the contributions are comparable and simultaneous. Since we discuss two nearby pulse phases and a laterally extended emission region, such temporal separation of emission seems unlikely, which explains why the PA bifurca-tions are not observed.
Thus, to see the bifurcation, the flux which contributes to one PA peak has to be received in different pulses (or at least in different samples) than the flux which contributes to the other PA peak. The PA values in both peaks may therefore be affected by the instrumental noise of different sign or strength. This ad-ditionally increases the difficulty of detection of the PA bifur-cation, even when the conditions of the previous paragraph are fulfilled.
The detection may even be made more difficult by the si-multaneous emission in both polarisation modes. In this case we observe the instantaneous total PA determined by the degree
of their non-orthogonality (and by the relative amounts of both modes).
We then conclude that the clear bifurcation of the X-mode PA, such as illustrated in Fig. 5b, is not likely to be detected un-less several ‘purifying’ conditions are met. The main condition requires that the emission in each PA peak occurs in the above-described successive way, belonging either to the first or to the second PA peak. This is further complicated by the real-time in-strumental noise, and the possible contribution of the O mode. Our model is then consistent with the ubiquitous lack of the PA bifurcations in pulsar data.
4.7. Multiple PA bands in pulsars
The issue of simultaneous emission of both polarisation modes is related to the possibility of observation of several non-orthogonal PA stripes on the (φ, ψ) plane. This phenomenon is reported, for example, for B1237+25 observed at 327 MHz at the Arecibo Observatory (Smith et al. 2013). A distinct PA stripe, which looks like a wiggle which is not parallel to the PA stripe of the primary mode, is observed under the central component in the profile of this object. If the primary mode is assumed to fol-low the RVM, the distinct additional wiggle may be interpreted as the PA stripe corresponding to the simultaneous emission of both modes. The primary PA stripe would then represent the undisturbed PA of the primary mode emitted mostly alone.
In the simplest case there are three distinct situations in which only the primary or secondary mode is emitted, or both modes are emitted simultaneously. Then at least three PA stripes can be produced on the (φ, ψ) plane, one corresponding to the primary mode, another to the secondary mode (if it happens to be emitted alone ), and a third stripe for the simultaneous emission of both modes. The location of the last (non-RVM) stripe is de-termined by the intrinsic degree of non-orthogonality and the rel-ative flux in both modes. As shown in Melrose et al. (2006), for a well-defined (sharp) extra PA stripe, the radiation emitted si-multanously must be characterised by a preferred (frequently oc-curring) combination of these parameters. Otherwise the PA be-comes randomised (McKinnon and Stinebring 1998). Examples of such randomisation can sometimes be found in single-pulse PA data; see e.g. the profile of B1919+21 in Hankins & Rankin (2010) and . Thorough analysis of mode mixing effects is pre-sented in van Straten & Tiburzi (in preparation).
5. Discussion
To account for observed PA distortions, a CR-based model can be set up which assumes emission into a bifurcated beam of non-negligible angular extent and polarised at a fixed angle with re-spect to the local B-field. This elementary beam (a microbeam) is convolved with an emissivity profile which represents the lat-eral extent of the emission region, and it is supplemented with a contribution of the secondary polarisation mode.
A model of such a type is capable of qualitatively reproduc-ing the polarisation behaviour of several dissimilar features in the profiles of B1821−24A and J0437−4715. This provides ad-ditional support for the stream-shaped geometry of the pulsar emission region, and for the fan-shaped geometry of the pulsar beams (Michel 1987; DRD10; DR12; Wang et al. 2014; Dyks & Rudak 2015). It also shows that CR is a useful mechanism for interpreting the pulsar radio emission.
However, the model cannot reproduce the steepening of PA under emission components, nor the large drop in the polarisa-tion degree at the centre of notches in B1821−24. The notches
may be created by a single non-emitting plasma stream embed-ded in a laterally extenembed-ded emission region, or as a dense ob-scuring stream, located above the emission region (see fig. 12 in DRD10). If the bifurcation of the notches originates from the extraordinary-mode nature of the microbeam, then the non-emissive interpretation is favoured because the X-mode radia-tion does not interact with the plasma in the superstrong B-field; hence, it should not be absorbed or obscured. It is possible that the ‘dark’ stream is responsible for the giant pulses observed near the centre of the notches (Figs. 1 and 2 in BPDR). The stream may either be directly generating the giant pulse emis-sion, or it may be reprocessing the background radiation of the surrounding emitter, e.g. via scattering of the radio photons. In either case the new type of radiation may have different polari-sation properties from the surrounding background which could produce the extra depolarisation. It is important to note that such a contribution of extra emission at the centre of the dou-ble notches can mislead our modelling efforts since the height of the central maximum of double notches is the main factor which determines the width of the void in emissivity η⊥.
The model predicts that the intrinsic bifurcation of the PA distribution at a fixed phase is unlikely to be detectable, unless special conditions are satisfied. These include not only the nearly pure X-mode emission (mostly free from the noise and the O mode), but also a sequential (non-simultaneous) detection of flux from two nearby pulse longitudes (those which contribute each PA peak at a considered pulse phase). The proposed model is therefore consistent with the lack of the PA bifurcations in the pulsar data.
Generally, the model illustrates the key importance of the circum-RVM distribution of PA for the shape of the average PA curve. Since the spread of PA at a fixed phase is intrinsic, it is worth thinking in terms of a PA band or stripe instead of a PA curve. These fixed-phase PA distributions are unlikely to be sym-metrical around the RVM-based value, and any small deviations of one mode are amplified by the existence of the other polarisa-tion mode. This can lead to large PA deflecpolarisa-tions in the averaged profiles, and to the PA randomisation in single pulses.
This work suggests that in several pulsars the angular scale of the microbeam is not negligible in comparison to the angular gradients of emissivity in the emission region. Many observed distortions from the RVM may result from the microscopic PA becoming recognizable despite the convolution with the spatial extent of the emitter.
The data reproduction achieved through the by-eye fitting de-scribed in Sect. 4 is qualitative only, and the main reason for this are the guessed and simple forms of η⊥ and ηk. Instead, the observed polarised intensity profiles likely do not correspond to any simple analytical functions. For example, the notches in J0437−4715 seem to coincide with a broad emission bump su-perposed on a monotonically declining flux, whereas the BTC consists of η⊥ and ηk, which cannot be described by a simple exponential or linear function. A possible solution to this prob-lem would be to split the observed average profile into two fully polarised orthogonal modes, then deconvolve the microbeam from the mode-separated profiles to learn the approximate form of η⊥ and ηk. Another development that may be needed is a three-dimensional code capable of simulating an oblique tra-verse through the fan beams (hence including the apparent asym-metry of the microbeam). Moreover, the single-pulse population effects (Melrose et al. 2006) have already been shown to cru-cially affect the apparent polarisation. They seem to be the most important ingredient that may need to be included in the mod-elling to achieve close agreement with the data. Thus, the
ques-14 Dyks et al.: Model for polarisation distortions in radio pulsars
tion of whether complicated average PA curves (such as that of J0437−4715) can be disentangled into their pure RVM form, re-mains open.
Acknowledgements
JD thanks A. Bilous and S. Ransom for providing us with the profile of B1821−24A before publication. SO is supported by the Alexander von Humboldt Foundation. The Nanc¸ay Radio Observatory is operated by the Paris Observatory, associated with the French Centre National de la Recherche Scientifique (CNRS). This work was supported by the National Science Centre grant DEC-2011/02/A/ST9/00256.
References
Barnard, J. J. & Arons, J. 1986, ApJ, 302, 138
Beskin, V. S. & Philippov, A. A. 2012, MNRAS, 425, 814
Bilous, A. V., Pennucci, T. T., Demorest, P., & Ransom, S. M. 2015, ApJ, 803, 83 (BPDR)
Blaskiewicz, M., Cordes, J. M., & Wasserman, I. 1991, ApJ, 370, 643 Cheng, A. F. & Ruderman, M. A. 1979, ApJ, 229, 348 (CR79) Dai, S., Hobbs, G., Manchester, R. N., et al. 2015, MNRAS, 449, 3223 Dyks, J. 2008, MNRAS, 391, 859
Dyks, J. & Rudak, B. 2012, MNRAS, 420, 3403 (DR12) Dyks, J. & Rudak, B. 2015, MNRAS, 446, 2505
Dyks, J., Rudak, B., & Demorest, P. 2010, MNRAS, 401, 1781 (DRD10) Dyks, J., Rudak, B., & Rankin, J. M. 2007, A&A, 465, 981
Edwards, R. T. & Stappers, B. W. 2004, A&A, 421, 681
Edwards, R. T., Stappers, B. W., & van Leeuwen, A. G. J. 2003, A&A, 402, 321 Gil, J., Lyubarsky, Y., & Melikidze, G. I. 2004, ApJ, 600, 872
Hankins, T. H. & Rankin, J. M. 2010, AJ, 139, 168 Hibschman, J. A. & Arons, J. 2001, ApJ, 546, 382
Hobbs, G., Miller, D., Manchester, R. N., et al. 2011, PASA, 28, 202 Hotan, A. W., van Straten, W., & Manchester, R. N. 2004, PASA, 21, 302 Karastergiou, A. 2009, MNRAS, 392, L60
Komesaroff, M. M. 1970, Nat, 225, 612
Konopinski, E. J. 1981, Electromagnetic fields and relativistic particles (New York, McGraw-Hill)
Kumar, D. & Gangadhara, R. T. 2012, ApJ, 746, 157
Liu, K., Desvignes, G., Cognard, I., et al. 2014, MNRAS, 443, 3752 Luo, Q. 2004, MNRAS, 352, 1208
Lyubarsky, Y. 2008, in American Institute of Physics Conference Series, Vol. 983, 40 Years of Pulsars: Millisecond Pulsars, Magnetars and More, ed. C. Bassa, Z. Wang, A. Cumming, & V. M. Kaspi, 29–37
McKinnon, M. M. & Stinebring, D. R. 1998, ApJ, 502, 883 McLaughlin, M. A. & Rankin, J. M. 2004, MNRAS, 351, 808
Melrose, D. 2003, in Astronomical Society of the Pacific Conference Series, Vol. 302, Radio Pulsars, ed. M. Bailes, D. J. Nice, & S. E. Thorsett, 179 Melrose, D., Miller, A., Karastergiou, A., & Luo, Q. 2006, MNRAS, 365, 638 Michel, F. C. 1987, ApJ, 322, 822
Mitra, D. & Li, X. H. 2004, A&A, 421, 215
Navarro, J., Manchester, R. N., Sandhu, J. S., Kulkarni, S. R., & Bailes, M. 1997, ApJ, 486, 1019
Osłowski, S., van Straten, W., Bailes, M., Jameson, A., & Hobbs, G. 2014, MNRAS, 441, 3148
Petrova, S. A. & Lyubarskii, Y. E. 2000, A&A, 355, 1168 Radhakrishnan, V. & Cooke, D. J. 1969, Astrophys. Lett., 3, 225 Ramachandran, R. & Kramer, M. 2003, A&A, 407, 1085 Rankin, J. M. & Ramachandran, R. 2003, ApJ, 590, 411
Rankin, J. M. & Rathnasree, N. 1997, Journal of Astrophysics and Astronomy, 18, 91
Rybicki, G. B. & Lightman, A. P. 1979, Radiative processes in astrophysics (New York, Wiley-Interscience)
Smith, E., Rankin, J., & Mitra, D. 2013, MNRAS, 435, 1984
Stinebring, D. R., Cordes, J. M., Rankin, J. M., Weisberg, J. M., & Boriakoff, V. 1984, ApJS, 55, 247
Tinbergen, J. 2005, Astronomical Polarimetry (Cambridge, Cambridge University Press)
van Straten, W. 2004, ApJS, 152, 129 van Straten, W. 2009, ApJ, 694, 1413
Wang, C., Lai, D., & Han, J. 2010, MNRAS, 403, 569 Wang, H. G., Pi, F. P., Zheng, X. P., et al. 2014, ApJ, 789, 73 Wang, P. F., Wang, C., & Han, J. L. 2012, MNRAS, 423, 2464
Wang, P. F., Wang, C., & Han, J. L. 2015, MNRAS, 448, 771 Wright, G. A. E. 2004, MNRAS, 351, 813