PFC/JA-83-40
COUPLING THEORY FOR ICRF HEATING OF LARGE TOKAMAKS *
by
A. Ram and A. Bers
October 1983
*This work supported in part by D.O.E. Contract No.
COUPLING THEORY FOR ICRF HEATING OF LARGE TOKAMAKS
A. Ram and A. Bers Plasma Fusion Center
Massachusetts Institute of Technology Cambridge, MA 02139, U.S.A.
Abstract
An analytical and numerical study for the coupling of a current sheet antenna
to a tokamak plasma is presented. The antenna is of finite poloidal and toroidal dimensions and screened from the plasma by a sheath of anisotropic conductivity that shorts out just the toroidal component of the rf field. The excitation of only the fast component of the waves in the ion-cyclotron range of frequencies (ICRF) is considered. The plasma in the coupling region is described by its cold dielectric tensor with density and magnetic field inhomogeneities. The inclusion of the finite poloidal extent of the antenna introduces interesting behavior in the plasma impedance; the calculated radiation resistance is enhanced over that obtained by ignoring the poloidal variations. The coupling is better for gradual density gradients near the antenna, and the radiation resistance is dependent on the frequency of the antenna current. A set of appropriately phased poloidal antennas couple more power into the plasma than a single antenna of the same dimensions would. The power delivered into the plasma is reasonably well focussed. All this is illustrated with numerical results using parameters for a large tokamak.
I. INTRODUCTION
The successful heating of tokamak plasmas (PLT, TFR) [1,2] by injecting waves in the ion-cyclotron range of frequencies (ICRF) indicates that these means should be useful in the future larger tokamaks (e.g. TFTR and JET). The heating depends on the effective damping of the externally launched rf wave onto the various plasma constituents in the center of the plasma. The ICRF waves are excited in the plasma by an external antenna structure consisting of a rf current carrying conductor near the plasma wall in the shadow of the limiter. The "fast" component of the ICRF wave, which is suitable for the various efficient damping mechanisms to work, is effectively excited by shielding the conductor from the plasma by a metal screen which shorts out just the toroidal component of the rf electric field. The experiments have shown that the excited waves damp very strongly inside the plasma and no poloidal or toroidal eigenmodes are observed.
The first attempts [3] to theoretically formulate the coupling of the antenna structure to the plasma in the strong damping case were made in the slab geometry where the poloidal length of the antenna was taken to be infinite (the so called 2-dimensional model) while the toroidal length was finite. The current carrying conductor was assumed to be a current sheet with a fixed (uniform) current profile, and only the fast wave component of the ICRF was assumed to be excited in the plasma. The 2-D model was modified to a 3-D model [4] by including the finite poloidal extent of the current sheet. The effect of the feed lines from the external power source to the current sheet was ignored. The 3-D model was shown to lead to interesting features [5] which were not expected intuitively from the 2-D model. In particular, the calculated values of the radiation impedances of the antenna were changed significantly from those found from the 2-D model. Since then, there have been a number of theoretical studies [6-10] which have tried to remove various restrictions in the 3-D model mentioned above. In particular, the effects of including feeders [6,8,9] and of treating the antenna as a current carrying conductor [9] rather than a current sheet with fixed current profile have been discussed. These studies have directed their efforts to understanding and designing of antennas. In related work
[7,101
we have made an effort to study the plasma response when the externallylaunched electromagnetic waves are coupled to it. Then, this would be the guide to the design of antenna structures so as to take maximum advantage of the plasma properties. This paper is a continuation and conclusion of our previously, briefly reported work [7,10].
The model we treat is that relevant to a large tokamak plasma where the poloidal and toroidal dimensions of the antenna are small compared to the plasma minor radius. Further, since the coupling characteristics are determined by the plasma near the edge in front of the antenna, the coupling geometry is approximated
by the slab model. The plasma is described by its cold dielectric tensor with density
and magnetic field inhomogeneities in the direction corresponding to the radial direction. The equations describing the plasma include the spatial derivatives of the dielectric tensor elements. The plasma fields are solved for in a completely non-WKB fashion so that the effect of the spatial gradients can be explicitly studied. The coupling region of the plasma in front of the antenna does not include the damping of the input power onto any of the plasma species. So resonance layers like the ion-ion hybrid layer for two ion species plasmas or the ion cyclotron frequency resonance layers are assumed to be outside the coupling region of interest and deeper inside the plasma. The plasma parameters in the coupling region are chosen to be such that only the fast component of the ICRF wave is excited. This essentially requires that the edge density be large enough so that the lower-hybrid resonance does not occur in the coupling region. The coupling model is solved with the assumption of large damping of the ICRF wave inside the plasma so that no power is reflected back into the coupling region. The Faraday shield is modelled
by a sheet of anisotropic conductivity that shorts out the toroidal component of
the rf electric field but lets through the poloidal component unchanged. The screen also keeps the plasma away from the current sheet so that the region between the wall and the screen is assumed to be a vacuum. The current carrying conductor is modelled by a current sheet with a fixed current profile and the current flowing in the poloidal direction. The model is analytically set up to handle any arbitrary current profiles on the antenna. The feed lines to the current sheet are ignored.
the model described above; in section III the expressions for the radiation impedance of the antenna and the associated power coupled into the plasma are derived; section IV is devoted to the solutions of the fields inside the plasma. The effect of ignoring the feed lines to the current sheet is that the reactive radiation impedance becomes infinite due to the infinite charges required to maintain a uniform current along the sheet. A model to correct this problem is presented in section V. In section VI the analytical model is used for numerical calculations with parameters corresponding to a large JET-type tokamak. A discussion and explanation of the results is included herein.
II. GENERAL FORMULATION
The slab geometry model of the antenna-plasma structure is shown in figure 1. The current sheet at x = 0 is infinitesimally thin in z but has dimensions Ly and
L, meters in the y- and z-directions, respectively. The current density (complex amplitude) on the sheet is given by:
J = D Ko 6(z) F(y) G(z) e--t (1)
where Ko is the surface current density amplitude, F(y) and G(z) are the dimensionless profile factors of the current in the y- and the z- directions, respectively and w is the external source radian frequency. The screen of anisotropic conductivity at z = b shorts out only the z-component of the electric field. The
plasma region (x > b) near the screen is described by its cold dielectric tensor. The fields in the plasma,
E
,
R , are given by Maxwell's equations:P1 W2__
curl curl E = -- K (2)
curl
E'
= - o (3)at
where go (co) are the free-space permeability (permittivity), K is the cold plasma dielectric tensor, and we have assumed a time dependence of the form exp(-iwt) for the fields.
The plasma density and the externally applied toroidal (along z) magnetic field vary with x but are homogeneous and infinite in extent in y and z. Thus, the dielectric tensor elements are functions of x. (The density is assumed to be a monotonically increasing function of x in the coupling region.) The electric and magnetic fields in the vacuum and plasma region are Fourier transformed in y and z and taken to have a dependence of the form: exp(ikyy + ik~z - iwt). We are interested in the excitation of only the fast component of the ICRF wave; thus we shall assume that the density of the plasma at the screen (x = b) is large enough
that |K 1J > 0, and
1K
1 |> IK1,Kx for x > b in the coupling region. This will ensure that the slow and the fast modes are completely decoupled and that only the fast component is excited in the plasma. For this mode E'(x) = 0 for all x > b[Appendix A]. Defining ny = ky/ko, n, = k,/ko, = kox, and ko = w/c we find from equation (2):
-
dE'EP(e)= X KI -n2 -n2 ny E* +KxEP de (4)
and letting,
n2 + n2 - K1
E()= E() (5a)
we obtain the differential equation
d 2
+
(b)E()= 0. (5b)Here
P(= Po() + PI(e) (6a)
with,
K_ - n 2 _n 2 _ Kx(6b)
ny dKx K x dK1_ P1(M = n - K- + 2 1 d + (n2
+nz
-Kx ) dJ
n
62 d2 K+
- K_ )(n __ n_ - K_)d
2
K_
(6c) n 2n2 +4n2 - AKL) dK1 2 4 (n2 - K1 )2 (n2 + n2 - K1)2 depo(C) = 0 is the usual local dispersion relation for the fast wave while 1oI(e) is the
non-WKB contribution to p(C) due to the inhomogeneities in density and magnetic field. In a two-dimensional study of the coupling problem the finite extent of the antenna and its current variation in the poloidal direction are ignored by setting n. = 0. In this case pl(C) = 0 and only po(C) remains. As we shall show later, the
inclusion of pj(C) significantly changes the results from those that would be obtained
by a two-dimensional analysis. The fields in the vacuum region (EP
F'Iv)
containing the current sheet can again be obtained from Maxwell's equations (Appendix B). Then, upon imposing the following boundary conditions, the fields are uniquely determined everywhere:(a) at the conducting wall E'(x = -a) = E*(x = -a) = 0
(b) at the screen
Ev(x = b) = E (x = b) E'(x = b) = 0
H'(x = b) = HP(x = b)
(c) At the end of the coupling region, x = zO, inside the plasma, the fields satisfy the outgoing wave condition. This is the assumption of the single pass absorption when no waves are reflected from inside the plasma back to the coupling region. This condition leaves the solution to equation (5) undetermined to within an arbitrary multiplicative constant. This assumption of single pass absorption is more restrictive than is required for the present analysis. As long as the waves leaving the coupling region are not reflected from somewhere inside the plasma onto the current sheet itself, the analysis we do is applicable.
III. RADIATION IMPEDANCE AND POWER FLOW
The radiation impedance, ZA, of the antenna is obtained by applying the complex Poynting theorem at the surface of the antenna.
2PA
ZA = - RA+iX (7)
where I = Ko
f
G(z) dz is the current into the antenna andPA= dy dz E(x = 0, y,z) AII*(x =0, y, z) (8)
is the complex power flow out of the antenna. Here * indicates the complex conjugate and
AH,(x = 0, y, z) = H(x = 0+, y, z) - H,(x = 0~, y, z)
= -K 0 F(y) G(z) = -K(y, z)
By using Parseval's theorem, it can be easily shown that:
1
fo
COO 00PA = - _ dkff dkz Ey(x =0, ky, kz) K (ky, kz) (9)
where
Kf(ky, kz) =- Ko F(ky) G(kz) (10)
with Ey(x = 0, ky, kz), F(ky), G(kz) being the appropriate Fourier transforms of
Ey(x = 0, ky, k,), F(ky), G(k,) respectively. By satisfying the boundary conditions
discussed in the previous section, we get: Ey(x = 0, ky, kz) K(ky,k,) k k where kV - Y) sinh(aa) sinh(ab) (12) FIEo- a sinh{a(a + b)}
P sinh(aa) Z 2 1
k sinh{a(a + b)} (i/a) ( e6/po) tanh{a(a+ b)} (1 - n2) - yP(x = b)
(13)
with a2 = n2+n2-1, a = koa,
b
= k0b, ko = w/c and YP(x = b) (HPIEP),=being the plasma admittance at x = b. E-(x = b), H'(x = b) are obtained by
solving equations (5) and (3). The complex power flow can be re-expressed as:
1 J 2 00 0012 )1
PA = -- |K| 2 dky
J
dkz (ZP + iX ) J\(ky) 2 1G(kz)j2 2 (27r --o _w k= PP+ PA (14)
where PA corresponds to the integration over Z and PV to the integration over XV. The radiation impedance is then completely determined by equations (7,10-14). The first term on the right hand side of eq.(11) is purely imaginary and contributes to the reactive part of ZA. This term would give the radiation impedance of the antenna if the infinite screen at x = b were to be replaced by a purely conducting wall [or equivalently, E '(x = b) = 0]. Thus, it is related
to the electromagnetic energy stored between the conducting wall at x = -a and the screen. If we assume a uniform current along the y-direction, i.e. F(y) =
9(y
+ Ly/2) -O(y
- Ly/2), where 0 is the unit step function, then the contributionto ZA from X' is logarithmically divergent as k -+ oo. This is a consequence of the infinite charge required at antenna ends in y to maintain the assumed uniform current. This singularity can be removed if the current is allowed to go to zero at the antenna ends in y or if the feed lines leading to and from the current sheet are accounted for in the analysis. In ignoring the feed lines and assuming an infinite screen in y and z, we over-estimate the reactive part of the total radiation impedance. An analysis based on a model that avoids the singular charge at the antenna ends and leads to a better estimate of this term, and the energy stored in the vacuum region, is given later in this paper. The second term in equation
(11) is the contribution to ZA from the plasma and contains reactive and resistive
components. It depends on the values of the fields inside the plasma evaluated at the screen.
The time averaged power flowing into the plasma bulk is given by:
1 00 0
PJp = Re[- dyf dz E (x = xo, y, z) H (x = xo, y, z)] (15)
2 f-o00 J-00 Y
By using Parseval's theorem and equations (3,5a), we find:
1 1
ej
00 0 dky (c, ky, k)P, = 2 (2ir)2 _c dkf dk I ( , ky, k,) (16)
It is easy to show from equations (5,6) that since o( ) is a real function of (, Im (() (d5 (C)/dC) is a function independent of e. Thus, Ppz is the same no
matter where it is evaluated inside the coupling region. This should be obvious anyway since we have not included any damping or absorption mechanisms into our cold plasma model in the coupling region. From equation (7):
p, = RAP (17)
where RA can be evaluated from equation (9). The a-independence of
Im Z (() (dE5 ( )/dc) will serve as a check on the numerical schemes we use for
finding the plasma fields.
W. SOLUTION TO THE FIELDS INSIDE THE PLASMA
From equations (3-5a) we can express the plasma admittance, YP( ), in terms of (dP/de)/Z: Yp(e)=-i E 1 I O (n~ - K1 )1/2(n
+
n) - K1 )3/2 (n - K )(n+
nz - K1 )(
dY (18) fl~ ~ ~ 0e dKe~xn~nK) ny2 dK2+
2 de* nY KX (nY+
n. - KL)jThe solution to equations (5,6) together with the assumption of an outgoing wave at x = zo gives (1/E,5)(dE
/de).
We solve for p(e)
using two different density profiles :parabolic: n(x) = no - (no - ne)1 - (x - (19)
1r
Gaussian: n(x) = no exp -ngo{1 - (x b)}] (20)
and a magnetic field profile:
B0
B(x) = (21)
1
+(r
+b -x)/Rwhere no is the peak density at the center of the plasma (x = b + r), ne is the edge density at the screen (x = b), r is the minor radius of the plasma, R is the major
radius of the tokamak, ngo = log(no/ne) and Bo is the magnetic field at x = b + r.
pi() (equation (6)) contributes significantly to p( ) near the screen at the
edge of the plasma where the density is low. pi( ) becomes small compared to
Po(
)
as the density increases andIKiI
and Kx become large. At the end of the coupling region (x = xo) i(e) can be ignored relative to (po( ). Then equation(5b) becomes:
d2kp )
d 2 + po(e) Eo(Y) = 0 (22)
For the two density profiles we consider, po(e) is very well represented by a quadratic function:
PO(C) = -(a2 2 + al + ao) (23)
with a2 > 0 and ao, ai, a2 constants independent of x. Then the solution to eqn.
(23) is determined analytically: -P1
E
o( ) = ci [U( 1, 2) + ir(2 - 1) V( 1, e2)} (24)where 1 = {ao- a2/(4a2)}/(2Aai), 62 = (4a 2)1/4 {e+oe/(2a 2)}, cI is a constant,
U and V are the parabolic cylinder functions and r is the Gamma function [11]. So at x = xo we have:
= xo) = E(X =
Xo)
(25)To solve for (dE
/d )/Ek
numerically, we start off with the solution given by equation (24) at x = zO and integrate the differential equation (5b) backwards in x to x = b using a fourth order Runge-Kutta numerical scheme. The scheme ischecked to make sure that Im
[E(x)(dEP(x)/dx)
remains independent of x to a good numerical accuracy. Thus, we determine YP(x = b) from equation (18) whichis then substituted into eqn. (13) to determine the impedance. V. REACTIVE ANTENNA IMPEDANCE
The vacuum part of the total radiation impedance, Xi (equations 12, 13), is purely real and contributes to the reactive part of the impedance, ZA. As mentioned earlier, this term can be singular and leads to an over-stimation of Im(ZA). In experiments, the antenna has feed lines attached to one of its ends while the other end is short-circuited by connecting it to the conducting tokamak wall. The antenna is completely enclosed by a Faraday shield of finite extent in y and z. We model this structure by putting the current sheet in a box with one side (at x = -a) being a conducting wall and the other five sides to be the idealized anisotropic conducting shields. The y-dimension of the box is taken to be the length, L., of the antenna and the z-dimension to be D > L, (figure 2). This model is to be used just for evaluating Xi. For this purpose we replace the sides with anisotropic conducting shields by fully conducting walls. Clearly, this removes the singularity that would occur at the y-ends of the current sheet when requiring a uniform current in y as those ends are in contact with conductors. Thus, no infinite charges can build up at the antenna ends. Furthermore, in contrast to the model of figure 1, this model gives a better approximation to the energy stored in the vacuum region of an actual antenna. The model problem can be solved in terms of the free-space modes of a box. We find that the complex power flow from the current sheet for this model is (Appendix C):
y = 2i
ko|Ko
2 0 (4m27r2 sinh(7mna) sinh(ymnb) m-2 - 2EO LyD m,n=O L kg imn sinh{;mn(a + b)}
where: -2 4m2 r2 (2n
+
1)2lr2 2 'Ymn - k k = L2 YCD2 -k, k= and: km=f.L/2 12mgry Fm L/2 dyF(y) cos ~ D/2(2 )z Gn= dzG(z) cos (2n + 1)7rz fD/2 DThen, PBV from equation (26) replaces PV in equation (14). It can easily be shown that pBV is purely imaginary. So the contribution to the total reactive impedance from the vacuum region is given by:
2ipBV
XV = ~ 12 (27)
VI. NUMERICAL CALCULATIONS AND DISCUSSION OF RESULTS
In order to study the effects of the plasma density gradients and the finite poloidal variations of the current in the central conductor of the antenna structure, we apply the theory we have developed to a JET-type tokamak with the following parameters: major radius R = 300 cm; minor radius, r = 127 cm, toroidal
magnetic field, Bo = 35 kG, the distance between the antenna and the conducting
wall, a = 5 cm; the distance between the antenna and the screen, b = 3 cm;
antenna dimensions: LY = 60 cm, L, = 40 cm. The plasma is taken to consist of just deuterium ions and the frequency of the imposed current w is equal to twice the deuterium-ion cyclotron frequency at the center of the plasma where Bo = 35 kG, i.e. w = 3.35 X 10⁸ sec- 1. In our initial results we assume that the density at the screen is n. = 2 X 1011 cm- 3, and the peak density at the center of the
plasma is no = 5 X 1013 cm-3. The numerical solutions to the fields are obtained
by assuming the analytical solutions (equation (24)) at a distance of 30 cm from
the screen into the plasma and then integrating equation (56) to get the fields at the screen. The results we present are insensitive to any changes in this starting position of the integration scheme as long as the starting point is far enough inside
the plasma where the potential p(x) is not varying rapidly with the distance into the plasma.
For the above parameters we first look at just the plasma response by studying the behavior of Re(Z') from equation (13). This will give an indication of the range of toroidal and poloidal wave numbers that the plasma will allow to propagate in it. Then the antenna structures can be constructed to excite a current spectrum that would couple more power to these wave numbers leading to an efficient delivery of
the external power into the plasma. Figures 3a, b are the plots of Re(Z ) versus n for a fixed n = 0.9 and for parabolic and Gaussian density profiles, respectively.
Figure 4 is a plot of Re(Z ) versus n, for ny = 0 and for Gaussian density profile.
The graph is basically the same for the parabolic density profile. The essential features of these figures are maintained when Re(Z ) is plotted for different values of ny or n,. Several things become readily apparent from these graphs.
(1) The Re(Z ) is highly asymmetric with respect to n but symmetric around
n, = 0. The asymmetry in ny can be traced to the last term proportional to n. in equation (18) for the plasma admittance, YP. The asymmetry can be explained
by the "field displacement" effect that is observed for electromagnetic waves
propagating in anisotropic media [12]. The points in figures 3a,b where Re(ZP) is zero correspond to n2 + n2 = 1 and the vanishing of the y-component of the
electric field, EP = 0. The symmetry around n, = 0 is due to Re(Z ) being a
function of even powers of n,.
(2) The plasma allows a wider range of ny's than nz's to propagate in. In particular, reasonably large negative values of ny's couple efficiently into the plasma. The overall coupling is better for parabolic density profiles than for the Gaussian profile since the area under the curve for Re(Z ) is greater for the former case. However, for lower values of ny (-15
<
n,<
5) the Gaussian profile has bettercoupling characteristics than the parabolic profile as is evidenced by the values of
Re(Z'). This implies that for the single antenna with uniform current profile along the y and z-axes [so that F(ky) G(k,) = {4/(kykz)} sin(kyLy/2) sin(kzLz/2)] the resistive impedance of the antenna, Re(ZA), will be larger for a smaller density gradient (Gaussian profile) than for the steeper density gradient (parabolic profile).
This is shown in figures 5a,b where we have plotted the integrand of Re(PA) from equation (14) for n, = 0.9. The area under the curve for the parabolic profile
(figure 5a) is less than that for the Gaussian profile (figure 5b).
(3) The plasma allows a narrow range of n's to propagate into it (figure 4) with
efficient coupling of n,'s close to zero. This is in support of the assumption we had made in developing our theory that allowed us to impose EP = 0 everywhere inside the plasma. Had the plasma allowed in large values of n,'s (i.e. short wavelengths parallel to
Eo)
the condition, EP = 0, would have to be reconsidered.Finally, it is clear from these graphs that the inclusion of the plasma density gradient and the finite poloidal variation of the antenna current leads to very significant and important effects. The major contribution to the radiation impedance of the antenna comes from ny's which are different from zero.
The rest of the numerical calculations we present assume that the current profile of the antenna sheet is uniform, i.e. F(y) = 6
(y
+ L1y/2) - 0(y - Ly/2)and G(z) = O(z + Lz/2) - O(z - L,/2) where 0 indicates the unit step-function.
This assumption is valid as long as the frequencies, w, are below the vacuum resonance frequency, wR, of the antenna. For Ly = 60 cm, WR = 1.57 X 10⁹ sec 1. In figure 6 we plot the real part of the integrand from equation (4). The general features of this graph are retained if the density profile is changed to a Gaussian. The volume enclosed by this surface gives the resistive part of the radiation impedance of the antenna. For a parabolic density we obtain: (RA)p = 9.9 Ohms and for Gaussian density we have: (RA)G = 14.6 Ohms. (RA)G > (RA), as we had expected from our discussion above. It is interesting to compare these results with those that would be obtained if we make additional approximations. If the terms proportional to the spatial derivatives of the dielectric tensor elements in equations (6) are ignored, i.e. ep(e) = 0, corresponding results are: (RI)_ = 20.3
Ohms, (RI)G = 14.5 Ohms. If, further, ny is set to zero in equation (6b) then the resistive impedance we obtain will be per unit length of the antenna in y. The
values obtained are: (Rfd)p/Ly = 6.7 Ohms/meter, (RfI)G/Ly = 3.1 Ohms/meter for the two density profiles. For an antenna of length Ly = 60 cm in consideration
difference between the results obtained from the "exact" calculations, where the spatial derivatives of the dielectric tensor elements and the poloidal variation of the antenna are included, and the approximate values obtained by ignoring one or the other of these conditions.
The radiation impedance of the antenna is found to be a function of the frequency, w, of the antenna current. This feature has been observed experimentally on TFR. In figures 7a,b we plot RA versus w for the two density profiles with n. = 8 X 101 cm-3. The dashed lines on each graph are the results obtained from the 2-D theory with ny = 0 and Ly = 60 cm. The 2-D results give an approximately
linear variation of RA with w. This variation is independent of the current profile of the antenna since it is kept fixed. The increase in impedance is due to better coupling of the wave as the thickness of the cut-off layer corresponding to the various wave-numbers decreases. The apparent saturation of RA is achieved when the wave-numbers carrying all the power have no cut-off layer and are beginning to propagate from the screen onwards into the plasma. For a given edge density we cannot arbitrarily increase the frequency as the slow wave resonance (K1 = 0 layer) enters the plasma and our analysis breaks down. The frequency range we have examined is also below WR. For frequencies close to wR the current profile changes which in turn affects the antenna impedance
[9].
The dependence of the resistive impedance, RA, of the antenna on the edge and peak densities for a fixed w = 3.35 X 10⁸ sec- 1 is shown in Tables I and II. For the parabolic density profile there is not much variation in RA with changes in ne and no. The only trend that occurs is the decrease in RA for a fixed n, as no is
increased as well as fqr a fixed no as n, is increased. For the Gaussian density profile there is wider variation in the values of RA but with one difference. RA increases with increasing no for a fixed n, < 1012 cm- 3. The differences in Tables I and II seem to indicate that sharp gradients in density at the edge of the plasma (as in the case of the parabolic profile) do not lead to very good coupling of the external power into the plasma. Also, the coupling decreases with increasing edge densities. This is in sharp contradiction to results obtained from a 2-D analysis where the poloidal variations are ignored. In that case the radiation resistance increases as n,
increases. This is explained by the increase in the range of ni's that couple and propagate into the plasma. The thickness of the evanescent layer in the coupling region through which the higher values of n2's have to tunnel through before they propagate into the plasma decreases with increasing n,. In the 3-D analysis, even though the evanescent layer also decreases, the wave energy is now distributed in ny. We then find that the corresponding reflection of power from inside the plasma back onto the antenna increases, with the net effect that RA decreases with increasing n,.
The reactive part of the radiation impedance is a sum of the contribution from the plasma, corresponding to the imaginary part of the double integral in equation (14) for PP, and from the vacuum, XV, obtained in equation (27). The Im -(Z') does not exhibit the same richness with respect to ny as does the real part. The major contribution to Im(Z4) comes from the region around ny = 0. For n, = 2 X 101 1 m-3, n. = 5 X 1013 cm-3, and w = 3.35 X 10⁸ sec- 1, the
total reactive impedance for the two density profiles is (XA)p = -33.7 Ohms and
(XA)G = -45.0 Ohms. The minus sign simply indicates that the reactive impedance
is inductive. The vacuum part of the total reactive impedance is XV = -22.3
Ohms, and is calculated by assuming D = 45 cm, where D is the z-dimension of the box discussed in section V. In figure 8, -XA is plotted as a function of frequency for n, = 8 X 10" cm~3, no = 5 X 1013 cm- 3 and for parabolic density (solid line) and Gaussian density (dashed line) profiles. As observed for IA, -XA exhibits a similar frequency dependence. Even though the power coupled into the plasma is better for the Gaussian density profile than for the parabolic density profile there is more stored energy associated with the former case.
The spatial extent of the plasma to which the external power is being delivered to, is obtained from the y-component of the electric field, EP, and z-component of the magnetic field, HP, inside the plasma. In figure 9 we plot the Fourier spectrum of
|EP/Kol
for uniform antenna currents and parabolic density profile with ne = 2 X 1011 cm- 3 and no = 5 X 1013 cm- 3. The component EP is evaluated at x = 30 cm- xo. The structure is very close to the one observed for Re Z in figure 6. In figures 10a, b (11 a,b) the spatial variation of JE/KoJ
(JHP/Koj) isplotted versus y for z = 0 and versus z for y = 0, respectively, at x = xO. The
extent of the antenna is -0.3
<
y 0.3 and -0.2 < z < 0.2. The fields do notspread appreciably in the y-direction beyond the antenna dimensions. However, there is a significant dispersion of the fields in z beyond the antenna width. A simple way to understand this is to consider the simplified fast-wave dispersion relation:
K(2
nX = K - n _ z K 2 (29)
K - nz
obtained from equation (6b) by neglecting the terms proportional to the spatial derivatives of the dielectric tensor elements. For propagating waves the ratios of the components of the group velocity are:
Vgy nfl!1 -- -- - (30a) V9X any n. Vgz - - nz K( - --- = - I1+ 22(30b) ogX anz nx (KL - nz )
where vgx (Vgy, vgz) is the x (y, z) component of the group velocity. From equation
(30a) it is clear that the rays will coverge poloidally as they go into the plasma since nx increases rapidly with increasing density and n
>
n.. This partially justifies our approximation of assuming the plasma to be infinite in y. As long as the poloidal length of the antenna is small compared to the minor radius of the plasma the rays do not get poloidally reflected from the wall onto the antenna. The larger dispersion of the rays in the toroidal direction seen in figures 11 is due to the second term in equation (30b). For parameters in consideration, at x = xO,K n and K2</KI< 7 which gives VgZ/Vgy z 8nz/ny. For a single antenna
most of the propagating power is confined to -5 < n, < 5 and -10 < ny ! 5, so that v9z Z vgy. Also, it is clear that the fields are not going to disperse any
more than shown in figures 10 and 11 as nx becomes very large and v9y < Vgz and
Phased Arrays of Poloidal Antennas
The behavior of Re(Z ) shown in figures 3a,b suggests the use of poloidally phased antennas to take advantage of the efficient coupling of the large negative poloidal wave numbers. However, with a reasonable number of poloidal antennas, say four, it is very difficult to excite a current spectrum which reaches down into np's in the range from -15 to -30. Still the effect of phasing antennas such that their current spectrum peaks away from ny = 0 (the unphased case) leads to
significant enhancement of the power delivered into the plasma. We consider N poloidal antennas with the following current profile
S= ,Kob(x) [Ez + - Oz
[(y-(n-])LN)-O(y-nL)]e--Kz + 20 - Oz -'2Zn=1
(31)
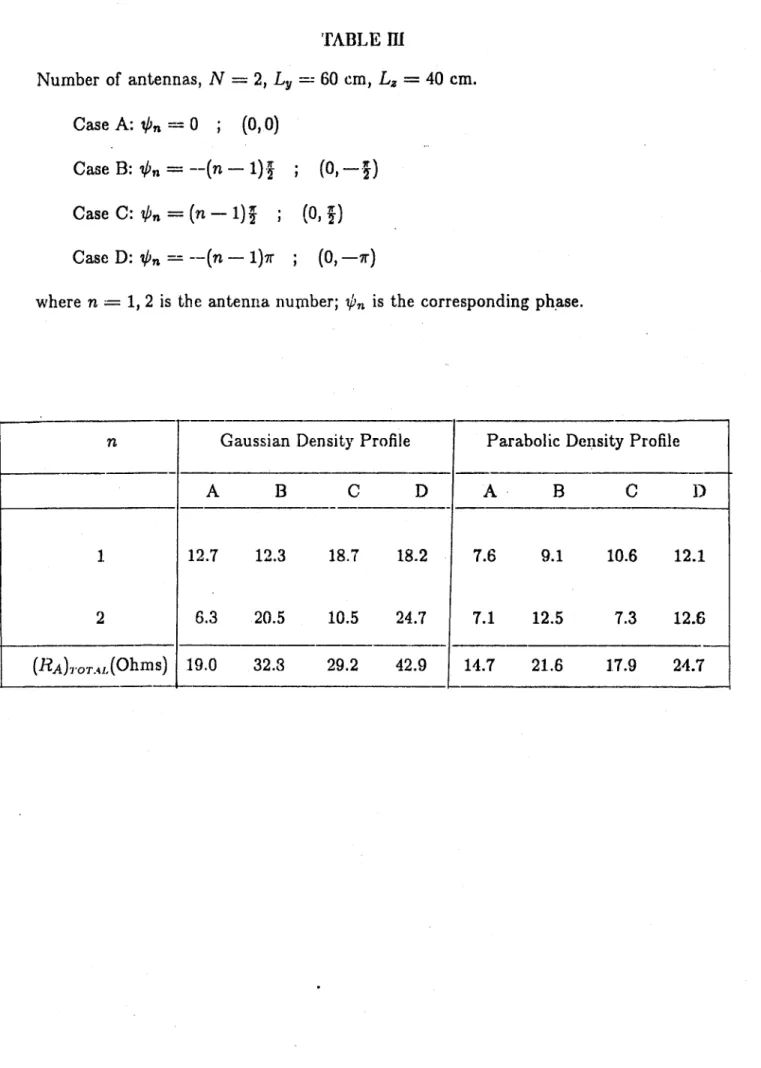
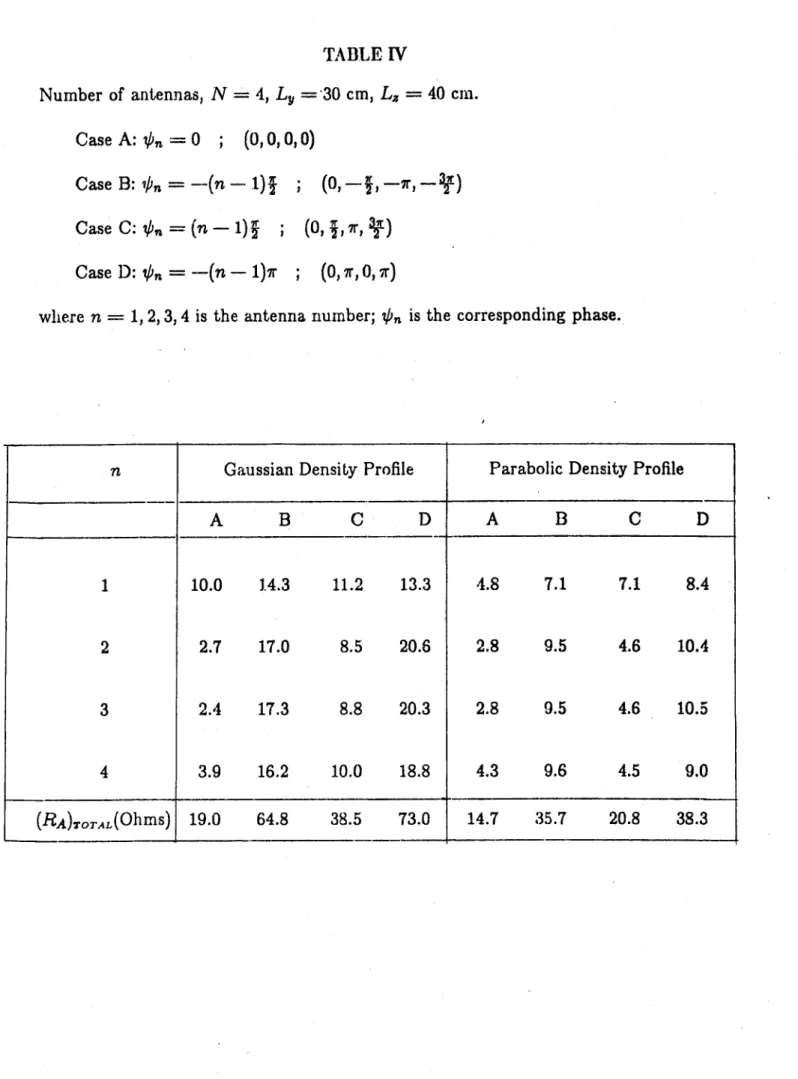
where N = 2 or 4 for the results we present and , is the phase of the n-th antenna. The current feeds in the antennas are assumed to be independent of each other. In Table III the results are given for N = 2, Ly = 60 cm, L. = 40
cm, the phases 0,, as indicated, ne = 2 X 1011 cm- 3, no = 5 X 1013 cm- 3, w = 3.35 X 10⁸ sec- 1 and the two density profiles. In Table IV the results are given for the same parameters as in Table III except that N = 4 and L, = 30 cm. The resistive impedance of each antenna is indicated spearately as is the total resistive impedance which is proportional to the power delivered into the plasma. Even though the antennas are not insulated from one another in our calculations, thus leading to a large cross-coupling between the antennas, the power delivered into the plasma is greater for the phased antennas than for the unphased case. The resistive impedance is greater for the Gaussian density profile than for the parabolic profile for the same reasona mentioned above for the single antenna. The peak in Re(Zp) for the parabolic profile is at too large a negative value of ny to be taken complete advantage of. The value of RA is larger for the case when
= -(n - 1)r, n = 1, 2.. .N, as this particular antenna phasing includes the
peaks in Re(Z') at positive ny seen in figures 3a,b and reaches into larger values of n.. These peaks at positive n. are also responsible for the large values of RA for the 0, = (n - 1) phasing.
VII. CONCLUSION
A detailed three-dimensional field analysis in slab geometry for the
antenna-plasma coupling theory has been discussed above. There are several features that become evident from this model used to study the excitation of the fast component of the ICRF wave in the plasma. The calculated radiation impedance, ZA, of a single antenna is significantly modified by including the finite poloidal length of the antenna. The plasma impedance is highly asymmetric in the poloidal wave numbers, ny, with good coupling occurring for large negative values of ny. This is the cause of the major deviations from the two-dimensional analysis where the poloidal length of the antenna is assumed to be infinite. ZA increases with increasing frequency (w) for a fixed density (n), density gradient (Vn) and electrical length of the antenna. So this variation is not caused by just allowing for the changes in the current profile (and, thus, the electrical length) due to changes in w [9]. The coupling is better for small Vn at the edge of the plasma as evidenced by the larger values of the resistive radiation impedance, RA, of the antenna for the Gaussian density profile. This is an advantage since the power delivered into the plasma interior,
Ppl, is proportional to RA. The excited fields inside the plasma,
A"
and ftp, do not disperse significantly beyond the antenna dimension so that the power going into the plasma is reasonably well focussed. The asymmetry with respect to ny of the plasma impedance suggests the use of poloidally phased antennas to couple effectively. This is found to be the case for antennas phased to launch a spectrum peaked in the Vn X b direction which deliver more power into the plasma than a single antenna with the same dimensions as the array. A phasing of 0, 7r, 0, 7r seems to be the optimum for four antennas.ACKNOWLEDGEMENTS
We are very grateful to Leo Harten for his collaboration in the early parts of this work and his valuable help with the programming aspects of this problem. We also acknowledge useful discussions with Drs. D. Blackfield, B. Blackwell, J. Jacquinot, B. McVey and K. Theilhaber.
This work was supported in part by D.O.E. Contract No. DE-AC02-78ET-51013 and in part by NSF Grant ECS 82-13430.
APPENDIX A
The electric field inside the plasma is given by:
2
curl curl
E*"
= w-K. k? (Al)where K is the cold-plasma dielectric tensor:
K L -iKx 0 K iKx K1 0 (A2) 0 0 KII with: 2 W2. KI =1- PC - 2 (A) _2--,2 i - wi _______ 2__+______2. Kx = ( 2 W (W2 2 (A4) w2, Kg = 1 -(A5)
the summation being over the ion species. wpe, wCE (wpi, wcj) are the electron (ion) plasma and cyclotron frequencies, respectively. For the special case of the homogeneous plasma the fields are assumed to have a dependence of the form exp(ik - F- iwt). Then, equation (Al) leads to the dispersion relation:
Kin-+{(KI + K1j)(n2 -K 1 )+2n K1
+K(
+
(n2 + n2 - K1 ){(n2 - K)K+
2 K}+ K2 2(n - KII) 0where ni = ki/ko, ko = w/c; i = x, y, z.
The two roots of nx from (A6) yield the two ICRF modes in the cold plasma:
n
= (Ki+KI -2n
-n )- 1(nKI
K2
2
1K [ - ) - 1 2+
2 1/2 (A7)The wave with the larger magnitude of the refractive index in eq. (A7) is termed the "slow wave" and that with the smaller refractive index is termed the "fast wave
In an inhomogeneous plasma (no(x), Bo(x)) KI, Kx, K11 are functions of x. If
the scale-length of the spatial variations of the inhomogeneities is long compared to the wavelength, 27r/kX, the fields may be assumed to have a WKB dependence of the form:
f-
1/2 exp[ik(x)x + ikyy+
ikz - iwt] with y2 = ki(x)+
k2+
ki. Then the local dispersion relation is the same as (A6) but with K1 , Kx, K11 beingfunctions of x.
The slow wave has a resonance at K1 = 0 for n2Kjj + K2
<
0 whereasthe fast wave has a resonance at K1 = 0 for njj
+
K<>
0. We assume thatthe w = wi resonance and the ion-ion hybrid layer (corresponding to the coupling of the slow wave and the fast wave in a two ion-species plasma) are not in the coupling region. The slow wave resonance occurring at low densities is eliminated
by assuming the edge density to be high enough such that 1K
II
> 0 inside thecoupling region. This also ensures that JKj
>
Kx, K±I within the coupling region leading to the following approximations to the two roots from (A7):slow wave: n, -I(K - n.) - ny (A8)
K 2
2 2 2 _ _ _
fast wave: n 1 =K - n. _n K 2 (A9)
Since within the coupling region K11, KI
<
0, the slow wave is. clearly evanescent.The two modes from (A8) and (A9) are very well separated in wave-number space, i.e. In,>I
>
Inf
1|.
From equation (Al), the electric field amplitudes are given by:ExP n,(n2 - K
1 ) - iKx ny (A10)
EP ny(n2 - K1 ) + inxKx
E _ (n.-K)(n 2-K 1 )-K, (All)
where n2 = n 2+n+n.
Upon substituting (A9) into (All) we find that the fast wave corresponds to having E (x) = 0 for all x > b, so that only the EP and EP components of the plasma fields are important for the fast wave.
APPENDIX B
In the vacuum region, -a < x < b, the fields are given by Maxwell's equations:
aIV'
curl =
A
O
at
(B1)curl I =
1+
eo (B2)Assuming a dependence of the form exp(ikyy + ikzz - iwt) for the vacuum fields
and J given by eq. (1), equations (Bl) and (B2) lead to the following:
/?2 K
E'(x) = (H+e "x + H-ey) + k sgn(x)(-YIi
+
,elx) (B3)WCO 4wEO
-iyky
E'(x) = (H+e-,z + H-Ox)
+
kz(E+e-,x + E-e'")Y WC 2
+ EO4, 2- k )(e~7Ylx - 'Ylxl) (B4)
E (x ) = -i-kz (H+e 7Y - H e'y ) + k,(E+e-7' + Ee?")
- i K kykz(e~YlxI - elzI) (B5)
wEO 4-y
where #2 = k2 + k2, y2 2 _ w2/c2, sgn(z) = +
:
>Y z
-1
,X <
0*H±, E± are constants that are determined from the boundary conditions. k =
KoF(ky)G(kz), F(ky), G(k2) are the Fourier transforms of F(y), G(z), respectively.
The magnetic field,
ftv(x),
is then given by equation (Bi).APPENDIX C
The vacuum contribution to the total reactive impedance is found by solving Maxwell's equations for the current sheet in a fully conducting box (figure 2):
curlk =-po
aft
(Cl)ak
curIlf = ak +J
(C2)at
with =Kob(x)F(y)G(z) (C3)and subject to the boundary conditions:
Ev, E.,H = 0 at x = -a and x = b
Ex,E z,Hy=O at y= 2 and y- 2Y (C4)
D D
ExEy,Hz=O at y = D and i =
Assuming the time dependence of the fields to be of the form exp(-iwt), equation
(Cl) and (C2) combine to give:
curl curl = ko E +
J
(C5)where ko = w/c. The solution to equation (C5) is obtained by the method of separation of variables in the rectangular coordinate system. By applying the boundary conditions (C4) we find:
00 k
Ex = km Ktmn cos{ke(x
+
a)} sin(kmy) cos(knz) (C6),m,n=O kja2mn
0 (k2 _ k2)
E M Ktmn sin{kI(x
+
a)} cos(kmy) cos(knz) (C7)tm,n=o kO Imn
00 k m
kn-Ez = km" Kimn sin {kt(x
+
a)} sin(kmy) sin(knz) (C8) I,m,n=o k~Q jmn2 217r 2mir 7r
Kiman = -in 8aiKym
(a + b)LD si(kta)KOFmGn
with Fm, Gn as defined in section V. The complex power flow from the current
sheet is:
- Ly/2
PA = - L /
D/2
dy ID/2 dzEy(x = 0, y, z)K*(y, z)
=
ipo koIKo|
2 (km2 - k0)sin
2(kja)|k|mI
2I(n1
2Eo
(a +
b)DLy kamnUpon performing the sum over
e
[13] we get the result of equation (26).TABLE I
The resistive impedances (in Ohms) as a function of the edge and peak densities for a parabolic density profile, uniform current profile and w = 3.35 X 10⁸ sec- 1.
_ * cm 3 5 X 10¹³ 8 X 10¹³ 1 X 10¹⁴ ne cm 3 2 X 101 9.9 8.6 8.1 5 X 10" 9.9 8.3 7.8 8 X 10" 9.2 8.2 7.7 1 X 10¹² 9.1 8.1 7.7
TABLE 11
The resistive impedances (in Ohms) as a function of the edge and peak densities for Gaussian density profile, uniform current profile and w = 3.35 X 10⁸ sec- 1.
_3 n cm 5 x 10l 8 X 10¹³ 1 X 101 ne cm 3 2 X 10¹¹ 14.6 15.4 17.2 5 X 10l 10.8 11.0 11.9 8 X 101 10.2 10.5 10.7 1 X 10¹² 10.2 10.2 10.2
TABLE HI Number of antennas, N = 2, LY = 60 cm, L, = 40 cm. Case A: 0 = 0 ; (0, 0) Case B: 0b, = -(n - 1) ; (0,-I) Case C: = (n - 1)I ; (0,j) Case D:
4,
= -(n - 1)7r ; (0, -7r)where n = 1, 2 is the antenna nurnber; 0, is the corresponding phase.
n Gaussian Density Profile Parabolic Density Profile
A B C D A B C 1)
1 12.7 12.3 18.7 18.2 7.6 9.1 10.6 12.1
2 6.3 20.5 10.5 24.7 7.1 12.5 7.3 12.6
TABLE IV Number of antennas, N = 4, Ly ='30 cm, L. = 40 cm. Case A: 0, = 0 ; (0,0, 0,0) Case B: k,, = -(n - 1)1 ; (0, -K, -7r, -Case C: 0,,, = (n - 1){ ; (0, j, 7r, 3) Case D: i, = -(n - 1)7r ; (0, 7r, 0, -r)
where n = 1, 2, 3, 4 is the antenna number; 0, is the corresponding phase.
n Gaussian Density Profile Parabolic Density Profile
A B C D A B C D 1 10.0 1.4.3 11.2 13.3 4.8 7.1 7.1 8.4 2 2.7 17.0 8.5 20.6 2.8 9.5 4.6 10.4 3 2.4 17.3 8.8 20.3 2.8 9.5 4.6 10.5 4 3.9 16.2 10.0 18.8 4.3 9.6 4.5 9.0 (RA),,OTA(Ohms) 19.0 64.8 38.5 73.0 14.7 35.7 20.8 38.3
REFERENCES
1. J. Hosea et al., Proceedings of the 3rd Joint Varenna-Grenoble International
Symposium on Heating in Toroidal Plasmas, Grenoble, France, p. 213
(1982).
2. Equipe TFR, Proceedings of the 3rd Joint Varenna-Grenoble International Symposium on Heating in Toroidal Plasmas, Grenoble, France, p. 225
(1982).
3. J. Adam, Association Euratom-C.E.A. report EUR-CEA-FC-1004 (May 1979).
4. A. Bers, J. Jacquinot, G. Lister, Proceedings of the 2nd Joint
Varenna-Grenoble International Symposium on Heating in Toroidal Plasmas, Como, Italy, p. 569 (1980); and Association Euratom-C.E.A. report
EUR-CEA-FC-1066 (September 1980).
5. A. Bers, L. Harten, A. Ram, Proceedings of the Fourth Topical Conference
on Radio Frequency Plasma Heating, Texas, p. A16-,1 (1981); and M.I.T. Plasma Fusion Center Report PFC/RR-81-7 (1981) (with corrections).
6. V. P. Bhatnagar, R. Koch, A. Messiaen, R. Weynants, Nuclear Fusion,
22, 280 (1982).
7. A. Ram, A. Bers, Proceedings of the 3rd Joint Varenna-Grenoble
International Symposium on Heating in Toroidal Plasmas, Grenoble, France, p. 395 (1982).
8. A. M. Messiaen et al., Proceedings of the 3rd Joint Varenna-Grenoble
International Symposium on Heating in Toroidal Plasmas, Grenoble, France, p. 243 (1982).
9. K. Theilhaber, J. Jacquinot, Association Euratom-C.E.A. report EUR-CEA-FC-1166 (November 1982).
10. A. Ram, A. Bers, to appear in the Proceedings of the Fifth Topical
Conference on Radio Frequency Plasma Heating, Wisconsin (1983); and M.I.T. Plasma Fusion Center Report PFC/CP-83-1 (1983).
11. Handbook of Mathematical Functions, ed. M. Abramowitz and I. A.
Stegun, National Bureau of Standards, U.S.A. (1972).
12. The field displacement effect in anisotropic media was first discussed in relation to modes in waveguides containing ferrites; see B. Lax and K.
J. Button, Microwave Ferrites and Ferrimagnetics, McGraw Hill Book
Co., Inc., New York, 1962, p. 355. In plasma waveguides it is discussed in W. P. Allis, S. J. Buchsbaum, A. Bers, Waves in Anisotropic Plasmas, M.I.T. Press, Cambridge, Mass., U.S.A., (1963) p. 230.
In our calculations we find that if we change the direction of propagation of the waves in the plasma at x = xo from an outgoing wave to that of an incoming wave, the spatial variations of the fields also changes. The new fields can be obtained from the ones corresponding to the outgoing
waves in figure 10a,b by reflection around the y = 0 axis. This corresponds
exactly to the field displacement effect.
13. I. S. Gradshteyn, I. M. Ryzhik, Table of Integrals, Series, and Products,
FIGURE CAPTIONS Figure 1 The slab geometry model used in the analysis.
Figure 2 The box model used to evaluate the contribution to the imaginary part of the impedance from the vacuum region. All walls of the box are taken to be pure conductors (0 = oo).
The parameters used in the following graphs are the same except in those cases where explicitly indicated otherwise:
a = 5 cm, b = 3 cm, D = 45 cm, L, = 60 cm, L. = 40 cm; a pure deuterium plasma with major radius, R = 300 cm; minor radius, r = 127 cm; toroidal
magnetic field at the center of the plasma, BT = 35 kG; the frequency of the rf
current, w = 2wCD = 3.35 X 10⁸ sec- 1; edge density of the plasma, n, = 2 X 1011 cm-3; peak density, no = 5 X 10l cm-3,
Figure 3 (a) Real (Z') versus ny for n, = 0.9 for the parabolic density profile. (b) Real
(Z)
versus ny for n, = 0.9 for the Gaussian density profile.Figure 4 Re(Zg) versus n for ny = 0.0 for the Gaussian density profile.
Figure 5 Using uniform current on the antenna, i.e.
F(y) = 0(y + Ly/2) - 0(y - Ly/2)
G(z) =
8(z
+
L,/2) - O(z - L,/2)(a) Real Z'(F(ny)G(nz))2], which is proportional to the real part of the integrand of PA in equation (14), versus ny for n, = 0.9 for the parabolic
density profile. F(d) is the Fourier transforms of F(G).
(b) Same as (a) but for Guassian density profile.
Figure 6 Real Z'(F(ny)(nz))2 versus ny and n, for uniform current profile and parabolic density profile.
Figure 7 For n, = 8 X 1011 cm-3:
(a) Total resistive radiation impedance of the antenna, RA, versus frequency,
w, for tlhe parabolic density profile. The solid line is the case when we use the
when ny = 0.
(b) Same as (a) except for Gaussian density profile.
Figure 8 For ne = 8 X 101 cm- 3, the total reactive radiation impedance of the antenna,
-XA, including the vacuum contribution from equation (2b), for the parabolic (solid line) and Gaussian (dashed line) density profiles.
Figure 9 The amplitude of the Fourier transformed y-component of the plasma electric field per unit antenna current, IEg(nY, nz)F(ny)G(n,)/K for uniform current
profile on the antenna, versus ny and nz.
Figure 10 (a) The amplitude of the y-component of the plasma electric field per unit antenna current, jEy/Ko| volt-meter/ampere at x = xO = 30 cm and z = 0
cm versus y for uniform current profile and parabolic density profile.
(b) The amplitude of the z-component of the plasma magnetic field per unit
antenna current, 1Hz/Ko.1/meter at x = xo = 30 cm, and z = 0 cm versus y
for uniform current profile and parabolic density profile.
Figure 11 (a) IEy/Kol volt-meter/ampere at x = xo = 30 cm and y = 0 cm versus z for uniform current profile and parabolic density profile.
(b)JH,/Kol/meter at x = xO = 30 cm, and y = 0 cm versus z for uniform
0 0 So tr-M 4 -~ N \ 0 x H w --- --- - - - - %
-.1%
4 .. A %% OCLK N 0 * mm m m m U m m m m m m m a ____ -J -J C." a, '.4 -'-I rLI
Vi?
m I 40
- ty)-
%J
0
0 Cj0 0
0
o
C~j
OI
Z
3
I0
0
00
0 0 0 0 0 (0 N OD wZ
V 3
OD
cm
I I I I I III I I N
0
II
co
C;
I I6
0
6
I
I
I N0
0
N0
0
(i Ut) 00 rX40
0
0
0'
- I
(5
0
0
N aI0
0 0 N0
0
0 Lfl 01, 0 N0
'
Zu)D
I
II
iu )
j ) ciz
x
-IV3M
Pfto
I
Ci 0 0-_ c'J 2k: %..Oo NN wC
14-12
-
-10-<)
j-
4-w (sec-1)
Figure 7a16
4
12
lo-04
/
0
/
sc1
Figure 7b60
r-50
-40
-
30-20
-
10-0
0
I
2
3
4
5
6
x
10
8 --w
(sec-1) Figure 8N C N C 0 LUJ
0
0
C'4j C0
6
0
ci) I0
\
a
0-- CU
rTz4
9s
N 4-E
--
-o
NN I 'I I I I I I (0N-O N
9t
NN