Publisher’s version / Version de l'éditeur:
Proceedings 15th International Conference on Port and Ocean Engineering under Arctic Conditions, POAC'99, 1, pp. 444-453, 1999-08-23
READ THESE TERMS AND CONDITIONS CAREFULLY BEFORE USING THIS WEBSITE.
https://nrc-publications.canada.ca/eng/copyright
Vous avez des questions? Nous pouvons vous aider. Pour communiquer directement avec un auteur, consultez la première page de la revue dans laquelle son article a été publié afin de trouver ses coordonnées. Si vous n’arrivez pas à les repérer, communiquez avec nous à [email protected].
Questions? Contact the NRC Publications Archive team at
[email protected]. If you wish to email the authors directly, please see the first page of the publication for their contact information.
NRC Publications Archive
Archives des publications du CNRC
This publication could be one of several versions: author’s original, accepted manuscript or the publisher’s version. / La version de cette publication peut être l’une des suivantes : la version prépublication de l’auteur, la version acceptée du manuscrit ou la version de l’éditeur.
Access and use of this website and the material on it are subject to the Terms and Conditions set forth at The NRC Ice Load Catalogue
Timco, G.W.; Johnston, M.; Frederking, R.
https://publications-cnrc.canada.ca/fra/droits
L’accès à ce site Web et l’utilisation de son contenu sont assujettis aux conditions présentées dans le site LISEZ CES CONDITIONS ATTENTIVEMENT AVANT D’UTILISER CE SITE WEB.
NRC Publications Record / Notice d'Archives des publications de CNRC:
https://nrc-publications.canada.ca/eng/view/object/?id=e867c8a2-94c2-4146-af6a-40942d163809 https://publications-cnrc.canada.ca/fra/voir/objet/?id=e867c8a2-94c2-4146-af6a-40942d163809
Proceedings 15th International Conference on Port and Ocean Engineering under Arctic Conditions, POAC’99, Vol. I, pp 444-453, Helsinki, Finland, August 23-27, 1999.
POAC 99
THE NRC ICE LOAD CATALOGUE
G.W. Timco, M. Johnston and R. Frederking Canadian Hydraulics Centre
National Research Council Ottawa, Ont. K1A 0R6 Canada
ABSTRACT
The National Research Council of Canada in Ottawa has developed an “Ice Load Catalogue”. This catalogue contains over 300 Events of ice loading on offshore and coastal structures. The catalogue contains information on the time-based behavior of the load as well as details of the ice conditions during each loading event. There is a complete range of structures that are included in the Catalogue including bridge piers, light piers, wharves, dams, offshore structures and natural islands.
This paper presents an overview of the Catalogue. Each structure-type is described along with the instrumentation used to measure loads. A summary of available information is provided along with the load levels observed on the different types of structures.
1. INTRODUCTION
Ice can be the most important design concern for offshore and coastal structures in several parts of the world. Although structures have been placed successfully in a number of ice-infested waters, the general consensus is that the structures are over-designed for ice loads. Moreover, there is a great deal of controversy on the global load that ice can exert on a structure (Sanderson, 1989; Croasdale, 1996). The main reason for this is the lack-of-knowledge of the actual loads that different types of ice features can exert on the structure. To better define these loads, a number of structures have been instrumented to measure the ice loads, and information in this area is available. However, the information on the ice loads is contained in a large number of documents, many of which are very difficult to obtain.
The National Research Council of Canada (NRC) in Ottawa developed a Joint Industry Project (JIP) to develop a better understanding of ice loads on offshore structures. The first step in doing this was to compile all of the available information on ice loads on structures in a logical, consistent format. The following companies joined the JIP: Exxon Production Research, Conoco Inc., Marathon Oil, Japan National Oil Corporation, NKK Corporation, Amoco Corporation and the Canadian Program on Energy Research and Development. This JIP led to the development of the “NRC Ice Load Catalogue”.
This paper describes the general philosophy of the Catalogue and presents an overview of the types of structures that have been instrumented, and the types of instrumentation that have been used to measure ice loads. The reported loads are summarized for each type of structure.
2. FORMAT FOR THE ICE LOAD CATALOGUE
At the start of this project, it was important to identify the key information that was required to fully quantify and describe an ice-loading Event. Based on the authors’ experience, over 50 important parameters were identified to quantify and catalogue an ice loading event. These parameters included basic information such as the structure name and location, date of the event, etc. In addition, important information on the characteristics of the structure were also collected (structure width and shape, instrumentation, etc.). Information on the ice conditions during an Event was also characterized by a number of different parameters (thickness, speed, morphology, ice type, ice age, etc). Finally, it was considered to be extremely important to get information on the time-series behavior of ice loads. Consequently, only information that contained time-series records were collected and included in the Ice Load Catalogue. All available data sources were explored and only high quality data were retrieved. The important information about the ice load events was extracted from the published sources. For all Events, a critical evaluation was given of the loading Event and the assumptions used in determining the ice loads.
3. SOURCES OF INFORMATION
There were a number of different data sources that were used to obtain information on ice loads including:
• Information that the NRC, through its “Centre for Ice Loads on Offshore Structures” has collected on ice loads on offshore structures in the Beaufort Sea (Timco 1996,1998). These include information on the Molikpaq, Tarsiut, SSDC and the Caisson Retained Island (CRI);
• Information that the NRC has measured on structures such as Nanisivik Wharf, Adams Island and several bridge piers and light piers;
• Information presented in published papers and reports;
• Information obtained by contacting persons responsible for ice load measurements on structures in which information has either not been published, or was incomplete in reporting;
• Information obtained from the members of the JIP (e.g. information on the CIDS, Cook Inlet platform, etc.);
• Information obtained through an exchange agreement with the European LOLEIF initiative (Schwarz 1998).
In total, 33 different structures were investigated, and useful information was obtained on 16 of these structures. In the other cases, the information was either proprietary or not of sufficient quality or detail to use in the Catalogue as specific Events. In these cases, only general information on the ice loads is provided in the Catalogue.
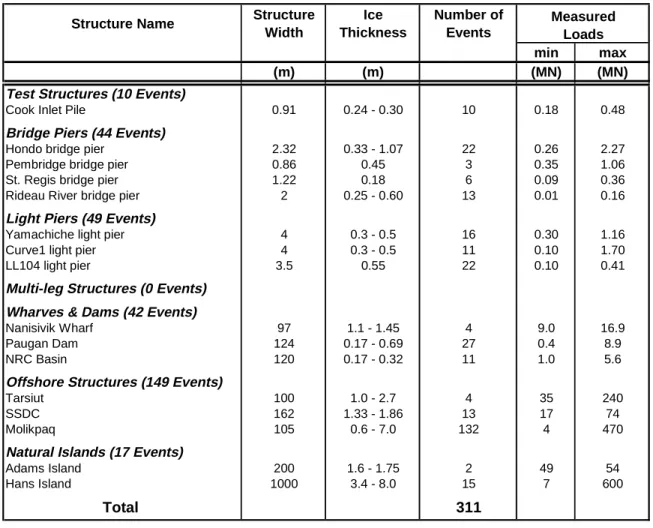
Table 1 Suumary of Events in the NRC Ice Load Catalogue.
Structure Name Structure Width Ice Thickness Number of Events min max (m) (m) (MN) (MN)
Test Structures (10 Events)
Cook Inlet Pile 0.91 0.24 - 0.30 10 0.18 0.48
Bridge Piers (44 Events)
Hondo bridge pier 2.32 0.33 - 1.07 22 0.26 2.27
Pembridge bridge pier 0.86 0.45 3 0.35 1.06
St. Regis bridge pier 1.22 0.18 6 0.09 0.36
Rideau River bridge pier 2 0.25 - 0.60 13 0.01 0.16
Light Piers (49 Events)
Yamachiche light pier 4 0.3 - 0.5 16 0.30 1.16
Curve1 light pier 4 0.3 - 0.5 11 0.10 1.70
LL104 light pier 3.5 0.55 22 0.10 0.41
Multi-leg Structures (0 Events) Wharves & Dams (42 Events)
Nanisivik Wharf 97 1.1 - 1.45 4 9.0 16.9
Paugan Dam 124 0.17 - 0.69 27 0.4 8.9
NRC Basin 120 0.17 - 0.32 11 1.0 5.6
Offshore Structures (149 Events)
Tarsiut 100 1.0 - 2.7 4 35 240
SSDC 162 1.33 - 1.86 13 17 74
Molikpaq 105 0.6 - 7.0 132 4 470
Natural Islands (17 Events)
Adams Island 200 1.6 - 1.75 2 49 54
Hans Island 1000 3.4 - 8.0 15 7 600
Total 311
Measured Loads
4. STRUCTURES AND LOADS
The information that was collected was organized according the type of structure, as outlined in Table 1. Each structure type and the available information is discussed in this section.
4.1 Test Structures
Two test structures that were instrumented to measure ice loads under field conditions were examined. The first structure was an instrumented platform that was placed in Cook Inlet in Alaska, USA during the 1960s. Ten ice-loading Events were obtained from an instrumented pile that was impacted by moving pack ice. The pile was 0.91 m in diameter and it was subjected to the impact of floating ice 0.24 to 0.3 m thick. Reported loads ranged from 0.18 to 0.48 MN (Blenkarn, 1970; Peyton, 1966). The second structure, a gravel-filled 90 m diameter sheet-pile structure that was constructed in the Nevelskogo Strait west of Sakhalin Island in Russia was also examined. However, there were no Events included in the Ice Load Catalogue from this structure, since there were no time-series records of the ice loads.
4.2 Bridge Piers
There have been a number of ice load measurements made on bridge piers in both Canada and the United States. In most cases, a single pier was instrumented to measure the loads of impacting ice floes during the spring break-up season. The instrumentation was often very simple, usually consisting of a hinged panel with a single load cell. Forty-nine Events were identified for bridge piers including: 22 Events for the Hondo Bridge Pier in Alberta (Lipsett and Gerard, 1980); 3 Events at the Pembridge Bridge Pier in Alberta (Lipsett and Gerard, 1980); 6 Events for the St. Regis River Pier in New York State (Haynes et al., 1991); and 13 Events from the Rideau River in Ontario (Frederking and Sayed, 1989, 1992). The diameter of these bridge piers ranged from 0.86 to 2.3 m. The thickness of the ice during the interactions ranged from 0.18 to 1.1 m. Measured loads ranged from 0.01 to 2.3 MN. Other piers were also examined (Yukon River, Ottauquechee River, White River, Confederation Bridge and Eider Estuary) but individual loading Events could not be determined for these structures. Usually this was a result of the lack of detailed information on the ice characteristics.
4.3 Light Piers
A number of light piers and navigation channel markers have been instrumented in several countries including Canada, Finland and Sweden. The instrumentation has either been load panels or accelerometers. Remote-triggered data loggers have been used to collect data throughout the winter months. Often there are video cameras installed, but these provided only limited information on the ice conditions. Thus, there is usually some uncertainty on the specific ice conditions that caused a specific Event on a light pier. Nevertheless, useful information on ice loads has been obtained from these types of structures. Individual loading Events were determined for a number of light piers in the St. Lawrence Seaway in Canada. Sixteen Events were identified for the Yamachiche light pier (Frederking and Sayed, 1989), eleven Events were identified for the Curve1 light pier (Frederking and Sayed, 1990) and twenty-two Events were obtained from the LL104 light pier (Egan, 1993). The diameter of these light piers ranged from 3.5 to 4 m. The thickness of the ice ranged from 0.3 to 0.55 m, with measured loads that ranged from 0.1 to 1.7 MN. Other light piers were investigated including the X-47 and X-35 light piers in Canada, the Kemi-1 and Bothnia channel markers in Finland and the Nordstromsgrund light pier in Sweden. Event data was not available for these light piers either due to lack of information on the ice conditions, or confidentiality of the data.
4.4 Multi-leg Structures
There have been a few measurements of ice loads on multi-leg offshore structures. Platforms in Cook Inlet, Alaska and the JZ-20 platform in Bohai Bay, China have had ice load measurement programs. Unfortunately, it was not possible to acquire load-time records from these test programs; therefore no Events related to multi-leg structures are included in the Ice Load Catalogue. Reported measurements of ice loads on the 2 m diameter leg of the JZ-20 platform gave loads of 0.5 MN with 0.5 m ice thickness (Wessels and Jochmann, 1990).
4.5 Wharves and Dams
A number of wide structures have been instrumented to determine the ice loads, mostly due to a thermal origin. One Arctic wharf at Nanisivik on Baffin Island was instrumented by the National Research Council of Canada in mid 1980s (Frederking and Sayed, 1988). A number of hydroelectric dams have been instrumented in Canada (Comfort et al., 1993, 1994). A joint project by Fleet Technology and the NRC was carried out to investigate thermally-induced loads in a large outdoor basin at the NRC in Ottawa (Comfort et al., 1983). In all cases, the structures were quite wide, on the order of 75 to 100 m, and surrounded by landfast ice. Usually BP-type sensors and Hexpack sensors were embedded into the ice, at various depths, in front of the structure. Loading times for these Events were on the order of several hours to several days. In total, 42 Events have been extracted on these wide structures (see Table 1). The width of these structures ranged from 97 to 124 m. Measured loads ranged from 0.4 to 16.9 MN, due to ice with a thickness that ranged from 0.17 to 1.45 m
4.6 Wide Offshore Structures
There were a number of different types of structures used in the 1970s and 1980s in exploratory drilling in the Canadian and American Beaufort Sea. The paper by Masterson et al (1991) provides an excellent overview of this development. The structures used in this Arctic region included artificial gravel islands, floating drilling ships, conical-shaped floating platforms, as well as caisson-retained islands. The most detailed information on ice loads related to the caisson structures. For these structures, large Medof panels were used to measure ice loads. The NRC in Ottawa has collected information on ice loads on these structures as part of the NRC Centre of Ice Loads on Structures (Timco, 1996; 1998). From this information, 149 Events were extracted from these structures (4 Events on Tarsiut caisson, 13 Events on the SSDC and 132 Events on the Molikpaq). There is a wide range in the measured ice loads on these structures. This range reflects the wide range of ice thickness, ice type and ice morphology and ice failure modes. Load measurements ranged from 4 to 470 MN on these structures that were on the order of 100 m in width (see Table 1).
4.7 Natural Islands
In the early 1980s, two separate research programs were carried out in the Canadian Arctic to investigate ice forces on small, isolated islands. One program, at Adams Island, was organized and carried out by the Canadian Government (Frederking et al. 1983, 1984, 1986). At Adams Island, the main focus was on the interaction of landfast ice with a fixed structure. Different types of sensors were embedded into the ice surrounding the island. The other program, at Hans Island, was an industry venture led by Dome Petroleum (Danielewicz and Metge, 1981, 1982; Danielewicz and Cornett, 1984). At Hans Island, the interaction events were much more dynamic and centered on the collision of large multi-year floes with the island. At this site, the decelerations of large floes were measured as they collided with the island. Both test programs produced useful information on different types of ice conditions. A total of 17 Events were identified (2 Events at Adams Island and 15 Events at Hans Island). Adams Island has a diameter of 200 m, and the measured loads ranged from 49 to 54 MN from ice with a thickness of 1.6
to 1.75 m. Hans Island has a diameter of 1000 m, but the contact width was much less than this during the collisions from the ice floes. The calculated loads ranged from 7 to 600 MN from the impact of multi-year ice with a thickness of 3.4 to 8 m.
5. DISCUSSION
Examination of the available information on ice loads is very revealing. The load ranges reported in Table 1 provide a general guide to the level of forces that might be expected on each of the different types of structures subjected to ice loads. A detailed analysis of the data in terms of failure modes, loading rates, etc. is beyond the scope of this paper. However it is possible to look at the loads with a very “broad brush” approach. To do this, the data have been separated based on the width of the structure.
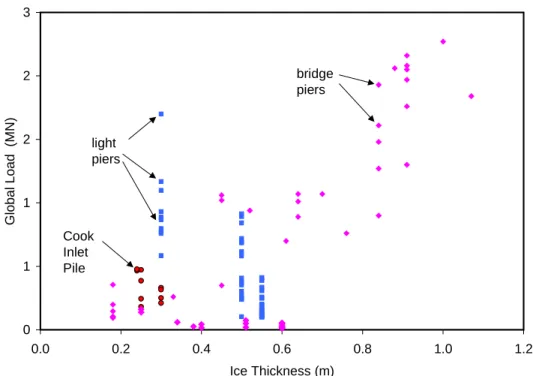
Narrow structures include the Cook Inlet test pile and all of the bridge piers and light piers. The remaining structures have been classified as wide structures. Figure 1 shows a plot of the load levels versus ice thickness for the narrow structures. These Events are comprised of a mix of both thermally-induced loads and loads due the impact from an isolated ice floe. In many instances, the ice strength is relatively low during the impact Events, since the impacts occur during the spring ice break-up. For these structures, there is a general trend of increasing load with increasing ice thickness. The load levels range up to 3 MN with ice on the order of 1 m thick. It is interested to note that when the ice is less than 1 m thick, engineering practice has been to use structures with a width less than 4 meters.
Figure 2 shows a plot of the global load versus ice thickness for all of the wide structures. There is a wide range in the reported load levels. This reflects the wide range of failure modes and loading times for these Events. Load levels up to 500 MN have been reported for wide offshore structures. The Hans Island impacts from multi-year ice floes have produced load levels on the order of 600 MN. Although there is scatter, the data appears to present an upper bound for ice loads as a function of ice thickness. The line indicated on Figure 2 shows that an upper envelope for the global load on wide structures is about 100 MN per meter of ice thickness.
0 1 1 2 2 3 0.0 0.2 0.4 0.6 0.8 1.0 1.2 Ice Thickness (m) Gl obal Load ( M N) Cook Inlet Pile light piers bridge piers
Figure 1 Global load versus ice thickness for narrow structures such as light piers and bridge piers.
0 100 200 300 400 500 600 700 0 1 2 3 4 5 6 7 8 9 Ice Thickness (m) Gl obal Load ( M N) wharves & dams, Adams Island offshore structures Hans Island M.Y. Impacts
~ 100 MN per 1 m ice thickness
Figure 2 Global load versus ice thickness for the wide structures. Note that loads up to 500 MN have been measured on structures placed in extreme ice regimes.
6. SUMMARY
The NRC in Ottawa, Canada has developed a comprehensive catalogue of the loads that have been measured on offshore and coastal structures. Full details of the time-series behavior as well as the characteristics of both the structure and ice during the interaction have been documented. The Catalogue should prove to be a valuable resource for understanding the loads that ice can exert on structures.
7. REFERENCES
Blenkarn, K. 1970. Measurement and Analysis of Ice Forces on Cook Inlet Structures. Paper No. 1261 in Proceedings of Offshore Technology Conference, pp 365-379, Dallas, TX, USA.
Comfort G., Abdelnour, R. and Gong, Y., 1993. Phase II Static Ice Loads on Hydro-Electric Structures: Field Measurements and Large-Scale Tests Conducted during the 1992-93 Winter. Report for the Canadian Electrical Association by Fleet Technology Ltd., Vol. I, Project No. 9038 G 815, Kanata, Ont., Canada.
Comfort G., Abdelnour, R. and Gong, Y., 1994. Phase III Static Ice Loads on Hydro-Electric Structures: Field Measurements Made at the Paugan, Arnprior and Otto Holden Dams during the 1993-94 Winter. Report for the Canadian Electrical Association by Fleet Technology Ltd., Vol. I, Project No. 9038 G 815, Kanata, Ont., Canada.
Croasdale, K. 1996. Ice Load Consensus Study. Report by K.R. Croasdale and Associates, Calgary, Al., Canada (proprietary).
Danielewicz, B. and Metge, M. 1981. Ice Forces on Hans Island, August 1980. Arctic Petroleum Operator’s Association Project APOA 180-2, 63 pp., Calgary, Al., Canada.
Danielewicz, B. and Metge, M. 1982. Ice Forces on Hans Island, August 1981, Arctic Petroleum Operator’s Association Project APOA No. 181, CANMAR Drilling, December 1982, 63 pp., Calgary, Al., Canada.
Danielewicz, B. and Cornett, 1984. Ice Forces on Hans Island 1983, Arctic Petroleum Operator’s Association Project APOA No. 202, CANMAR Drilling, Calgary, Al., Canada.
Egan, J.D.P 1993. Light Pier LL104 - Lac St. Francis, PQ Ice Force Measurements, February 19 to April 15, 1993. Public Works and Government Services of Canada Report, Ottawa. Ont., Canada.
Frederking, R.M.W. and Sayed, M. 1992. Ice Impact Force Measurements on a Vertically Faced Bridge Pier. Journal of Offshore Mechanics and Arctic Engineering, Vol. 114, pp. 63 - 65.
Frederking, R.M.W. and Sayed, M. 1990. Ice Force Measurements at Yamachiche Bend and Curve #1 - Winter 1988 – 89. NRC/IRC Reports CR-5552.4 and CR-5554.2, Ottawa, Ont., Canada.
Frederking, R.M.W and Sayed, M. 1989. Measurements of Ice Impact Forces on a Vertically Faced Bridge Pier. Proceedings of 8th International Conference on Offshore Mechanics and Arctic Engineering (OMAE’89), pp. 319 – 323, The Hague, Netherlands.
Frederking, R.M.W. and Sayed, M. 1989. Ice Force Measurements at Yamachiche Bend and Curve #1 - Winter 1987 – 88. NRC/IRC Reports CR-5552.3 and CR-5554.1, Ottawa, Ont., Canada.
Frederking, R. and Sayed, M. 1988. Ice Forces on the Nanisivik Wharf. Proceedings of the 9th International Symposium on Ice, Vol. 1, pp. 463-472, Sapporo, Japan.
Frederking, R.M.W., Wessels, E., Maxwell, J.B., Prinsenberg, S. and Sayed, M. 1986. Ice Interaction with Adams Island, 1984 – 1985. Proceedings of 8th International IAHR Symposium on Ice, Vol. III, pp. 127 – 143, Iowa City, Iowa, USA.
Frederking, R.M.W., Sayed, M., Wessels, E., Child, A.J. and Bradford, D. 1984. Ice Interaction with Adams Island, Winter 1982 – 83. Proceedings in 7th International Symposium on Ice (IAHR), Vol. 3, pp. 187 – 201, Hamburg, Germany.
Frederking, R.M.W., Sanderson, T., Wessels, E and Inoue, I. 1983. Ice Behaviour around a Small Arctic Island. Proceedings of 7th International Conference on Port and Ocean Engineering (POAC’83), Vol. 2, pp. 875 – 887, Helsinki, Finland.
Haynes, F.D., Sodhi, D.S., Zabilansky, L.J. and Clark, C.H. 1991. Ice Force Measurements on a Bridge Pier in the St. Regis River, New York. CRREL Special Report No. SR 91-14, 6 pp, Hanover, NH, USA.
Lipsett, A.W. and Gerard, R. 1980. Field Measurements of Ice Forces on Bridge Piers 1973 – 1979. Transportation and Surface Water Engineering Department, Alberta Research Council and Alberta Cooperative Research Program in Transportation and Surface Water Engineering, Report SWE 80-3, 130 pp., Alberta, Canada.
Masterson. D. et al. 1991. Beaufort Sea Exploration: Past and Future. Offshore Technology Conference paper OTC6530, Houston, Texas, USA.
Peyton, H.R. 1966. Sea Ice Strength. Report from the Geophysical Institute of the University of Alaska, prepared for the Department of the Navy, Office of Naval Research, 69 pp, Fairbanks, Al, USA.
Sanderson, T.J.O. 1989. The Ice Load Question: Some Answers. 4th State-of-the-Art Report on Ice Forces, G.W. Timco, Editor, CRREL Special Report 89-5, pp 377-385, Hanover, NH, USA.
Schwarz, J. et al. 1998. The LOLEIF Project. Proceedings of the IAHR Symposium on Ice, Vol. 2, (in press), Potsdam, N.Y., USA.
Timco, G.W. 1998. NRC Centre for Ice Loads on Offshore Structures. NRC Report HYD-TR-034, Ottawa, Ont., Canada.
Timco, G.W. 1996. NRC Centre of Ice/Structure Interaction: Archiving Beaufort Sea Data. Proceedings 13th IAHR Symposium on Ice, Vol. 1, pp 142-149, Beijing, China.
Wessels, E. and Jochmann, P. 1990. Determination of Ice Forces on Jacket JZ 20-2-1 by Model and Full Scale Tests. Hansa – Schiffahrt-Schiffbau-Hafen- 127, Jahrgand, Nr. 22, pp 1567-1570.