HAL Id: hal-03087524
https://hal.archives-ouvertes.fr/hal-03087524
Submitted on 23 Dec 2020HAL is a multi-disciplinary open access archive for the deposit and dissemination of sci-entific research documents, whether they are pub-lished or not. The documents may come from teaching and research institutions in France or abroad, or from public or private research centers.
L’archive ouverte pluridisciplinaire HAL, est destinée au dépôt et à la diffusion de documents scientifiques de niveau recherche, publiés ou non, émanant des établissements d’enseignement et de recherche français ou étrangers, des laboratoires publics ou privés.
In-situ investigation of adhesion mechanisms on complex
micro-structured biological surfaces
Charchit Kumar, Damien Favier, Thomas Speck, Vincent Le Houerou
To cite this version:
Charchit Kumar, Damien Favier, Thomas Speck, Vincent Le Houerou. In-situ investigation of adhesion mechanisms on complex micro-structured biological surfaces. Advanced Materials Interfaces, Wiley, 2020, 7 (20), �10.1002/admi.202000969�. �hal-03087524�
1
In-situ investigation of adhesion mechanisms on complex micro-structured
biological surfaces
Charchit Kumar1,2,3, Damien Favier2, Thomas Speck1,3, and Vincent Le Houérou2,4,*
1 Plant Biomechanics Group and Botanic Garden, Faculty of Biology, University of Freiburg,
Schänzlestraße 1, 79104 Freiburg, Germany
2 Institut Charles Sadron, CNRS UPR022, University of Strasbourg, 23 rue du Loess, BP 84047,
67034 Strasbourg Cedex 2, France
3 Cluster of Excellence livMatS@FIT, Freiburg Center for Interactive Materials and
Bioinspired Technologies (FIT), University of Freiburg, Georges-Kohler-Allee 105, 79110 Freiburg, Germany
4 Laboratoire ICube, CNRS UMR 7357, University of Strasbourg, 72 route du Rhin, BP 315,
F-67411 Illkirch cedex, France
Dr. C. Kumar, Prof. T. Speck
Plant Biomechanics Group and Botanic Garden, Faculty of Biology, University of Freiburg, Schänzlestraße 1, 79104 Freiburg, Germany.
Cluster of Excellence livMatS@FIT, Freiburg Center for Interactive Materials and Bioinspired Technologies (FIT), University of Freiburg, Georges-Kohler-Allee 105, 79110 Freiburg, Germany.
Dr. C. Kumar, D. Favier, Prof. V. Le Houérou
Institut Charles Sadron, CNRS UPR022, University of Strasbourg, 23 rue du Loess, BP 84047, 67034 Strasbourg Cedex 2, France.
Prof. V. Le Houérou
Laboratoire ICube, CNRS UMR 7357, University of Strasbourg, 72 route du Rhin, BP 315, F-67411 Illkirch cedex, France.
E-mail: v.lehouerou@unistra.fr
ORCID IDs:
C. Kumar- 0000-0002-6912-3506 T. Speck- 0000-0002-2245-2636
2
Recently, plant surfaces have attracted great attention given their fascinating functionalities, particularly unique adhesive properties, which are largely resulting from their diverse surface structuring. This paper contributes to the advanced adhesion mechanics investigation on complex biological surface morphologies. Elastomeric replica of three different plant leaves, comprising morphologies at a broad scale (0.5-100 µm), with distinct shapes and complexity, and of a smooth surface were studied in contact with an adhesive probe. To perform precise adhesion measurements, an ultra-nanoindenter was modified based on the JKR (Johnson-Kendall-Roberts) mechanics and equipped with an in-situ real-contact visualization system. The adhesion force on all surfaces was systematically investigated regarding the pre-load conditions. The results were analysed in the light of Hertzian and JKR theories, and underlying morphology-specific mechanisms were identified. A close examination of contact image-force data synchronization revealed unique attachment-detachment mechanisms, arising from different pre-loads and topographies. A significant influence of pre-load on adhesion was observed on the surface with fine micro-structuring and complex morphology, no specific influence was recorded for the remaining two. An overall comparison demonstrates a significant reduction in adhesion on coarse cone-shape patterns and complex micro-structures. The specific adhesion mechanisms arising from biological morphologies may offer assistance to design bio-inspired smart interfaces.
Keywords: Adhesion mechanics, JKR theory, PDMS replica, in-situ imaging, bioinspired micro-structures
3 1 Introduction
Adhesive phenomena are found in a plethora of biological systems as well as in numerous man-made engineering applications, especially when the surface to volume ratio gets extremely increased.[1–5] Undoubtedly, the adhesive characteristics of interacting surfaces are a key feature
to control system’s performance and durability.[4,6] Consequently, it appears of paramount
importance to precisely tune adhesive properties, especially in recently emerging micro- or nano-contact applications.[2,7,8] A well-recognised way to adjust the adhesion characteristics
relies on modifying the surface chemistry.[9–12] Another approach consists in introducing
surface texturing on the interacting surfaces.[13–17] The pioneering work by Fuller and Tabor
back in 1975, proposed a reduction in adhesion force by incorporating surface roughness.[18] In
the last four decades, various approaches have been published utilising notably defined geometrical asperities (square, cylindrical or hexagonal pillars, spherical dimples, etc.) to study the influence of surface morphology on adhesive response.[13,15–17,19–24] Few others explored
adhesion characteristics and contact formation mechanisms on surfaces decorated with ripple or wrinkle shaped texturing.[7,25–29] Regardless of all these studies, the adhesion mechanisms
are not completely understood yet, since the type and complexity of morphologies can cause unique and distinct adhesion behaviours.[7,13,17,30–39]
In nature, adhesion also plays an important role, e.g. for the interaction of animals with plant surfaces or with the inanimate environment.[1,40–43] Broadly mentioning, insect attachment pads
evolved in a manner to assist in sticking to or climbing on various plant surfaces,[41,44–47] while
on the counterpart, most of the plant leaves possess surfaces obstructing or reducing insect attachment.[48–51] Leaf surfaces are often decorated with species-specific surface structuring of
different size, ranging from few nanometres to few hundreds of micrometres, having distinct shape and complexity, both at various levels of hierarchy.[52–56] This induces some optimised
surface functionalities such as surface wettability, anti-adhesive properties, friction reduction, antifouling, slipperiness against insect attachment and optical properties, just to name a few.[44,50,52,53,57–62] As a result, these surfaces gained a lot of attention from the contact
mechanics community which intended to investigate, get inspired, and thus transfer innovative insights into biomimetic surface applications.[14,59,63–70] However, the relationship between
structures and functions is not straight forward, keeping in mind that these plant surface phenomena are driven by a complex interplay of material composition, heterogeneous surface chemistry and diverse surface structuring leading to a highly sophisticated system to investigate.[53,61,62] A possible simplification, that has been used in the past, consists in the
4
precise replication of the complex structural morphologies of plant surfaces onto polymeric surfaces.[49] This facilitates a methodical investigation of the role of surface morphology,
without the influence of physico-chemistry aspects.[49,71,72] Although the advancement in the
micro-structured surface fabrication technologies in the past decades made possible to generate a vast kind of micro- or nano-structures,[19,73–79] it is still far to realise the diversity and intricacy
of biological surface structures.[52–54,56] Nevertheless, several papers have been published
offering different methodological approaches to replicate the surface structures directly from original plant leaves onto the various polymeric substrates.[80–85]
Over the recent years, there has been a growing interest towards the in-situ contact visualization when conducting adhesion investigations, and it became possible with the latest innovations in the field of optical imaging.[7,19,21,22,25,86–89] Surely, in-situ imaging offers a detailed insight into
the contact junctions over the apparent contact area, as well as attachment/detachment mechanisms. However, much of the research performing in-situ contact visualization has been limited to either smooth surfaces[87,90–92] or regular micro-structured surfaces.[7,16,19,21,23,25,31,89]
Indeed, most of the contact mechanics investigations based on plant leaf surfaces could not achieve real-time visualization of the contact formation, down to cellular or sub-micron-sized cuticular fold level.[49,71]
Taken all together, in this work, we use the adhesion mechanics approach to methodically investigate the contact formation (closely inspired from insect-plant interactions) between biological structured replicas and a model adhesive tip. Three model plant leaves were selected and replicated onto polymeric samples, considering a broad morphological range in terms of their structure’s size, shape and hierarchy. By considering the advantageous aspects and final positive replica characteristics relevant to our research specifications, we employed the replication technique presented by Kumar et al. 2018, which uses epoxy resin for generating negative moulds and producing the final replica on Polydimethylsiloxane (PDMS) substrates.[80] The force range that corresponds to plant-insect interactions falls in the few mN
range, and therefore calls for a precise experimental setup.[45,93,94] Such a low force range and
high sensitivity can be accomplished with a nano-indenter like apparatus.[95–97] Thus, we
introduce an adhesion force tester (modified nano-indenter) to perform low-range adhesion force measurements under precise load or displacement control. Furthermore, the modified apparatus permits to visualise the in-situ contact on the complex micro-structured surfaces. At first, this paper quantitatively investigates adhesion force characteristics on the PDMS leaf replicas and on a smooth PDMS surface benchmark, and critically examines the influence of
5
pre-load and surface morphology. Furthermore, the dedicated in-situ imaging offers a comprehensive insight into the real and apparent contact areas, along with the understanding of attachment and detachment mechanisms.
2 Results and Discussion 2.1 Surface Morphologies
The results of SEM surface morphological investigation, shown in Figure 1, prove the high precision of PDMS replicas, made directly from original plant leaves by using Epoxy–PDMS replication. All three plant leaf surfaces, H. brasiliensis leaf with wrinkle-shaped fine microstructures (Figure 1.a and Figure 1.b); L. discolor surface with cone-shaped coarse micro-structures (Figure 1.d and Figure 1.e); and L. chinensis with complex hierarchical microstructures (Figure 1.g and Figure 1.h) were replicated to PDMS with high fidelity. After the n-heptane treatment, all samples were perfectly restored back by de-swelling to their original state without damage, as proven in Figure 1.c, 1.f and 1.i.
2.2 Adhesion Force Characteristics
Adhesion force measurements were carried out for each polymeric replica as well as for a smooth PDMS surface. Data sets were recorded by carrying out in total 5 to 7 experiments spotted on the samples for each surface type. Figure 2 shows a plot obtained from a typical pull-off adhesion force measurement on a smooth PDMS sample. Adopting the standard contact mechanics formalism, the absolute maximum negative force value during the retraction phase corresponds to the adhesion pull-off force (Fad), as reported in Figure 2.[7,98] In order to
investigate the effect of pre-load (FL), adhesion experiments were performed at the same spot,
for seven different FL values: 0.5, 1.0, 1.5, 2.0, 2.5, 3.0 and 3.5 mN, keeping all other test
parameters (loading/unloading rate, retraction speed, and test duration) and conditions constant. In the following sub-sections, the results on attachment and detachment mechanisms, alongside with the results from the pre-load effects on adhesion force characteristics, are presented and discussed consecutively for each surface type. For reading convenience, hereafter, only genus name is used to address each PDMS replica sample instead of full species name: Hevea replica for H. brasiliensis, Ludisia replica for L. discolor, and Litchi replica for L. chinensis.
6
2.2.1 Smooth PDMS
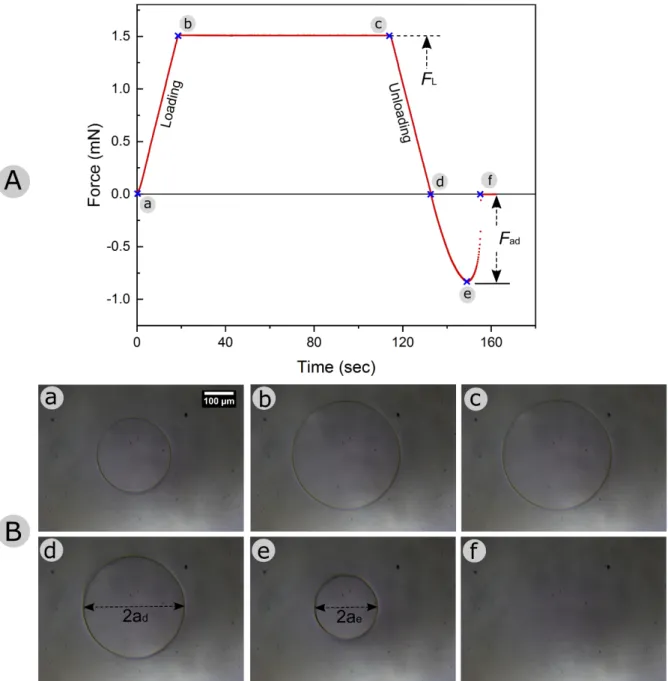
A force-displacement-time curve of an adhesion measurement, for a whole test cycle, on smooth PDMS sample at a pre-load (FL) of 1.5 mN is shown in Figure 2.A. The measured
adhesion force (Fad) is 0.827 mN. Still image sequences from the in-situ contact video (see the
Video 1 in supporting data) of the adhesion test at the various points of interest (a-f) are set out in Figure 2.B. With regard to the kinetics of a smooth PDMS contact, attachment and detachment events appeared very continuous, homogenous and circular in shape over the whole contact cycle. The real contact area increased with increasing normal load and started decreasing once the retraction part began, involving the well-known adhesion hysteresis.[99] The
point (a) in the graph indicates the contact point at zero load, right after the snap-in contact has taken place (not shown in the graph) ending the approach step. Therefore a small contact could be seen in the corresponding in-situ contact image (Figure 2.a). At this state, tip and substrate already formed a solid-solid intimate contact. After this, the continuous loading phase began and the tip slowly is pressed onto the substrate surface under a precise load controlled loading, at a rate of 83.3 µN/sec. Point (b) in the graph represents the phase when the system can relax under the constant maximum load: a closer observation of point b (radius ≃ 184 µm) and point c (radius ≃ 188 µm) exhibited a small increase in radius at point c, which witnesses this material relaxation.
The JKR theory is suitable to describe the contact mechanics for soft compliant materials with high adhesion energy.[100,101] In order to confirm the applicability of the JKR theory, one could
utilize the dimensionless physical parameter, Tabor’s parameter (µ$), which is defined by: µ$ = &𝑅𝑊) 𝐸∗)𝑍 -. / 0 .⁄ (1)
Here, R is the relative radius of curvature of the contacting bodies, and can be estimated with 1 𝑅⁄ = 1 𝑅⁄ 0+ 1 𝑅⁄ (with 𝑅) 0 and 𝑅) being the radii of the contacting bodies), E* is the
effective elastic modulus, which can be calculated using 𝐸∗ = 𝐸 2(1 − 𝑣⁄ )); E is the PDMS Young’s modulus and v is the Poisson’s ratio (vPDMS = 0.5).[90] The E value for PDMS was
calculated as 1.01 ± 0.01 MPa by using the classical JKR model fitting on smooth PDMS substrate. [102,103] Z0 is the equilibrium separation of the surfaces in the Lennard-Jones potential
and usually comes in between 0.3 and 0.5 nm.[90] If µ
$ value is greater than 5, then a contact can be well described using the JKR theory.[101] By utilising the known values from the given
7
experiment’s formation: 𝑅0 = 1.5 mm (tip), 𝑅) = ∞ (flat surface), µ$ value would result in the range of ≈ 3500- 5800. This value range clearly suggests the well applicability of JKR model in this experiment. Further investigation of the retraction part of the curve shows, that the measured value of the contact diameter (2ad) at the absolute zero load condition (Figure 2.d)
was found to be 348 µm. The contact diameter (2ae) at the very lowest force point, the point of
detachment instability, where the contact diameter abruptly vanished to zero, was measured to
be 219 µm (Figure 2.e). This finding is in good accordance with the previously established JKR theory, which predicts the following relation ae = 0.63ad.[104,105]
Effect of pre-loading: The results reported in Figure 3 show the effect of FL on Fad. Here, Fad
values appear to be independent (Fad ≃ 0.809 mN) from FL variations, which is again in good
agreement with the Johnson, Kendall, and Roberts (JKR, 1971) model,[102] as reported in
previous studies.[106,107] The relaxation time for PDMS is reported to be in the order of
0.05-0.5 s, significantly less as compare to the contact time applied in this investigation.[108] Hence,
it could be assumed that this contact system behaves more likely as elastic since loading and unloading phases could be considered as quasi-static.[108] Actually, all the tests in this
investigation were performed slowly enough to minimize the viscous effects of material. Moreover, no effect of loading history on the adhesion force values in the investigated force range was noticed, as supported with the results stating the independence of Fad from FL. Hence,
this observation very much supports that our test protocol is adequately complying with the standard JKR adhesive model. Therefore, these considerations on smooth PDMS contacts validate our test protocol, notably concerning the loading/unloading speeds and relaxation time which ensure a quasi-static test.
2.2.2 Hevea Replica
An in-situ video of the adhesion test for an entire contact cycle on Hevea replica at a FL of 1.5
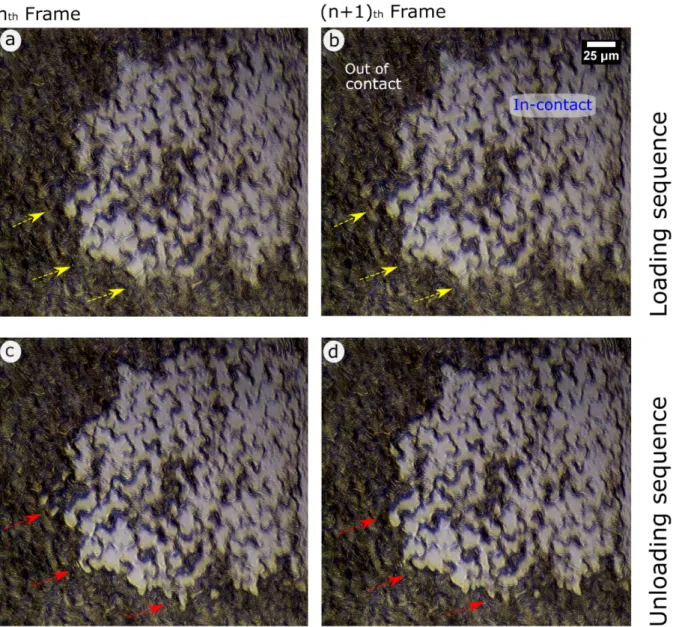
mN is shown in Video 2 (supporting data). To gain a better understanding of the attachment dynamics, we closely analysed the zoomed-in in-situ image captures. The fine structured surface of Hevea replica is easily recognizable (Figure 4) and it is clearly possible to distinguish between the true contact area (in bright contrast) and the area out of contact (in dark contrast). The contact formation initiated at the second level of micro-structuring (fine cuticular folds), and as the contact border advanced a whole cell was pulled in an intimate contact.[19] At the
maximum load, even though each cell appeared to be in full contact, the cell boundaries (outer line surrounding a cell, first level of structuring) were left out of contact (darker line areas). Afterwards, as the detachment event began, two distinct contributions in contact separation
8
mechanisms could be identified when one closely observes the detachment sequences: (i) cell boundaries initiated and assisted the interfacial crack propagation during the detachment sequence and (ii) each cell, as a whole detached at a time, behaving as an individual contact point of instability. The interfacial crack initiation began at the cell boundaries around the outer periphery of the whole contact region and then the crack further spreads toward inner areas. A similar kind of detachment phenomenon has been reported by Jin et al.,[7] where adhesive
contact was formed between a rigid sphere and a rippled elastic surface.
Different contrast during attachment and detachment phases: Another interesting finding from
a closer observation on the zoomed-in in-situ videos is the distinct colour contrast at the contact periphery for the attachment and detachment cycles (Figure 4). Continuous flowing-type of the contact advancement mechanism could be observed during attachment, as illustrated in Figure 4.a and Figure 4.b, while a sharp contrast on contact edges is exhibited during the detachment (Figure 4.c and Figure 4.d). We believe, that the higher edge sharpness in the detachment sequence could be attributed to an increase in local strain and thus led to adhesion profiles on edges showing perpendicular connection fillet. Such a phenomenon has also been mentioned in a previous study by Charrault et al.[90].
Effect of load: Figure 5 shows adhesion force characteristics with increasing normal
pre-load, for Hevea replicas. We investigated further the in-situ contact images to compute the normalized contact area (An) at the full loading condition, for all the FL values (Figure 5, blue
data points). A clear increase in Fad from 0.384 mN to 0.490 mN was observed with increasing
FL from 0.5 to 2.5 mN. However, adhesion force might get saturated with a further increase in
FL above 2.5 mN.[14,22] The increase in Fad could be explained with the filling-up of fine
microstructure pockets between the wrinkles (cuticular folds), while increasing FL. A similar
phenomenon has been found also in previous studies.[14,15,24,109] Actually, at a low FL (0.5 mN)
value, only partial contact occurs at the very top of cuticular folds, resulting in a small normalised real contact area, An = 0.44, reported in Figure 5. With further increasing FL, the tip
material progressively fills up the small non-contact gaps between the wrinkles, hence resulting in an increase in adhesion force by a factor of about 30 %. One can also notice in Figure 5.I and Figure 5.II that there was an evidently larger true area still left in contact even when load was removed (at the absolute zero load), for the higher pre-load (FL = 3.5 mN) condition in
comparison to the smaller pre-load FL = 0.5 mN. This supports the previous statement and
confirms that the observed increase of Fad for Hevea replica is caused by its specific fine
9
Interestingly, An increases in the beginning with increasing FL until 2.5 mN is reached. Above
this value, An appears to get saturated at higher pre-loads (3.0 mN and 3.5 mN).
An curve shows a similar dependency to FL as the adhesion force (Figure 5) does. This similar
trend corroborates the filling of microstructures at high pre-loads, which leads to saturate at high FL values: An tends to saturate at 0.6, and could never reached 1 (the latter meaning
complete full contact). The spherical shape of the tip contributes to this experimental fact since it causes a parabolic (non-flat) pressure distribution.[98,110] This also further implies that the full
intimate contact arose in the middle region, partial contact slowly spreading at the outer edges with increasing FL.[13,19]
2.2.3 Ludisia Replica
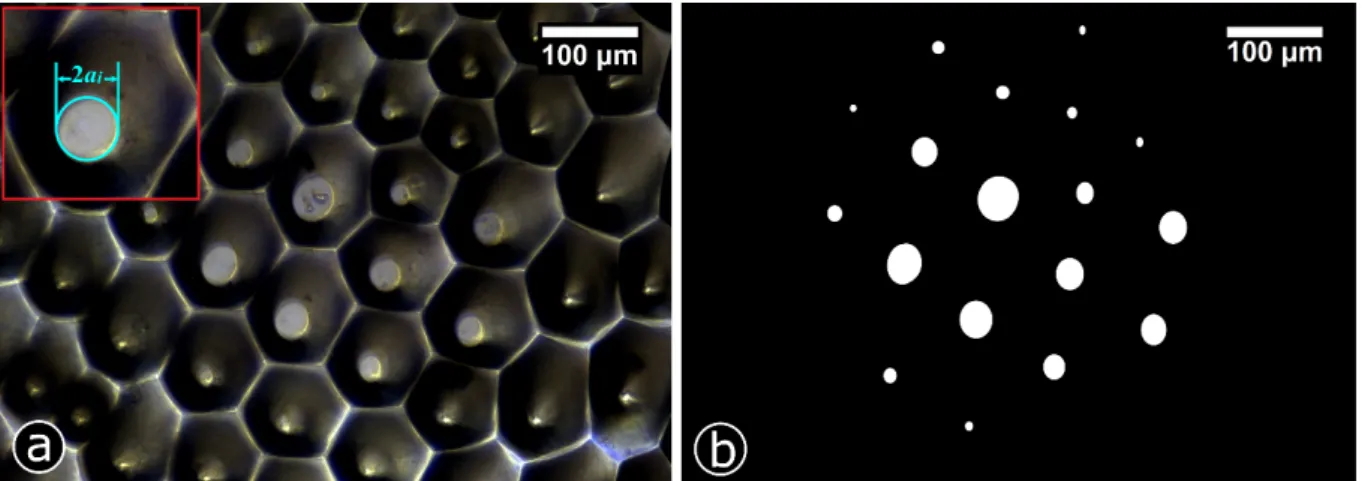
As illustrated in Figure 6.a, the real contact (the bright circular areas) always occurred at the very top of the conical shaped micro-structures of the Ludisia replica, for the complete pre-load range (0.5-3.5 mN). Interestingly, one may note that, the real contact area was significantly lower than the apparent area, and thus is reducing An to 6.91% (at the full loading condition for
FL = 1.5 mN), owing to the specific conical shaped topography. A closer examination of in-situ
video (see supporting Video 3 in supporting data) for a whole test run revealed that the contact formation was continuous, and real and apparent contact grew locally and homogenously circular in shape. The microstructures in middle region contributed more in bearing the contact pressure, as confirmed by the larger size bright spots distributed in the middle area if compared to the outer side (Figure 6.b – threshold image). This can be attributed to the Hertzian-type parabolic pressure distribution given for two contacting bodies.[98,111] This holds likewise for
the whole FL range investigated. As soon as the detachment step is initiated, each true contact
periphery instantly started separating, without exhibiting any explicit contact hysteresis. Further on, a local examination of the contact formation on Ludisia replica pointed out that, the attachment-detachment mechanism on an individual microstructure could be considered similar as to the contact of single asperities on a smooth surface. Indeed, it is meaningful to approximate this behaviour as an inverted case of a half-sphere pressed on a flat surface contact model: at a small scale, the top of each cell tip of Ludisia replica behaves like a spherical asperity, that is locally forming contact against the almost flat surface of the probe. By analysing the surface topographies, average real contact densities and contact formation for a given pre-load, one can assume that the coupling of elastic displacements between a cell microstructure and its neighbouring cells is negligible.[21,112] Thus, we used an approach previously introduced by
10
Romero et al. 2014 and Yashima et al. 2015, to validate the Hertzian character of the contact at the local cell structures scale for Ludisia replica.[21,89]
A standard contact under Hertzian conditions for a sphere in contact with a half-space flat surface[102] can be computed using equation 2.
𝑃> = 𝐸∗?4 𝑎B. 3 𝑅B
(2)
With E* is the effective elastic modulus, which can be here calculated using
𝐸∗ = 𝐸 2(1 − 𝑣⁄ )); E is the PDMS Young’s modulus and v is the Poisson’s ratio (v
PDMS =
0.5).[87,90] The E value for PDMS was calculated as 1.01 ± 0.01 MPa by using the classical JKR
model fitting on smooth PDMS substrate;[102,103] R
i is the normalized radius of curvature of the
circular cell tip of the Ludisia replica; ai represents the radius of the local real contact forming
at each individual tip (Figure 6.a), and was computed by locating real contact spots on the threshold image, as illustrated in Figure 6.b. F is the externally applied normal load, whereas
Pc is the summation of inversely computed local (at real contact junctions) normal loads,
assuming the Hertzian contact model obeyed locally. Using the equation 3, Pc was calculated
at different loads F, for loading and unloading cycles. The Pc versus F results are plotted in
Figure 7, and apparently loading and unloading data points found to be closely following a linear behaviour, with R-square values of 0.998 and 0.997, respectively.
Moreover, Pc values for the unloading cycle trace back to nearly zero, and overlap quite well
with the loading curve, thus validating the assumption of the Hertzian local contact model for the Ludisia replica. Accordingly, our results are supporting the assumption of a negligible elastic couplings in between the neighbouring cells so that at this scale each asperity in contact can be considered as an individual non-adhesive contact.
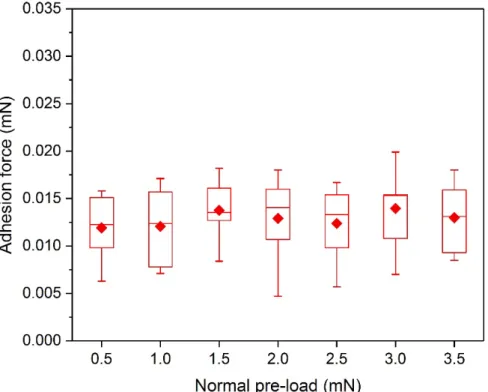
Effect of pre-load: Here, the Fad values found were the lowest compared to all other surfaces
investigated. For instance, at the pre-load condition of 1.5 mN, Fad (0.014 mN) was reduced by
about 98% in comparison to a smooth PDMS surface (0.809 mN). This reduction in Fad holds
for all FL conditions. Fad results as a function of FL are presented in Figure 8 and clearly
illustrate no notable variation in Fad with increasing FL. This is consistent with the validation
of the local Hertzian contact on each cell of the Ludisia replica surface and thus supports our assumption of non-adhesive contact at local scale. Our results also suggest that loading and
11
unloading at small scale can still be considered as quasi-static since no viscous hysteresis was detected.
2.2.4 Litchi Replica
An in-situ video for a whole adhesion test cycle, on Litchi replica, at a FL of 1.5 mN is presented
in Video 4 (supporting data). At first sight, contact mechanics appeared to be very complex, given the fact of the high complexity of surface microstructures of Litchi replica combined with the obvious video quality limitations. Indeed, one could point out that the in-situ videos on
Litchi replica lacked in-detail clarity in comparison to other three surfaces studied, pointing out
the technical limitations of proposed technique for certain highly complex morphologies. Nevertheless, it was visible that the real contacts (bright spots) were discretely distributed over the apparent contact zone, related to the heterogeneous and random surface structuring. To gain a better understanding of the attachment mechanism, zoomed-in videos have been checked and the local contact zones were analysed. As soon as the loading event started, fine cuticular folds began to form partial top-contact. With further increase in pre-load, the overhanging fine structures (cuticular folds) of an individual ‘rose-flower-shaped’ unit accumulated together and started forming a localised cluster of units, as could be seen as close bright spots appearing in the in-situ video, at the fully loaded condition (dashed domain in Figure 9.II). After the full loading phase, during the retraction cycle a particular feature was observed: the sudden fluctuating behaviour and profile of the force-displacement curve, as presented in Figure 9.I (like the point “C” for instance), which called for further analysis. We examined the in-situ video sequence corresponding to the position of major sudden fluctuations on the force-displacement curve. This became possible thanks to the real-time image-data point synchronization. A series of in-situ contact images corresponding to various points of interest during the retraction part of the force-displacement curve are illustrated in Figure 9.II. This fluctuation behaviour could be understood by taking into account two energy factors: (1) the bending of overhanging patterns leading to localized storage of the elastic strain energy, and (2) the agglomeration of ‘rose-flower-shaped’ unit (micro-morphologies) gathered in a short range coupling style. During the unloading phase, the bended folds started popping out, and thus caused a sudden release of the stored elastic energy that acted against the adhesion force.[36]
These real contact morphologies are discretely distributed over the apparent contact zone, thus implying the individual agglomerated cluster released the stored energy locally with the instable separation. This behaviour appeared to be more force sensitive, and therefore, it was more pronounced and clearly visible at higher pre-load (FL = 3.0 mN as compared to 0.5 mN), which
12
can be seen in Figure 9.II. This might be attributed to similar force-dependence mechanism as found in Hevea replica (section 2.2.2).
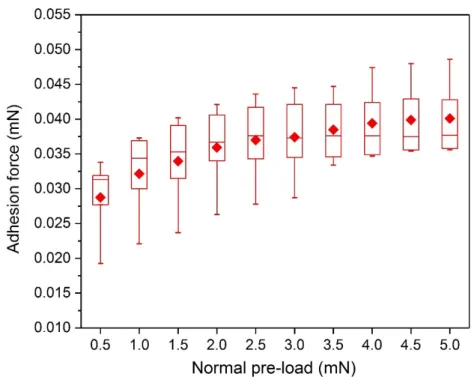
Effect of pre-load: Figure 10 shows the results from the effect of FL on Fad characteristics for
Litchi replicas. An initial increase in Fad with raising FL, until 3.5 mN is clearly visible. Since
the previously described parameter range (i.e. FL between 0.5-3.5 mN) did not provide a
particular transition, we therefore continued the tests up to FL = 5.0 mN. Thus, Fad appeared to
get saturated with a minor variation from 4.0 mN onwards. This could be explained with the force sensitive phenomenon associated with the complex surface morphology of Litchi replicas previously discussed. At low FL values, true contact formed partially only on the very top of
overhanging micro-structures, whereas with increasing in FL more real contact is formed
leading to higher adhesion measured at the detachment. Actually, one could note in the Figure 9.a and Figure 9.A, that there was a larger true contact area for higher FL (3.0 mN) as compared
to low FL (0.5 mN), at the absolute zero load condition during the unloading cycling.
3 Overall Comparison and Conclusions
In the present paper, a systematic study of adhesion contact mechanics at a low force range on high-precision transparent replicas of biological micro-structured surfaces is presented. In order to achieve such detailed investigation, we successfully developed an innovative technique for
in-situ contact visualization, allowing the analysis of attachment-detachment mechanism on
transparent replicas of complex biological surface morphologies. In this study we experimentally evaluated the pull-off adhesion force of four distinct surfaces and analysed its dependence to pre-load and surface morphology. Based on the key findings of this investigation the following conclusions can be drawn:
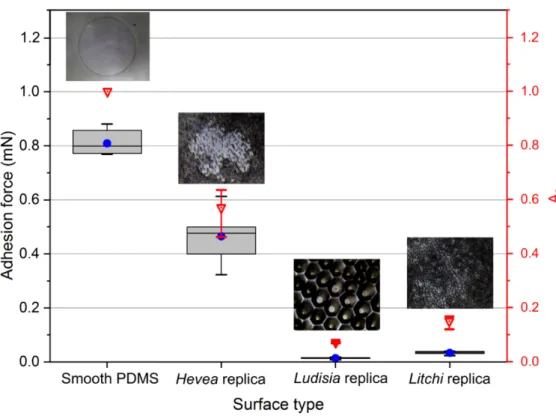
• A significant difference in Fad between the all four surfaces was found, as presented in
Figure 11, for FL = 1.5 mN condition. The same trends appear for all other FL conditions
tested as well.
• Apparently, the smooth PDMS surface exhibited the highest value of adhesion force (Fad≃
0.809 mN, at FL = 1.5mN) out of all the four tested surfaces (Figure 11). On the surface with
fine wrinkle shaped micro-structuring (Hevea replica) Fad is reduced by 42.5 % (Fad≃ 0.465
mN at FL = 1.5 mN) in comparison to the smooth PDMS surface. However, the adhesion
force of the Hevea replica is still significantly higher in comparison to the other studied micro-structured surfaces. The surface showing coarse sized micro-structures (Ludisia replica) and the surface with complex hierarchical structuring (Litchi replica) both showed
13
a markedly lower value of adhesion force, with Fad = 0.014 mN and 0.035 mN respectively.
The large reduction in adhesion force in the case of Ludisia replica could be attributed to the specific structure shape which favours local adhesion-free (Hertzian-like) contacts. This differs to what has been demonstrated in some previous studies of adhesion enhancement by using soft and compliant geometries with high aspect ratio.[32,35,66,113–115] Moreover, it is interesting to note in the Figure 11 that the adhesion force plot clearly follows a similar decreasing trends as the An plot. This could be interpreted as a confirmation of the correlation
between the adhesion ability and the contact surface splitting, although we believe that local phenomena inducing large strain rate during detachment may overcome this rule. Unexpectedly, further analysis consisting of the normalization of Fad by Ar did not permit to
get additional insights in this respect.
• Contrary to smooth PDMS and Ludisia, the surface of Litchi and Hevea replicas demonstrated an increase in Fad with FL, which was attributed to the filling of fine
microstructure pockets at high pre-loads.
• Thanks to the newly developed method of in-situ visualization, the distribution of real contact zones reveals a high dependency on size and morphologies of the surface structures and also exhibits distinct attachment and detachment phenomena.
The new in-situ contact visualisation method, its technical advancement and the results based thereon being presented in this study open up a promising direction in the understanding of contact formation on high-precision replicas of complex biological surface structures. The insights gained from this study, especially concerning force-dependent adhesion behaviours associated to morphology dependent attach-detach modes, may provide a valuable basis for designing novel bio-inspired functional surfaces with (fine-)tunable adhesion properties at a local scale. As prospects, the individual contribution of each level of hierarchical surface structuring on the adhesion force characteristics appears of prior importance.
4 Experimental Section
4.1 Investigated Biological Surfaces
Three different plant leaf surfaces were selected for this study, on the basis of different size, distinct morphology and complexity of their surface structuring. Rubber tree (Hevea
brasiliensis; adaxial, i.e. upper leaf surface) shows two levels of structuring consisting of
“puzzle piece-shaped” epidermal cells covered by fine cuticular fold microstructures (cf. Figure 1.a), with both height and width of about 0.5-1 µm and an intermediate spacing of 0.5-1.5
14
µm.[49] Jewel orchid (Ludisia discolor; adaxial) exhibits circular cone-like shaped
microstructures (cf. Figure 1.d) with a diameter of about 50-100 µm and a height of about 50 µm.[80] Lychee (Litchi chinensis; abaxial, i.e. lower leaf surface) has a complex hierarchical
surface structuring (cf. Figure 1.g) consisting of ‘rose-flower-shaped’ units inducing undercuts and overhanging substructures.[49] Additionally, previous work by Prüm et al.[50] showed that
the leaf surfaces of H. brasiliensis and L. chinensis possess anti-adhesive properties for insects resulting from their specific micro structuring. For better morphological visualization, three-dimensional scan animations for all three leaf surfaces are presented in supporting data (Video 7, Video 8 and Video 9). All leaves used in this investigation were freshly collected just before processing the replication. Corresponding plants were grown in the Botanic Garden of the University of Freiburg, Germany.
4.2 Preparation of PDMS Replicas and Smooth Surfaces
PDMS (Polydimethylsiloxane), a silicone based soft elastomer, offers various key advantages: easy handling, low cost, non-toxicity, low surface energy (γ = 22 mJ.m-2) and low elastic
modulus (E = 0.5-4 MPa).[116] Because of its high γ/E ratio, it is suitable for adhesion mechanics
studies and has been widely used in the past by various researchers.[21–23,87,90,106] This
silicon-based elastomer has a very low glass transition temperature (-120 °C). It gets easily cross-linked into a very stable elastic network, showing high chemical stability at room temperature, and no explicit interaction with other material.[117] Importantly, PDMS exhibits high optical
transparency, thus being a perfect applicant for achieving the in-situ contact visualization.[118]
Surface microstructures from the original plant leaves were precisely transferred onto PDMS, using the two-step replication technique described elsewhere.[80] A simplified description of the
replication process is schematically presented in Figure S1 (supporting data). At first, negative moulds were developed with two components epoxy resin (Epoxydharz HT 2, R&G Faserverbundwerkstoffe GmbH, Germany) directly from the original fresh plant leaves. Fresh plant leaves were cut into small pieces (approximately 4 cm × 4 cm), and immediately secured onto a plastic petri dish with a double-sided adhesive tape. Subsequently, the uniformly mixed bubble free epoxy mixture (resin to hardener ratio of 10: 4.8) was steadily poured onto the leaf sample surfaces. After curing for 15 h at ambient conditions (temperature = 20-25°C and relative humidity = 40-60%), plant leaves were separated from negative epoxy moulds. In the case of L. chinensis leaves, the demoulding was fulfilled by a special anti-stiction step comprising the treatment of negative replica sample in an aqueous solution (60 g/100 ml) of potassium hydroxide (KOH, ≥85%, p.a., Carl Roth GmbH & Co. KG, Karlsruhe, Germany) at
15
60 ± 3°C for 20 h. In step two, negative epoxy moulds were filled up with low-viscosity Polydimethylsiloxane (Bluesil ESA 7250 A & B kit, Bluestar Silicones GmbH, Germany) mixture (monomer to cross-linker ratio of 10: 1) and were kept in a vacuum chamber for one hour to remove air entrapped at the interface. After curing at 75°C for 3 h, cross-linked PDMS replicas were peeled off from the negative moulds. Each replica sample was quality inspected for any replication imperfection, using an optical stereo microscope. Four samples were developed for each investigated surface type, to ensure statistical representativeness during adhesion tests. Smooth PDMS samples were produced by curing the same PDMS mixture in a freshly opened flat bottom glass petri dish.
All samples (PDMS leaf replicas as well as the smooth PDMS samples) were swollen in a solution of n-heptane and 1-dodecanethiol (0.01 %) for overnight to remove the sol fraction (to extract the remaining unreacted free chains). After then, all the swollen samples were dried at ambient room conditions for at-least 24 h to restore back to their original state.[99,119,120]
4.3 Surface Characterization
Surface morphology visualization and characterization was done using scanning electron microscopy (Leo 435 vp, Leica, Wiesbaden, Germany and Hitachi SU8010, UHR FE-SEM, France). For the plant leaf samples, fresh leaves were dehydrated in methanol solution and dried by using critical point drier (LPD 030, Bal-Tec).[121,122] In order to avoid surface charging, all
samples (plant leaves, PDMS replicas, and replicas after n-heptane solution treatment) were metalized with a thin (ca. 10 nm) coating of gold (Cressington Sputter Coater, 108 auto) after being mounted on aluminium stubs (Plano GmbH, Wetzlar, Germany) and side walls coated with conductive silver paint (Acheson Silver DAG 1415M, Plano GmbH, Wetzlar, Germany). All SEM examinations were performed in the 30°- 45° tilting angle range. In addition, three-dimensional morphological scan of all fresh plant leaf surfaces was visualized and recorded with a confocal laser scanning microscope (LEXT OLS4000, Olympus Corporation, Japan). 4.4 Adhesion Testing
4.4.1 Description of the Modified Adhesion Force Tester
In 1971, Johnson, Kendall and Roberts (JKR) proposed a theory to describe the contact area of two elastic bodies in contact while considering adhesive forces acting between them.[102] The
key characteristics of this theory include a finite non-zero contact at the zero normal load condition and a minimum negative (tensile) force (Fad) required to separate the contacting
16
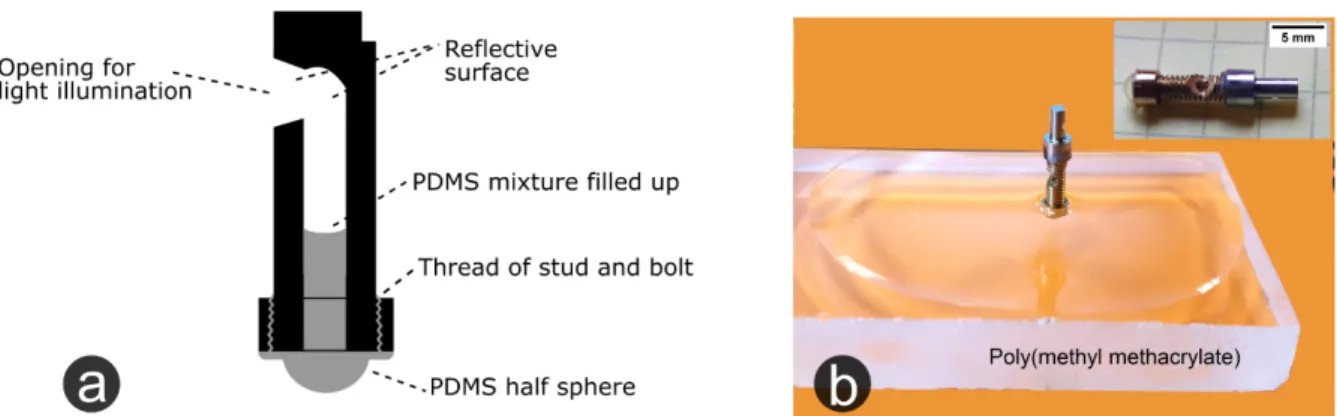
with a JKR contact mechanics based apparatus, and described in-details in the following section. An ultra-nanoindentation tester (UNHT³, Anton Paar Tritec, Switzerland) with a high-resolution load-control of 3 nN and a depth high-resolution down to 0.3 nm was modified to perform low range adhesion force measurements, together with in-situ contact visualisation, as illustrated in a simplified schematic in Figure 12. Indeed, a dedicated optical system was introduced into the equipment, permitting high-resolution differential contrast microscopy based on transmission light microscope principle: a light beam shines from the probe and propagates through the tested substrate.[123,124]
In our investigations, since the size of the probe (half sphere of 1.5 mm radius) and the substrate patterning are small, it was delicate to incorporate the optical prerequisites associated to transmission light microscopy within the adhesion tester. White light from a fibre optic cold light illumination (KL 1600 LED, Schott AG, Germany) shines at the tip, via passing from a polarizer filter, and focused with a condenser lens onto the tip opening spot, with the purpose to get high-intensity illumination (Figure 12). A special tip (Figure 13) was fabricated with an internal micro-hole (radius = 0.5 mm) and with a micro-metal machining finished (alighted at an angle of ca. 45°) on top of the tip, so that the light beam is perpendicularly reflected and follows a path in the direction to the soft probe. An analyser along with an objective lens and a high definition colour camera (Basler acA3800-14uc, with a 10Mpix CMOS sensor, Germany) lie just under the substrate surface. This optical setup is mounted on a micromanipulator, benefiting to precisely focus on contact spot. The transmitted light beams through the contact junctions, where both surfaces (PDMS-PDMS) are in real-contact with matching refractive index, leading to high contrast bright spots. Light get randomly scattered over the area where no intimate contacts (PDMS-air interface) were established and thus appears as dark domains. Polarizer and analyser filters facilitated to obtain sharp yielded contact edges. Furthermore, the apparatus is equipped with a custom-build dedicated electronic system that enables simultaneous recording of the video frame in real-time synchronization with the corresponding force data points.
4.4.2 Model Adhesive Tip
A particular caution was paid to the soft elastomeric adhesive tip which was fabricated using a two-step moulding process. In the first step, a thick Polymethyl methacrylate (PMMA) substrate was locally heated up till ca. 100 ± 5°C, with an air heating gun. A sapphire ball (Edmund Optics, United States) with a radius of 1.5 mm and surface roughness of Ra = 0.005 µm was gradually pressed down until the ball half subsided into the PMMA surface. After cooling for 30 min, the ball was separated out from the bulk with a vacuum suction gripper, and
17
consequently provides a negative impression on the PMMA surface. This latter was then filled up with a PDMS mixture (prepared with same mixing protocol as described in section 4.2) and degassed in a vacuum desiccator for 20 min to remove any air bubble that could be trapped during pouring. The homebuilt tip holder evoked previously (Figure 13) consists of the assembly of an external screw thread and a nut attachment at its very end. Tip assembly was gradually put on top of the PDMS mixture which filled PMMA mould (Figure 13.b). During the PDMS curing process, the PDMS mixture filled up by capillarity the small gaps formed at the thread in between stud and bolt, as illustrated in Figure 13.a, thus ensuring a good anchorage of the PDMS tip with the holder.
Additionally, we observed that the PDMS level also raised up inside the drilled hole, consequently promoting a strong bulk attachment of PDMS tip with the tip holder (Figure S2 in supporting data). Tip’s centre alignment with the centre of the PMMA mould was essential to get a uniform contrast all over the whole contact image during the in-situ visualization: the development of a perfectly aligned tip required several attempts (typically up to 4-5 tips) to become successful. After development, each tip assembly was checked under optical microscope and non-aligned tips were discarded. Furthermore, to examine any surface imperfection, tips were checked with a scanning electron microscope (Figure S2 in supporting data).
4.4.3 Surface Referencing
An important aspect during low force range tests is the accurate detection of the very-top point of contact i.e. surface referencing.[96] It becomes even more crucial, when both tip and substrate
samples are made up of a soft matter polymer, where long-range adhesive forces in between tip and sample surface exist, and time-dependent creep of the polymer material during the referencing process itself could greatly influence the exactness of reference position and then further affect the accuracy of adhesion measurement.[97,125] In order to ensure a precise surface
referencing, we used a separate parallel referencing tip-head made of metal against a metallic reference base, mounted with a high precision micrometre head, as shown in Figure 12. For the referencing process, at first both the reference tip and the adhesive tip are brought down together, in such a way so that the reference tip touched the reference base at first.
4.5 Experimental Protocol
All substrates were placed on rigid transparent glass plates and further fixed on the test platform. Prior to each set of tests, surface referencing was performed for each surface type. Then, the
18
adhesive tip slowly approaches near to the substrate surface. As the tip reaches in close proximity to the substrate surface, sudden snap-in (pull-in) takes place leading to a resulting pulling force. As the tip displacement increases, the normal load attains zero condition, corresponding to the initial zero load state in the force-displacement graph (Figure 2 - point a). At this state, the adhesion test can start and the adhesive tip begins forming contact under quasi-static loading, at a constant loading rate of 0.083 mN/s, until the defined normal pre-load (FL)
is reached. The adhesive tip is kept under constant FL for a set time and then the tip is retracted
under displacement control motion, at a constant speed of 0.83 µm/s. A graph of a typical adhesion test and pull-off force measurement (named Fad) is shown in Figure 2. The range of
FL was kept low enough and substrate thickness was chosen large enough, so that the ratio of
substrate thickness to mean contact radius was higher than ca. 10, thus the underlying substrate (glass slide) effect could be neglected.[90,103,126] All measurements were conducted in a climate
controlled room (temperature = 22 ± 3°C, relative humidity = 50% ± 10%). 4.6 Image Processing
All the recorded in-situ videos were processed and analysed with the digital image processing tool ImageJ (v. 1.51p, National Institutes of Health, USA) permitting initial homogenous filtering, thresholding, and estimating the real contact and apparent areas.[127] The real contact
area (Ar) was calculated by summing all the individual local real areas (𝐴EF). For the apparent
area (Aap) estimation, multiple outmost peripheral point coordinates were sampled from all
directions and fitted with a standard best-fit ellipse. The normalized contact area (An) is defined
as:
𝐴G = ∑ II JF
KL (3)
5 Supporting Information
Supporting Information is available from the Wiley Online Library or from the author.
6 Acknowledgements
The authors would like to express their gratitude to the gardeners of Botanic Garden of the University of Freiburg for cultivating the plants used in this study. We are thankful to the electron microscopy platform and to the micro-nano-mechanic platform of Institut Charles Sadron, Strasbourg. We would also like to thank the German Research Foundation (Deutsche
19
Forschungsgemeinschaft: DFG), for funding support under the framework of International Research Training Group (IRTG) ‘Soft Matter Science - 1642’.
7 Authors' contributions
C.K., V.L.H., and T.S. conceived the project idea. C.K. contributed towards the fabrication and characterization of replica samples. C.K. together with V.L.H and D.F designed the experimental technique. Adhesion experiments and data analysis were carried out by C.K. First draft of the manuscript was prepared by C.K., and critically corrected by V.L.H. and T.S. All authors have given approval to the final version of the manuscript.
8 Conflict of Interest
The authors declare no conflict of interest.
9 References
[1] M. Scherge, S. Gorb, Biological Micro-and Nanotribology, Springer Science & Business Media, 2001.
[2] B. Bhushan, Springer Handbook of Nanotechnology, Springer Science & Business Media, 2010.
[3] K. Kendall, Molecular Adhesion and Its Applications: The Sticky Universe, Springer Science & Business Media, 2007.
[4] R. Kaneko, in Proceedings. IEEE Micro Electro Mechanical Systems, IEEE, 1991, p.
108.
[5] N. Myshkin, M. Petrokovets, A. Kovalev, Tribology International 2005, 38, 910. [6] A. C. Fischer-Cripps, Introduction to Contact Mechanics, Springer, 2000.
[7] C. Jin, K. Khare, S. Vajpayee, S. Yang, A. Jagota, C.-Y. Hui, Soft Matter 2011, 7, 10728. [8] N. R. Tas, C. Gui, M. Elwenspoek, in Proceedings IEEE Thirteenth Annual International
Conference on Micro Electro Mechanical Systems, IEEE, 2000, pp. 193–198.
[9] R. Maboudian, W. R. Ashurst, C. Carraro, Sensors and Actuators 2000, 82, 219.
[10] W. R. Ashurst, C. Carraro, R. Maboudian, Device and Materials Reliability, IEEE
Transactions on 2003, 3, 173.
[11] E. Kroner, R. Maboudian, E. Arzt, Advanced Engineering Materials 2010, 12, 398. [12] M. Dirany, L. Dies, F. Restagno, L. Léger, C. Poulard, G. Miquelard-Garnier, Colloids
and Surfaces A: Physicochemical and Engineering Aspects 2015, 468, 174.
[13] E. Verneuil, B. Ladoux, A. Buguin, P. Silberzan, The Journal of Adhesion 2007, 83, 449. [14] C. Greiner, A. del Campo, E. Arzt, Langmuir 2007, 23, 3495.
[15] D. Paretkar, M. Kamperman, D. Martina, J. Zhao, C. Creton, A. Lindner, A. Jagota, R. McMeeking, E. Arzt, Journal of The Royal Society Interface 2013, 10, 20130171. [16] S. C. L. Fischer, E. Arzt, R. Hensel, ACS Appl. Mater. Interfaces 2017, 9, 1036.
[17] N. Cañas, M. Kamperman, B. Völker, E. Kroner, R. M. McMeeking, E. Arzt, Acta
Biomaterialia 2012, 8, 282.
[18] K. Fuller, D. Tabor, Proceedings of the Royal Society of London. A, Mathematical and
20
[19] V. Hisler, M. Palmieri, V. Le Houérou, C. Gauthier, M. Nardin, M.-F. Vallat, L. Vonna,
International Journal of Adhesion & Adhesives 2013, 45, 144.
[20] J. Purtov, M. S. Elena V. Gorb, S. N. Gorb, Applied Physics A 2013, 111, 183.
[21] S. Yashima, V. Romero, E. Wandersman, C. Frétigny, M. Chaudhury, A. Chateauminois, A. Prevost, Soft Matter 2015, 11, 871.
[22] É. Degrandi-Contraires, A. Beaumont, F. Restagno, R. Weil, C. Poulard, L. Léger, EPL 2013, 101, 14001.
[23] L. Dies, F. Restagno, R. Weil, L. Léger, C. Poulard, Eur. Phys. J. E 2015, 38, 130. [24] G. Castellanos, E. Arzt, M. Kamperman, Langmuir 2011, 27, 7752.
[25] C. S. Davis, D. Martina, C. Creton, A. Lindner, A. J. Crosby, Langmuir 2012, 28, 14899. [26] Y. Rahmawan, C.-M. Chen, S. Yang, Soft Matter 2014, 10, 5028.
[27] C. S. Davis, A. J. Crosby, Soft Matter 2011, 7, 5373. [28] D. Breid, A. J. Crosby, Soft Matter 2011, 7, 4490.
[29] D. Martina, C. Creton, P. Damman, M. Jeusette, A. Lindner, Soft Matter 2012, 8, 5350. [30] G. Briggs, B. Briscoe, Journal of Physics D: Applied Physics 1977, 10, 2453.
[31] L. Heepe, A. E. Kovalev, S. N. Gorb, Beilstein Journal of Nanotechnology 2014, 5, 903. [32] M. Lamblet, E. V. and Vilmin, A. Buguin, Silberzan, L. Léger, Langmuir 2007, 23, 6966. [33] A. Peressadko, N. Hosoda, B. Persson, Physical Review Letters 2005, 95, 124301. [34] A. Tiwari, L. Dorogin, A. Bennett, K. Schulze, W. Sawyer, M. Tahir, G. Heinrich, B.
Persson, Soft Matter 2017, 13, 3602.
[35] N. J. Glassmaker, A. Jagota, C.-Y. Hui, W. L. Noderer, M. K. Chaudhury, Proceedings
of the National Academy of Sciences 2007, 104, 10786.
[36] S. C. Fischer, K. Groß, O. Torrents Abad, M. M. Becker, E. Park, R. Hensel, E. Arzt,
Advanced Materials Interfaces 2017, 4, 1700292.
[37] E. Kizilkan, S. N. Gorb, Advanced Materials 2017, DOI 10.1002/adma.201704696. [38] S. Vajpayee, K. Khare, S. Yang, C.-Y. Hui, A. Jagota, Advanced Functional Materials
2011, 21, 547.
[39] B. Persson, E. Tosatti, The Journal of Chemical Physics 2001, 115, 5597.
[40] E. Arzt, S. Gorb, R. Spolenak, Proceedings of the National Academy of Sciences 2003,
100, 10603.
[41] E. V. Gorb, S. N. Gorb, in IUTAM Symposium on Scaling in Solid Mechanics (Ed.: F. Borodich), Springer, 2009, pp. 243–252.
[42] E. V. Gorb, J. Purtov, S. N. Gorb, Scientific Reports 2014, 4, DOI 10.1038/srep05154. [43] J. Hazel, M. Stone, M. S. Grace, V. V. Tsukruk, Journal of Biomechanics 1999, 32, 477. [44] S. N. Gorb, Philosophical Transactions of the Royal Society of London A 2008, 366,
1557.
[45] D. Labonte, W. Federle, Philosophical Transactions of the Royal Society B: Biological
Sciences 2015, 370, 20140027.
[46] H. M. Whitney, W. Federle, Current Opinion in Plant Biology 2013, 16, 105.
[47] S. L. Young, M. Chyasnavichyus, M. Erko, F. G. Barth, P. Fratzl, I. Zlotnikov, Y. Politi, V. V. Tsukruk, Acta Biomaterialia 2014, 10, 4832.
[48] S. Poppinga, K. Koch, H. F. Bohn, W. Barthlott, Functional Plant Biology 2010, 37, 952. [49] B. Prüm, H. F. Bohn, R. Seidel, S. Rubach, T. Speck, Acta Biomaterialia 2013, 9, 6360. [50] B. Prüm, R. Seidel, H. F. Bohn, T. Speck, Journal of the Royal Society Interface 2012,
9, 127.
[51] L. Wang, Q. Zhou, Scientific Reports 2016, 6, 19907.
[52] W. Barthlott, M. Mail, B. Bhushan, K. Koch, Nano-Micro Letters 2017, 9, 23. [53] K. Koch, B. Bhushan, W. Barthlott, Soft Matter 2008, 4, 1943.
[54] K. Koch, H. F. Bohn, W. Barthlott, Langmuir 2009, 25, 14116. [55] C. Neinhuis, W. Barthlott, Annals of Botany 1997, 79, 667.
21
[57] W. Barthlott, M. Mail, C. Neinhuis, Philosophical Transactions of the Royal Society A 2016, 374, 20160191.
[58] B. Bhushan, Y. C. Jung, Progress in Materials Science 2011, 56, 1.
[59] K. Koch, B. Bhushan, W. Barthlott, Progress in Materials Science 2009, 54, 137. [60] W. Barthlott, C. Neinhuis, Planta 1997, 202, 1.
[61] H. Bargel, W. Barthlott, K. Koch, L. Schreiber, C. Neinhuis, in The Evolution of Plant
Physiology (Eds.: A.R. Hemsley, I. Poole), Academic Press, London, 2004, pp. 171–194.
[62] M. Eder, S. Amini, P. Fratzl, Science 2018, 362, 543. [63] Y. Bar-Cohen, Bioinspiration & Biomimetics 2006, 1, 1. [64] B. Bhushan, Langmuir 2012, 28, 1698.
[65] B. Bhushan, Philosophical Transactions of the Royal Society A 2009, 367, 1445. [66] A. del Campo, C. Greiner, E. Arzt, Langmuir 2007, 23, 10235.
[67] S. Gorb, T. Speck, Beilstein Journal of Nanotechnology 2017, 8, 403.
[68] E. Kroner, J. Blau, E. Arzt, Review of Scientific Instruments 2012, 83, 016101.
[69] W. Barthlott, M. Mail, B. Bhushan, K. Koch, in Springer Handbook of Nanotechnology, Springer Nature Switzerland AG, 2017, pp. 1265–1305.
[70] J. Busch, W. Barthlott, M. Brede, W. Terlau, M. Mail, Philosophical Transactions of the
Royal Society A 2018, 377, 20180263.
[71] B. Prüm, R. Seidel, H. F. Bohn, T. Speck, Beilstein Journal of Nanotechnology 2012, 3, 57.
[72] C. Kumar, A. Palacios, V. A. Surapaneni, G. Bold, M. Thielen, E. Licht, T. E. Higham, T. Speck, V. Le Houérou, Philosophical Transactions of the Royal Society A 2018, 377, 20180265.
[73] M. Kim, K. Kim, N. Y. Lee, K. Kim, K. Shin, Y. S. Kim, Chemical Communications 2007, 2237.
[74] G. Zhuang, J. P. Kutter, Journal of Micromechanics and Microengineering 2011, 21, 105020.
[75] X. Zhu, H. Chen, L. Zhu, H. Wang, W. Zhang, Optical Engineering 2014, 53, 117109. [76] B. McDonald, H. Shahsavan, B. Zhao, Macromolecular Materials and Engineering
2014, 299, 237.
[77] T. Koerner, L. Brown, R. Xie, R. D. Oleschuk, Sensors and Actuators B: Chemical 2005,
107, 632.
[78] G. Shao, Z. C. Jiahao Wu, W. Wang, Sensors and Actuators A 2012, 178, 230. [79] H. Hassanin, A. Mohammadkhania, K. Jiang, Lab on a Chip 2012, 12, 4160.
[80] C. Kumar, V. L. Houérou, T. Speck, H. F. Bohn, Royal Society Open Science 2018, 5, 172132.
[81] K. Koch, A. J. Schulte, A. Fischer, S. N. Gorb, W. Barthlott, Bioinspiration &
Biomimetics 2008, 3, 046002.
[82] A. J. Schulte, K. Koch, M. Spaeth, W. Barthlott, Acta Biomaterialia 2009, 5, 1848. [83] M. Sun, C. Luo, L. Xu, H. Ji, Q. Ouyang, D. Yu, Y. Chen, Langmuir 2005, 21, 8978. [84] D. P. Pulsifer, A. Lakhtakia, Bioinspiration & Biomimetics 2011, 6, 031001.
[85] S.-M. Lee, T. H. Kwon, Nanotechnology 2006, 17, 3189.
[86] C. Poulard, F. Restagno, R. Weil, L. Léger, Soft Matter 2011, 7, 2543.
[87] V. Vaenkatesan, Z. Li, W.-P. Vellinga, W. H. de Jeu, Polymer 2006, 47, 8317.
[88] B. A. Krick, J. R. Vail, B. N. Persson, W. G. Sawyer, Tribology Letters 2012, 45, 185. [89] V. Romero, E. Wandersman, G. Debregeas, A. Prevost, Physical Review Letters 2014,
112, 094301.
[90] E. Charrault, C. Gauthier, P. Marie, R. Schirrer, Langmuir 2009, 25, 5847. [91] M. K. Chaudhury, G. M. Whitesides, Langmuir 1991, 7, 1013.
[92] Y. Morishita, H. Morita, D. Kaneko, M. Doi, Langmuir 2008, 24, 14059.
22
[94] J. M. R. Bullock, P. Drechsler, W. Federle, The Journal of Experimental Biology 2008,
211, 3333.
[95] F. Carrillo, S. Gupta, M. Balooch, S. J. Marshall, G. W. Marshall, L. Pruitt, C. M. Puttlitz,
Journal of Materials Research 2005, 20, 2820.
[96] J. Nohava, N. Randall, N. Conté, Journal of Materials Research 2009, 24, 873. [97] D. M. Ebenstein, L. A. Pruitt, Nano Today 2006, 1, 26.
[98] J. Greenwood, K. Johnson, Philosophical Magazine A 1981, 43, 697.
[99] S. Perutz, E. J. Kramer, J. Baney, C.-Y. Hui, C. Cohen, Journal of Polymer Science, Part
B: Polymer Physics 1998, 36, 2129.
[100] E. K. Kroner, Adhesion Measurements on Patterned Elastomeric Surfaces, PhD Thesis, Doctoral dissertation, Saarländische Universitäts-und Landesbibliothek, 2011.
[101] D. Grierson, E. Flater, R. Carpick, Journal of Adhesion Science and Technology 2005,
19, 291.
[102] K. Johnson, K. Kendall, A. Roberts, Proceedings of the Royal Society of London. A.
Mathematical and Physical Sciences 1971, 324, 301.
[103] M. Deruelle, H. Hervet, G. Jandeau, L. Léger, Journal of Adhesion Science and
Technology 1998, 12, 225.
[104] D. Maugis, Journal of Colloid and Interface Science 1992, 150, 243.
[105] R. G. Horn, J. N. Israelachvili, F. Pribac, Journal of Colloid and Interface Science 1986,
115, 480.
[106] E. Kroner, D. R. Paretkar, R. M. McMeeking, E. Arzt, The Journal of Adhesion 2011,
87, 447.
[107] D. Paretkar, M. Kamperman, A. S. Schneider, D. Martina, C. Creton, E. Arzt, Materials
Science and Engineering: C 2011, 31, 1152.
[108] Y. Cao, D. Yang, W. Soboyejoy, Journal of Materials Research 2005, 20, 2004.
[109] L. Dorogin, A. Tiwari, C. Rotella, P. Mangiagalli, B. Persson, Physical Review Letters 2017, 118, 238001.
[110] K. Johnson, Proceedings of the Royal Society of London A: Mathematical, Physical and
Engineering Sciences 1997, 453, 163.
[111] H. Hertz, J. Reine, Journal of Applied Mathematics and Mechanics 1882, 92, 156. [112] J. Greenwood, J. P. Williamson, Proceedings of the Royal Society of London. Series A.
Mathematical and Physical Sciences 1966, 295, 300.
[113] S. Gorb, M. Varenberg, A. Peressadko, J. Tuma, Journal of the Royal Society Interface 2007, 4, 271.
[114] G. Huber, S. N. Gorb, N. Hosoda, R. Spolenak, E. Arzt, Acta Biomaterialia 2007, 3, 607. [115] C.-Y. Hui, N. Glassmaker, T. Tang, A. Jagota, Journal of The Royal Society Interface
2004, 1, 35.
[116] A. Mata, A. J. Fleischman, S. Roy, Biomedical Microdevices 2005, 7, 281.
[117] A. Ghatak, K. Vorvolakos, H. She, D. L. Malotky, M. K. Chaudhury, Journal of Physical
Chemistry B 2000, 104, 4018.
[118] F. Schneider, J. Draheim, R. Kamberger, U. Wallrabe, Sensors and Actuators A: Physical 2009, 151, 95.
[119] N. Amouroux, L. Léger, Langmuir 2003, 19, 1396.
[120] M. Deruelle, M. Tirrell, Y. Marciano, H. Hervet, L. Léger, Faraday Discussions 1994,
98, 55.
[121] C. Neinhuis, H. G. Edelmann, Journal of Microscopy 1996, 184, 14. [122] M. J. Talbot, R. G. White, Plant Methods 2013, 9, 36.
[123] R. Allen, G. David, Zeitschrift fur wissenschaftliche Mikroskopie und mikroskopische
Technik 1969, 69, 193.
[124] E. Salmon, P. Tran, Methods in Cell Biology 2007, 81, 335.
23
[126] E. Gacoin, C. Frétigny, A. Chateauminois, A. Perriot, E. Barthel, Tribology Letters 2006,
21, 245.
[127] W. Burger, M. J. Burge, Digital Image Processing: An Algorithmic Introduction Using
24
Figure 1. Scanning electron microscope images of original plant leaf surfaces (left column; a, d and g), their PDMS replicas (middle column; b, e and h), and respective PDMS replicas after n-heptane treatment (right column; c, f and i). (a-c) Hevea brasiliensis (adaxial, upper side surface) exhibits a micron-size wrinkled shape folds. (d-f) Ludisia discolor (adaxial, upper side surface) presents circular cone-like surfaces structures. (g-i) Litchi chinensis (abaxial, lower side surface) surface shows highly complex hierarchical structures.
25
Figure 2. Graph (A) showing the force-time (displacement) curve for a whole test cycle on smooth PDMS sample, at a pre-load (FL) of 1.5 mN. Fad is the adhesion (pull-off) force recorded during the retraction step. Different points of interest (a-f) are marked on the curve. Phase a-b corresponds the loading step, b-c represents the relaxation step, c-d is the unloading phase. Phase d-e-f represents the retraction phase recording the adhesion pull-off force. In (B), a set of in-situ contact images (a-f) corresponding to the points marked on the force-displacement curve is shown. For the full in-situ video corresponding to the above images, see the supporting video 1 in supporting data. The scale bar in image ‘a’ holds for all the six images.
26
Figure 3. Plot of the variation of adhesive pull-off force (Fad) with change in applied pre-load (FL) for smooth PDMS sample. Data points are plotted as standard box-plot (25/75th percentile range)
27
Figure 4. High magnification image sequence representing the contact formation behaviour during an attachment and detachment cycle. Bright areas represent the real area in contact. (a, b) shows the two consecutive (nth and (n+1)th) frames captured during the attachment (loading) cycle, and (c, d) during the detachment (unloading) cycle. The arrows are pointing to the areas of interest with distinct colour contacts at the edge for the attachment and detachment cycles. The scale bar in image b applies to all four images. A corresponding full video (Video 2) is provided in supporting data.
28
Figure 5. Upper part of the figure: Plot (in red, left-side ordinate) of the variation of adhesion pull-off force (Fad) as a function of applied normal pre-load (FL) for Hevea replica samples (N=6). Advancement of the normalized contact area (An) with increase in the pre-load (FL), in blue on right-side ordinate. Lower part of the figure: Image I (for FL= 0.5 mN) and image II (for FL= 3.5 mN) show the in-situ contact areas at the absolute zero load condition, just before the retraction began.
29
Figure 6. In-situ contact image for Ludisia replica at the full loading state for FL = 1.5mN, clearly exhibiting the spatial distribution of micro-contact spots (a). Bright circular shaped spots on top of the conical structures represent the real contact area. The inset image in the upper left corner of the image indicates how the diameter (2a) of a real contact spot on top of a conical tip was estimated. (b) Shows the threshold image after image processing.
Figure 7. Pc versus F plot for the Ludisia replica surface. Linear slope and the overlapping of loading-unloading data points are validating the Hertzian contact theory locally. Pc= summation of inversely computed local normal loads, F= applied load.
30
Figure 8. Variation in adhesion pull-off force (Fad) with increasing applied normal pre-load (FL) for
Ludisia PDMS replicas, (N = 6).
Figure 9. (I, upper part of the Figure) Diagram showing the retraction part of force-displacement curve for a Litchi replica sample, recorded at two different normal pre-loads, keeping all other parameters the