HAL Id: hal-00295839
https://hal.archives-ouvertes.fr/hal-00295839
Submitted on 6 Feb 2006
HAL is a multi-disciplinary open access
archive for the deposit and dissemination of
sci-entific research documents, whether they are
pub-lished or not. The documents may come from
teaching and research institutions in France or
abroad, or from public or private research centers.
L’archive ouverte pluridisciplinaire HAL, est
destinée au dépôt et à la diffusion de documents
scientifiques de niveau recherche, publiés ou non,
émanant des établissements d’enseignement et de
recherche français ou étrangers, des laboratoires
publics ou privés.
vertical, seasonal and latitudinal O3 and CO
distributions over Europe
H. Fischer, M. Lawrence, Ch. Gurk, P. Hoor, J. Lelieveld, M. I. Hegglin, D.
Brunner, C. Schiller
To cite this version:
H. Fischer, M. Lawrence, Ch. Gurk, P. Hoor, J. Lelieveld, et al.. Model simulations and aircraft
measurements of vertical, seasonal and latitudinal O3 and CO distributions over Europe. Atmospheric
Chemistry and Physics, European Geosciences Union, 2006, 6 (2), pp.339-348. �hal-00295839�
Atmos. Chem. Phys., 6, 339–348, 2006 www.atmos-chem-phys.org/acp/6/339/ SRef-ID: 1680-7324/acp/2006-6-339 European Geosciences Union
Atmospheric
Chemistry
and Physics
Model simulations and aircraft measurements of vertical, seasonal
and latitudinal O
3
and CO distributions over Europe
H. Fischer1, M. Lawrence1, Ch. Gurk1, P. Hoor1, J. Lelieveld1, M. I. Hegglin2, D. Brunner2, and C. Schiller3
1Max Planck Institute for Chemistry, Airchemistry Division, P.O. Box 3060, 55020 Mainz, Germany 2Institute for Atmospheric and Climate Science, Swiss Federal Institute of Technology, Zurich, Switzerland 3FZ J¨ulich, ICG-1, J¨ulich, Germany
Received: 20 July 2005 – Published in Atmos. Chem. Phys. Discuss.: 22 September 2005 Revised: 20 December 2005 – Accepted: 9 January 2006 – Published: 6 February 2006
Abstract. During a series of 8 measurement campaigns within the SPURT project (2001–2003), vertical profiles of CO and O3 have been obtained at subtropical, middle and
high latitudes over western Europe, covering the troposphere and lowermost stratosphere up to ∼14 km altitude during all seasons. The seasonal and latitudinal variation of the mea-sured trace gas profiles are compared to simulations with the chemical transport model MATCH. In the troposphere rea-sonable agreement between observations and model predic-tions is achieved for CO and O3, in particular at subtropical
and mid-latitudes, while the model overestimates (underesti-mates) CO (O3)in the lowermost stratosphere particularly at
high latitudes, indicating too strong simulated bi-directional exchange across the tropopause. By the use of tagged trac-ers in the model, long-range transport of Asian air masses is identified as the dominant source of CO pollution over Eu-rope in the free troposphere.
1 Introduction
The distribution of ozone (O3)in the troposphere is affected
by downward transport from the stratosphere (e.g. Levy et al., 1985; Holton and Lelieveld, 1996; Marcy et al., 2004) and local photochemistry (e.g. Crutzen, 1995; Lelieveld and Dentener, 2000). For a budget calculation of tropospheric O3
at a given location, photochemical production and destruc-tion, as well as transport in and out of the region have to be considered. This can only be achieved by 3-dimensional chemical transport models (CTM) or global circulation mod-els (GCM), which need to be tested against observations from in-situ or remote sensing measurements (e.g. O’Connor
Correspondence to: H. Fischer
(hofi@mpch-mainz.mpg.de)
et al., 2004; von Kuhlmann et al., 2003a). Although global observations of tropospheric O3, carbon monoxide (CO) and
nitrogen dioxide (NO2), the latter being important O3
precur-sors, have recently become available from satellite-based ob-servations (Fishman et al., 1990; Borrell et al., 2003; Deeter et al., 2004; Buchwitz et al., 2004), the measurements are generally not vertically resolved and refer to cloud-free con-ditions only, which limits their representativeness. Addition-ally, satellite retrievals must be validated against indepen-dent remote sensing or in-situ data. Furthermore, regular O3
soundings are launched at various locations in the world (Lo-gan, 1999), but they lack information about O3precursors.
In general, detailed information about profiles of O3
and its precursors is thus only available from in-service and campaign-based aircraft measurements. The drawback of measurements from in-service aircraft, e.g. MOZAIC (Thouret et al., 1998), NOXAR (Brunner et al., 1998) and CARIBIC (Zahn et al., 2002) is, that trace gas profiles are often restricted to the vicinity of heavy-duty airports, and are thus not representative for the background atmosphere. On the other hand, campaign based data sets (for a recent compilation see: Emmons et al., 2000) usually provide lim-ited information about seasonal and spatial variations. Here we present data from a series of airborne measurement cam-paigns made within the SPURT (SPURenstofftransport in der Tropopausenregion; Trace gas transport in the tropopause region) project (Engel et al., 2006). The major goal of SPURT was to obtain insight into the distribution of vari-ous trace gases in the free troposphere and lowermost strato-sphere along the western border of Europe from the subtrop-ics to the Artic during different seasons. We present results of 8 measurement campaigns, during which up to 6 flights were performed on two consecutive days in the period be-tween November 2001 and July 2003. Here we focus on the
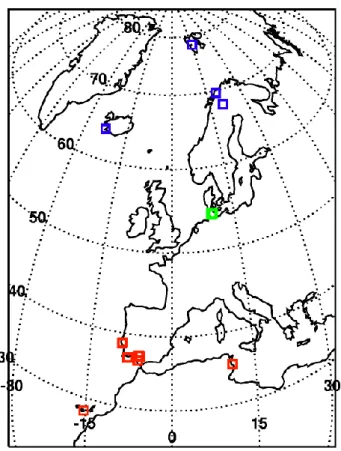
Fig. 1. Locations of the SPURT stop-over landings when profiles
were flown. Low-latitude locations in red, mid-latitude in green and high latitude in blue.
data obtained during take-off and landing and compare av-erage profiles of O3and CO for three latitude regimes and
different seasons with simulations from the CTM MATCH-MPIC (Model of Atmospheric Transport and Chemistry – Max Planck Institute for Chemistry version). In the tropo-sphere the distribution of both species is controlled by dy-namical and photochemical processes so that they are partic-ularly useful for the evaluation of chemistry transport mod-els.
In Sect. 2 the SPURT measurements are described, while Sect. 3 presents a description of the MATCH model. In Sect. 4, the seasonal and latitudinal variations of in-situ pro-files are compared to model results, while Sect. 5 addresses the origin of CO over Europe based on model simulations with tagged CO tracers. Finally, Sect. 6 summarizes the find-ings of our study.
2 Observations
A total of eight measurement campaigns covering all sea-sons were performed within SPURT between 10–11 Novem-ber 2001, 17–19 January 2002, 16–17 May 2002, 22–23 August 2002, 17–18 October 2002, 15–16 February 2003,
27–28 April 2003 and 9–10 July 2003. All campaigns were flown out of the aircraft’s homebase Hohn in northern Ger-many (54◦N, 9◦E). A typical campaign consisted of at least
two southbound flights within one day, followed by two or more northbound flights performed on the next day. Thus a series of flights covered the latitude range between approx-imately 35◦ and 75◦N along the western shore of Europe. During stop-over landings at generally smaller airports in the subtropics (Faro (Portugal, 37◦N, 8◦W); Casablanca (Mo-rocco, 33◦N, 7◦W); Gran Canaria (28◦N, 15◦W); Lisbon (Portugal, 38◦N, 9◦W); Jerez (Spain, 36◦N, 6◦W); Monas-tir (Tunisia, 35◦N, 10◦E); Sevilla (Spain, 37◦N, 5◦W)) and at high northern latitudes (Kiruna (Sweden, 68◦N, 20◦E); Troms¨o (Norway, 69◦N, 18◦E); Keflavik (Iceland, 64◦N, 22◦W); Longyearbyen (Norway, 78◦N, 15◦E)) two individ-ual profiles between ground-level and approximately 14 km altitude were obtained during landing and take-off (Fig. 1).
Amongst others in-situ measurements of CO and O3were
made on-board a Lear-Jet 35A (Engel et al., 2005; Hoor et al., 2004a). Carbon monoxide was measured by the MPI-C using Tunable Diode Laser Absorption Spectroscopy (TDLAS) (Kormann et al., 2002) with a time resolution of 1.3 s and a total uncertainty of less than 1.5%. De-tails of the CO measurements can be found in Hoor et al. (2004b). Ozone was measured independently by the FZ-J¨ulich using UV absorption (time resolution 9 s, total un-certainty 5%) and the ETH Z¨urich via NO chemilumines-cence (time resolution: 1 s; total uncertainty: 5%) (Heg-glin, 2004; Hegglin et al., 2005). A linear regression analysis showed that both measurements agree within their uncertainty bounds (O3(CLD)=1.069 O3(UV)+5.4 (ppbv),
R2=0.995; Hegglin, 2004). For the following analysis 5 s merged data sets have been calculated for each individ-ual flight by averaging (CO, O3(CLD)) and interpolation
(O3(UV)), respectively. From these merged data, mean
profiles at subtropical (<40◦N), mid- (approx. 54◦N) and high latitudes (>65◦N) have been calculated, grouped for the spring (March/April/May), summer (June/July/August), fall (September/October/November) and winter (Decem-ber/January/February) seasons and 1 km altitude bins (0– 1 km, 1–2 km, etc.).
3 Simulations
Average profiles for the different seasons and latitude bands were also deduced from model simulations, performed with the 3-D chemistry transport model MATCH-MPIC (Lawrence et al., 2003). The model is driven by meteorolog-ical data from the National Centre for Environmental Predic-tion (NCEP) Global Forecast System (GFS), and includes an extensive non-methane hydrocarbon oxidation mechanism described in detail by von Kuhlmann et al. (2003a). It is optimised for the troposphere and doesn’t include strato-spheric chemistry. Some compounds are adjusted or fixed
H. Fischer et al.: O3and CO distributions over Europe 341
in the stratosphere in order to provide boundary condi-tions to the troposphere. Values for H2O, O3, nitrogen
compounds and methane are tied to observations from the HALOE project (von Kuhlmann et al., 2003a). The model resolution is 2.8◦×2.8◦ in the horizontal and includes 42σ -levels in the vertical up to about 2 hPa. In addition to the extensive NMHC chemistry, the runs include regional CO tracers having the same emissions as the “standard” CO over a chosen region, subdivided into biomass burning and biofuel use, industrial and automotive sources, as well as other smaller sources like oceanic emissions, and undergo the same model transport and loss as standard CO. The emissions for CO and volatile organic compounds (VOC) from energy and industrial activities (except for biofuel use) were taken from the Emission Database for Global Atmo-spheric Research, EDGAR v2.0 for the VOCs (Olivier et al., 1996) and EDGAR v3.2 for CO and NOx (Olivier et
al., 2002). Biomass burning emissions (including biofuel use) were included by von Kuhlmann et al. (2003b) based on the climatological CO emission distribution of Galanter et al. (2000) and on the emission factors presented by An-dreae and Merlet (2001). Here we use only the CO trac-ers for Asia (0◦N–70◦N, 60◦E–180◦E), N-America (15◦N– 75◦N, 135◦W–45◦W) and Europe (35◦N–75◦N, 10◦W– 40◦E), further separating between bio-fuel and automotive sources. Photochemically produced CO is calculated as two separate tracers from the oxidation of CH4 and VOCs. To
separate stratospheric O3from O3produced photochemically
in the troposphere, an O3(strat) tracer is used in the model,
that marks ozone molecules of stratospheric origin, but un-dergoes the same chemistry and transport as total O3. The
model was run for the period June 2001 until February 2004. Individual profiles were obtained from the model at the lo-cations and times of the individual SPURT profiles obtained during take-off and landing. From these, average profiles and 1σ -standard deviations (in 1 km altitude bins) were calcu-lated.
4 Results
4.1 Seasonal and latitudinal variation of O3profiles
Average ozone profiles and 1σ -standard deviation for 1 km bins were calculated for low (<40◦N), mid (∼54◦N) and high (>65◦N) latitudes during the spring
(March/April/May), summer (June/July/August), fall (September/October/November) and winter (Decem-ber/January/February) seasons. These were obtained from at least 4 individual profiles per season and latitude band. In Fig. 2 observations are shown in red and MATCH model results in blue. Dashed blue curves indicate the modelled stratospheric contribution to O3. In general, observations
and simulations agree quite well within their combined 1σ -variability, with a few exceptions that will be discussed
in detail below. Both observations and model results exhibit slightly increasing O3 concentrations with altitude in the
troposphere and a strong increase near the tropopause. Stratospheric O3is highest in the winter and spring seasons
at high northern latitudes. This mirrors the seasonal and latitudinal variation of the tropopause height, which enables the aircraft to reach deeper into the stratosphere at high latitudes in winter and spring when the tropopause is lowest. Additionally, strong diabatic descent from the overworld fills the lowermost stratosphere with O3-rich air during late
winter/early spring (Hoor et al., 2004b, 2005; Hegglin et al., 2005). The model overestimates stratospheric O3 mixing
ratios at low latitudes during the spring and fall season (Figs. 2a and g) and underestimates it at high latitudes during spring and summer (Figs. 2c and f). This is most probably due to the coarse resolution of the model around the tropopause, which is about 30 hPa between 300 and 200 hPa, corresponding to an altitude resolution between 0.5 and 1 km. Thus slight differences in the tropopause height between actual observations and model predictions may lead to a vertical displacement between average modelled and observed profiles. In general, the model reproduces the observations quite well, with the exception of the summer profile at low latitudes (Fig. 2d), and the winter profiles in the mid- and upper troposphere (Figs. 2j–l). For summer conditions the model underestimates the O3concentration at
low latitudes by approximately 30% (the mean observed and modelled O3between 3 and 9 km altitudes are 81±14 ppbv
and 57±5 ppbv, respectively). Note that the MATCH model predicts that the stratospheric O3 contribution between 3
and 9 km is only 30% of the modelled tropospheric O3
concentration, the smallest value simulated for all profiles. This is no surprise, since the photochemical activity in the subtropics in summer is expected to be high, due to the generally cloud free conditions and high solar insolation over southern Europe (Lelieveld et al., 2002). Therefore, the discrepancy can be either due to an underestimation of transport of O3from the stratosphere (e.g. due to an
under-estimation of isentropic transport across the subtropical jet as suggested by Jing et al. (2005)), or an underestimation of the net O3production in the free troposphere by the model.
Too high O3 in the troposphere is modelled for the
win-ter profiles, in particular in the upper troposphere (Figs. 2j– l). Observed and modelled O3 mixing ratios at 8.5 km
are 51±14 ppbv, 48±5 ppbv, 71±26 ppbv and 99±31 ppbv, 116±28 ppbv, 118±27 ppbv for low, mid and high latitudes, respectively. Approximately 90% of the modelled O3 at
8.5 km is predicted to originate from the stratosphere. There-fore it seems that MATCH either predicts a tropopause that is too low, or overestimates the transport of stratospheric air across the tropopause.
The seasonal and latitudinal variation of tropospheric O3is
discussed in the following for the 5.5 km altitude bin, which is considered to be representative for the free troposphere, since it is neither influenced by small scale anomalies of
Fig. 2. Altitude profiles (mean and 1σ -standard deviation for 1 km altitude bins) of observed (red) and modelled (blue) O3. The model estimate of tropospheric O3originating in the stratosphere is shown by the blue dotted line.
H. Fischer et al.: O3and CO distributions over Europe 343
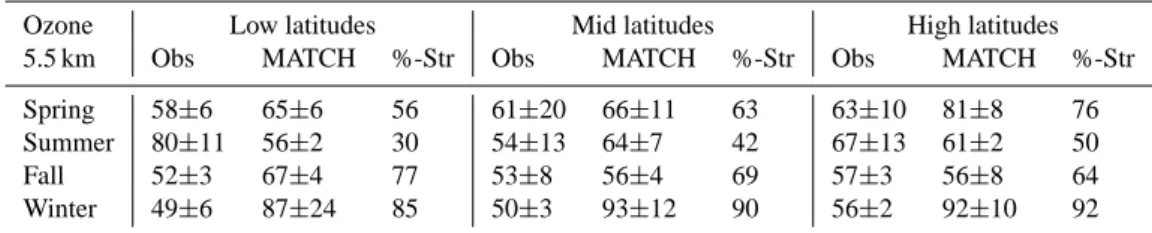
Table 1. Tropospheric ozone mixing ratios at 5.5 km altitude (Obs = observations; MATCH = model results; %-Str = stratospheric
contribu-tion).
Ozone Low latitudes Mid latitudes High latitudes
5.5 km Obs MATCH %-Str Obs MATCH %-Str Obs MATCH %-Str
Spring 58±6 65±6 56 61±20 66±11 63 63±10 81±8 76
Summer 80±11 56±2 30 54±13 64±7 42 67±13 61±2 50
Fall 52±3 67±4 77 53±8 56±4 69 57±3 56±8 64
Winter 49±6 87±24 85 50±3 93±12 90 56±2 92±10 92
the tropopause height nor by local emissions of O3
precur-sors that generally take place in the boundary layer. Ta-ble 1 lists the mean and 1σ -standard deviation of observa-tions and model results for the 5.5 km bin, at various sea-sons and latitudes. Additionally, the fractional contribution of stratospheric O3 is listed. In general, seasonal and
lat-itudinal variations of measured tropospheric O3, at least in
the middle troposphere, are remarkably small, varying be-tween approximately 50 and 60 ppbv, with the exception of the summer profiles at low latitudes. If one takes into ac-count that the solar irradiance – which drives photochemistry – strongly varies with season and latitude, the small varia-tion of tropospheric O3is rather remarkable. While the
high-est O3mixing ratios at low latitudes are observed during the
summer (80 ppbv), O3at mid and high latitudes peaks during
the spring season (61–63 ppbv). The lowest mixing ratios are observed in winter at all latitudes (49–56 ppbv). The smallest variability is also observed in the winter seasons, consistent with observations by Logan (1999). The observed seasonal variation is at odds with the MATCH model simulations, pre-dicting the highest concentrations in the winter (87–93 ppbv) due to strong O3import from the stratosphere. During the
winter stratospheric O3 contributes on average between 85
and 90% to tropospheric O3at 5.5 km. For the summer
sea-son MATCH underestimates the tropospheric O3
concentra-tion at low latitudes, when the stratospheric contribuconcentra-tion is modelled to be minimum, ranging between 30% at low lat-itudes and 50% at high latlat-itudes. As mentioned before, this indicates that the exchange between the stratosphere and the troposphere is most probably too strong in MATCH, in par-ticular for the winter, while net O3production at high solar
irradiance is underestimated.
A comparison between observations and model results for the boundary layer is not possible since O3observations are
often limited to altitudes above 2.5 km. Comparisons for the upper troposphere are difficult due to the averaging over dif-ferent tropopause altitudes and are thus not discussed in de-tail here.
4.2 Seasonal and latitudinal variations of CO profiles Figure 3 shows measured (black) and simulated (grey) CO profiles for the three latitude regimes during the four sea-sons. Additionally, CO tracers (coloured) are plotted to com-pare the contributions of photochemical CO production from CH4and VOCs (purple) with those of long range transport of
primary CO emissions from Europe (green), North-America (red) and Asia (blue) (see Sect. 5).
In general, CO measurements and MATCH model simula-tions agree best in the middle and upper troposphere between approximately 3 and 10 km. At lower altitudes in the bound-ary layer, MATCH tends to underestimate CO mixing ratios. This is most probably due to local pollution at the airports, since boundary layer measurements are restricted to take-off and landing at various airports. In the middle and upper troposphere, simulations and observations agree within their combined 1σ -variability, with the exception of the summer profiles at mid and high latitudes (Figs. 3e and f) for which the observed CO mixing ratios are significantly higher than the model predictions. We will discuss these differences in more detail in the next section.
Above the tropopause in the lowermost stratosphere MATCH significantly overestimates the CO concentration. This is in line with the previously discussed underestimation of O3 concentrations above the tropopause by MATCH
at-tributed to excessive bi-directional stratosphere-troposphere-exchange (see Sect. 4.1). One possible explanation may be linked to the interpolation of NCEP vertical wind data to the MATCH coordinates, being sensitive to relatively small er-rors (van Noije et al., 2004). Another potential reason is ex-cessive numerical diffusion. Similar findings were described by Brunner et al. (2003) in an evaluation of five global CTMs. For a discussion of the seasonal and latitudinal variation of CO we again concentrate on the 5.5 km bin, which is not directly influenced by local pollution or direct stratospheric impact. Table 2 shows the average and 1σ -standard deviation of observed and simulated CO mixing ratios between 5 and 6 km altitude as a function of latitude and season. Middle tropospheric CO mixing ratios generally increase with lati-tude, reflecting the longer photochemical lifetime associated with lower irradiance. This is in line with generally higher
Fig. 3. Altitude profiles (mean and 1σ -standard deviation for 1 km altitude bins) of observed (black) and modelled (grey) CO. CO tracers
are plotted to compare the contributions of photochemical CO production from CH4and VOCs (purple) with those by long-range transport of primary CO emissions (fossil fuel combustion and biomass burning) from Europe (green), North-America (red) and Asia (blue). Biomass burning contributions are plotted separately as coloured dashed lines.
H. Fischer et al.: O3and CO distributions over Europe 345
Table 2. Tropospheric CO mixing ratios at 5.5 km altitude (Obs = observations; MATCH = model results).
CO Low latitudes Mid latitudes High latitudes
5.5 km Obs MATCH Obs MATCH Obs MATCH
Spring 125±16 121±14 127±10 127±12 141±21 137±6
Summer 89±91 83±6 106±22 102±4 115±13 93±3
Fall 112±10 103±5 104±17 115±11 129±5 115±2
Winter 116±9 121±4 131±16 130±5 141±9 137±6
concentrations in winter/spring compared to summer. The latitudinal and seasonal variations deduced from the obser-vations are reproduced by the model. Mean mixing ratios, and even the variability represented by the 1σ -standard de-viations, are generally in excellent agreement, with the ex-ception of the summer season at high latitudes, as mentioned before.
5 Photochemical CO production versus long range transport
In Fig. 3 the simulated CO profile is separated into vari-ous sources. The main contribution at all altitudes comes from photochemical CO production via oxidation of CH4and
VOCs (purple line in Figs. 3a–l). This chemical background is of the order of 50 ppbv throughout the year and mainly due to the oxidation of CH4. Contributions by long range
transport of primary CO emissions (solid colour lines in Fig. 3 are total emissions from the combustion of fossil fuels and biomass burning, dashed lines represent biomass/biofuel burning only) from Europe, Asia, and North America indi-vidually are generally smaller than photochemical produc-tion. The largest contribution is attributed to Asian CO emis-sions (25 to 40 ppbv). This contribution is rather constant throughout the troposphere, with highest values in spring and lowest values in summer. Biofuel use and biomass burning constitute about 50% of the direct Asian CO emissions. Con-tributions by North American emissions are comparable to Asian sources in particular at altitudes below approximately 6 km, becoming less significant at higher altitudes. The sea-sonal variation is less pronounced than for the Asian emis-sions and the contribution by biomass burning and biofuel use is generally small (less than 10 ppbv). European emis-sions are only significant at low altitudes, in particular at mid-latitudes, and decrease strongly with height.
A quantitative budget analysis is again obtained for the 5.5 km altitude bin (Fig. 4). The contribution from photo-chemistry (purple) is smallest in the winter and spring sea-sons (33–35%) at high latitudes and highest (56%) in sum-mer at low latitudes. This is in line with the photochemical activity peaking at high solar irradiance in summer. Long-range transport of Asian emissions (blue) contributes 20– 25% to the CO budget at 5.5 km at all latitudes and seasons,
Fig. 4. CO budget calculated with MATCH at 5.5 km.
Photo-chemical CO production is shown in purple, long-range transport of primary CO emissions form Europe, Asia and North-America are shown in green, blue and red, respectively. Darker (hatched) areas mark contributions from biomass burning and biofuel use. “Other” summarises all other CO sources in the model.
with the contributions of biofuel/biomass burning and fossil fuel combustion being approximately equal. North Ameri-can emissions (red) account for 15–20% of the CO budget, with significant contributions from biomass burning only in the summer at high latitudes. European emissions (green) are highest during the summer at mid-latitudes (∼15%), and smallest at low latitudes during all seasons (<10%).
This source apportionment is in quantitative agreement with a recent study by Pfister et al. (2004) using CO measure-ments from MOPITT and MOZART-2 CTM simulations to analyse the CO budget over Europe, indicating the robustness of our understanding of these budgets, i.e. within the limits of uncertainty in current global chemistry transport models.
As mentioned in the previous section MATCH underesti-mates the CO concentration in the middle troposphere dur-ing summer, particularly at middle and high latitudes. Most probably this is due to an underestimation of the biomass burning source from boreal forests fires in North America (Canada and Alaska). Kasischke et al. (2005) have shown that CO emissions from boreal fires in the summers of 2001 to 2003 (the SPURT period) were much higher than the cli-matological mean used in the MATCH simulations. Thus it is likely that MATCH underestimates CO in particular at mid and high latitudes in summer, most strongly affected by CO emissions from boreal fires (Yurganov et al., 2005).
6 Conclusions
Regular measurement flights have been performed in the up-per troposphere and lower stratosphere along the western shores of Europe over a period of three years as part of the SPURT project. Stop-over landings at generally low-duty airports in low-, mid- and high-latitudes allow the study of seasonal and latitudinal variations of CO and O3profiles in
the background atmosphere over Europe. The seasonal and latitudinal variations of the observations are in good agree-ment with earlier publications discussing O3-sonde data
(Lo-gan, 1999) and satellite borne MOPITT CO data (Pfister et al., 2004). A comparison with simulations with the CTM MATCH indicates that the model tends to overestimate tro-pospheric O3in the winter season at all latitudes due to too
strong stratosphere-troposphere exchange, and to underesti-mate photochemical O3 production at high solar irradiance
in the summer season at low latitudes. MATCH predicts that at least 50% of the tropospheric O3at 5.5 km originates
in the stratosphere, with generally highest contributions in the winter season at high latitudes. The agreement between MATCH and observations for tropospheric CO is excellent, with the exception of high latitudes in the summer, when MATCH seems to underestimate the contribution of boreal forest fires to the CO budget. In agreement with the study by Pfister et al. (2004) the simulations indicate that approx-imately 50 ppbv of CO in the troposphere is due to photo-chemical production, mainly by the oxidation of CH4, and
to a lesser extent of VOCs, and that long-range transport of primary emissions from Asia is the most important CO pol-lution source over Europe.
Acknowledgements. We are indebted to the pilots and technicians at GFD, enviscope, MPIC, FZJ and ETH for their excellent coop-eration and support during the campaigns. Funding of the SPURT project under the AFO 2000 programme of the German Ministry for Education and Research (BMBF) is gratefully acknowledged. Edited by: W. T. Sturges
References
Andreae, M. O. and Merlet, P.: Emission of trace gases and aerosols from biomass burning, Global Biogeochem. Cycles, 15(4), 955– 966, 2001.
Borrell, P., Burrows, J. P., Richter, A., Platt, U., and Wagner, T.: New developments in satellite capabilities for probing the chem-istry of the troposphere, Atmos. Environ., 37, 2567–2570, 2003. Brunner, D., Staehelin, J., and Jeker, D.: Large-scale nitrogen ox-ide plumes in the tropopause region and implications for ozone, Science, 282, 1305–1309, 1998.
Brunner, D., Staehelin, J., Rogers, H. I., K¨ohler, M. O., Pyle, J. A., Hauglustaine, D., Jourdain, L., Berntsen, T. K., Gauss, M., Isak-sen, I. S. A., Meijer, E., van Velthoven, P., Pitari, G., Mancini, E., Grewe, V., and Sausen, R.: An evaluation of the performance of chemistry transport models by comparison with research aircraft observations. Part 1: Concepts and overall model performance, Atmos. Chem. Phys., 3, 1609–1631, 2003,
SRef-ID: 1680-7324/acp/2003-3-1609.
Buchwitz, M., de Beek, R., Bramstedt, K., No¨el, S., Bovensmann, H., and Burrows, J. P.: Global carbon monoxide retrieved from SCIAMACHY by WFM-DOAS, Atmos. Chem. Phys., 4, 1945– 1960, 2004,
SRef-ID: 1680-7324/acp/2004-4-1945.
Crutzen, P. J.: Ozone in the troposphere, in: Composition, Chem-istry and Climate of Atmosphere, edited by: Singh, H. B., Van Nostrand Reinhold, New York, pp. 349–393, 1995.
Deeter, M. N., Emmons, L. K., Edwards, D. P., Gille, J. C., and Drummond, J. R.: Vertical resolution and information content of CO profiles retrieved by MOPETT, Geophys. Res. Lett., 31, L15112, doi:10.1029/2004GL020235, 2004.
Emmons, L. K., Hauglustaine, D. A., M¨uller, J.-F., Carroll, M. A., Brasseur, G. P., Brunner, D., Staehelin, J., Thouret, V., and Marenco, A.: Data composites of airborne observations of tropo-spheric ozone and its precursors, J. Geophys. Res., 105, 20 497– 20 538, 2000.
Engel, A., B¨onisch, H., Brunner, D., Fischer, H., Gurk, C., Heg-glin, M., Hoor, P., K¨onigstedt, R., Krebsbach, M., Maser, R., Parchatka, U., Peter, Th., Schiller, C., Schmidt, U., Spelten, N., Szabo, T., Weers, U., Wernli, H., Wetter, Th., and Wirth, V.: Highly resolved observations of trace gases in the lowermost stratosphere and upper troposphere from the SPURT project: An overview, Atmos. Chem. Phys., 6, 283–301, 2006,
SRef-ID: 1680-7324/acp/2006-6-283.
Fishman, J., Watson, C. E., Larsen, J. C., and Logan, J. A.: Dis-tribution of tropospheric ozone determined from satellite data, J. Geophys. Res., 95, 3599–3617, 1990.
H. Fischer et al.: O3and CO distributions over Europe 347
Galanter, M., Levy, H., and Carmichael, G. R.: Impacts of biomass burning on tropopsheric CO, NOxand O3, J. Geophys. Res., 105, 6633–6653, 2000.
Hegglin, M. I.: Airborne NOy-, NO- and O3-measurements during SPURT: Implications for atmospheric transport, The-sis No. 15553, Swiss Federal Institute for Technology (ETH), Zurich, Switzerland, 2004.
Hegglin, M. I., Brunner, D., Wernli, H., Schwierz, C., Martius, O., Hoor, P., Fischer, H., Parchatka, U., Spelten, N., Schiller, C., Krebsbach, M., Parchatka, U., Weers, U., Staehelin, J., and Peter, Th.: Tracing troposphere-to-stratosphere transport above a mid-latitude deep convective system, Atmos. Chem. Phys., 4, 741– 756, 2004,
SRef-ID: 1680-7324/acp/2004-4-741.
Hegglin, M. I., Brunner, D., Peter, Th., Hoor, P., Fischer, H., Stae-helin, J., Krebsbach, M., Schiller, C., Parchatka, U., and Weers, U.: Measurements of NO, NOy, N2O, and O3during SPURT: implications for transport and chemistry in the lowermost strato-sphere, Atmos. Chem. Phys. Discuss., 5, 8649–8688, 2005,
SRef-ID: 1680-7375/acpd/2005-5-8649.
Holton, J. R. and Lelieveld, J.: Stratosphere-troposphere ex-change and its role in the budget of tropospheric ozone, in: Clouds, Chemistry and Climate, edited by: Crutzen, P. J. and Ramanathan, V., NATO ASI Series, Springer-Verlag, Berlin, pp. 173–190, 1996.
Hoor, P., B¨onisch, H., Brunner, D., Engel, A., Fischer, H., Gurk, C., G¨unther, G., Hegglin, M., Krebsbach, M., Maser, R., Peter, Th., Schiller, C., Schmidt, U., Spelten, N., Wernli, H., and Wirth, V.: New insights into upward transport across the extratropical tropopause derived from extensive in situ measurements during the SPURT project, SPARC Newsletter, 22, 29–31, 2004. Hoor, P., Gurk, C., Brunner, D., Hegglin, M. I., Wernli, H., and
Fischer, H.: Seasonality and extend of extratropical TST derived from in-situ CO measurements during SPURT, Atmos. Chem. Phys., 4, 1427–1442, 2004b,
SRef-ID: 1680-7324/acp/2004-4-1427.
Hoor, P., Fischer, H., and Lelieveld, J.: Tropical and extratrop-ical tropospheric air in the lowermost stratosphere over Eu-rope: A CO-based budget, Geophys. Res. Lett., 32, L07802, doi:10.1029/2004GL022018, 2005.
Jing, P., Cunnold, D. M., Yang, E.-S., and Wang, H.-J.: Influence of isentropic transport on seasonal ozone variations in the lower stratosphere and subtropical upper troposphere, J. Geophys. Res., 110, D10110, doi:10.1029/2004JD005416, 2005.
Kasischke, E. S., Hyer, E. J., Novelli, P. C., Bruhwiler, L. P., French, N. H. F., Sukhinin, A. I., Hewson, J. H., and Stocks, B. J.: In-fluences of boreal fire emissions on Northern Hemisphere atmo-spheric carbon and carbon monoxide, Global Biogeochem. Cy-cles, 19, GB1012, doi:10.1029/2004GB002300, 2005.
Kormann, R., Fischer, H., Gurk, C., Helleis, F., Kl¨upfel, Th., K¨onigstedt, R., Parchatka, U., and Wagner, V.: Application of TRISTAR, a three-laser tunable diode laser absorption spectrom-eter during MINATROC, Spectrochimica Acta, A58, 2489–2498, 2002.
Lawrence, M. G., Rasch, P. J., von Kuhlmann, R., Williams, J., Fis-cher, H., de Reus, M., Lelieveld, J., Crutzen, P. J., Schultz, M., Stier, P., Huntrieser, H., Heland, J., Stohl, A., Forster, C., Elbern, H., Jakobs, H., and Dickerson, R. R.: Global chemical weather forecasts for field campaign planning: Predictions and
observa-tions of large-scale features during MINOS, CONTRACE, and INDOEX, Atmos. Chem. Phys., 3, 267–289, 2003,
SRef-ID: 1680-7324/acp/2003-3-267.
Lelieveld, J. and Dentener, F. J.: What controls tropospheric ozone?, J. Geophys. Res., 105, 3531–3551, 2000.
Lelieveld, J., Berresheim, H., Borrmann, S., Crutzen, P. J., Den-tener, F. J., Fischer, H., de Gouw, J., Feichter, J., Flatau, P., He-land, J., Holzinger, R., Kormann, R., Lawrence, M., Levin, Z., Markowicz, K., Mihalopoulos, N., Minikin, A., Ramanathan, V., de Reus, M., Roelofs, G. J., Scheeren, H. A., Sciare, J., Schlager, H., Schultz, M., Siegmund, P., Steil, B., Stephanou, E., Stier, P., Traub, M., Williams, J., and Ziereis, H.: Global air pollu-tion crossroads over the Mediterranean, Science, 298, 794–799, 2002.
Levy II, H., Mahlman, J. D., and Moxim, W. J.: Tropospheric ozone: The role of transport, J. Geophys. Res., 90, 3753–3772, 1985.
Logan, J. A.: An analysis of ozonesonde data for the troposphere: Recommendations for testing 3d-models and development of a gridded climatology for tropospheric ozone, J. Geophys. Res., 104(D13), 16 115–16 150, doi:10.1029/1998JD100096, 1999. Marcy, T. P., Fahey, D. W., Gao, R. S., Popp, P. J., Richard, E. C.,
Thompson, T. L., Rosenlof, K. H., Ray, E. A., Salawitch, R. J., Atherton, C. S., Bergmann, D. J., Ridley, B. A., Weinheimer, A. J., Loewenstein, M., Weinstock, E. M., and Mahoney, M. J.: Quantifying stratospheric ozne in the upper troposphere with in situ measurements of HCl, Science, 304, 261–265, 2004. Noije, van T. P. c., Eskes, H. J., van Weele, M., and van Velthoven,
P. F. J.: Implications of the enhanced Brewer-Dobson circula-tion in European Centre for Medium-Range Weather Forecasts reanalysis ERA-40 for the stratosphere-tropsphere exchange of ozone in global chemistry transport models, J. Geophys. Res., 109, D19308, doi:10.1029/2004JD004586, 2004.
O’Conner, F. M., Law, K. S., Pyle, J. A., Barjat, H., Brough, N., Dewey, K., Green, T., Kent, J., and Phillips, G.: Tropospheric ozone budget: Regional and global calculations, Atmos. Chem. Phys. Discuss., 4, 991–1036, 2004,
SRef-ID: 1680-7375/acpd/2004-4-991.
Olivier, J. G. J., Bouwman, A. F., van de Maas, C. W. M., Berdowski, J. J. M., Veldt, C., Bloos, J. P. J., Visschedijk, A. J. H., Znadveld, P. Y. J., and Heverlag, J. L.: Description of EDGAR version 2.0: A set of emission inventories of greenhouse gases and ozone depleting substances for all anthropogenic and most natural sources on per country basis and on 1◦×1◦grid, Nat. Inst. Of Public Health and the Environ., Bilthoven, The Netherlands, 1996.
Olivier, J. G. J., Peters, J. A. H. W., Bakker, J., Berdowski, J. J. M., Visschedijk, A. J. H., and Bloos, J. P. J.: Applica-tions of EDGAR: Emission data base for atmospheric research, Rep. 410.200.051.RIVM, RIVM, Bilthoven, The Netherlands, 2002.
Pfister, G., Petron, G., Emmons, L. K., Gille, J. C., Edwards, D. P., Lamarque, J.-F., Attie, J.-L., Granier, C., and Nov-elli, P.C.: Evaluation of CO simulations and the analysis of the CO budget for Europe, J. Geophys. Res., 109, D19304, doi:10.1029/2004JD004691, 2004.
Thouret, V., Marenco, A., Nedelec, P., and Grouhel, C.: Ozone cli-matologies at 9–12 km altitude as seen by the MOZAIC airborne program between September 1994 and August 1996, J. Geophys.
Res. 103, 25 653–25 679, 1998.
von Kuhlmann, R., Lawrence, M. G., Crutzen, P. J., and Rasch, P. J.: A model for studies of tropospheric ozone and nonmethane hydrocarbons: Model description and ozone results, J. Geophys. Res., 108(D9), 4294, doi:10.1029/2002JD002893, 2003a. von Kuhlmann, R., Lawrence, M. G., Crutzen, P. J., and Rasch, P. J.:
A model for studies of tropospheric ozone and non-methane hy-drocarbons: Model evaluation of ozone related species, J. Geo-phys. Res., 108(D28), 4729, doi:10.1019/2002JD003348, 2003b. Yurganov, L. N., Duchatelet, P., Dzhola, A. V., Edwards, D. P., Hase, F., Kramer, I., Mahieu, E., Mellqvist, J., Notholt, J., Nov-elli, P. C., R¨ockmann, A., Scheel, H. E., Schneider, M., Schulz, A., Strandberg, A., Sussmann, R., Tanimoto, H., Velazco, V., Drummond, J. R., and Gille, J. C.: Increased Northern Hemi-spheric carbon monoxide burden in the troposphere in 2002 and 2003 detected from the ground and from space, Atmos. Chem. Phys., 5, 563–573, 2005,
SRef-ID: 1680-7324/acp/2005-5-563.
Zahn, A., Brenninkmeijer, C. A. M., Asman, W. A. H., Crutzen, P. J., Heinrich, G., Fischer, H., Cuijpers, J. W. M., and van Velthoven, P. F. J.: Budgets of O3and CO in the upper tropo-sphere: CARIBIC passenger aircraft results 1997–2001, J. Geo-phys. Res., 107(D17), 4337, doi:10.1029/2001JD001529, 2002.


![[PDF] Administration d'une BD cours pdf - Cours informatique](data:image/gif;base64,R0lGODlhAQABAIAAAP///wAAACH5BAEAAAAALAAAAAABAAEAAAICRAEAOw==)