HAL Id: hal-03241923
https://hal.sorbonne-universite.fr/hal-03241923
Submitted on 29 May 2021
HAL is a multi-disciplinary open access
archive for the deposit and dissemination of
sci-entific research documents, whether they are
pub-lished or not. The documents may come from
teaching and research institutions in France or
abroad, or from public or private research centers.
L’archive ouverte pluridisciplinaire HAL, est
destinée au dépôt et à la diffusion de documents
scientifiques de niveau recherche, publiés ou non,
émanant des établissements d’enseignement et de
recherche français ou étrangers, des laboratoires
publics ou privés.
Snios, R. Kraft, Z. Yao, A. Wibisono
To cite this version:
W. Dunn, J.-u. Ness, L. Lamy, G. Tremblay, G. Branduardi-raymont, et al.. A Low Signal Detection
of X-Rays From Uranus. Journal of Geophysical Research Space Physics, American Geophysical
Union/Wiley, 2021, 126 (4), �10.1029/2020ja028739�. �hal-03241923�
1. Introduction: X-Ray Emissions in the Solar System
X-ray emissions have been detected from comets, Venus, Earth, Mars, Saturn, Pluto, Jupiter, and several of Jupiter's moons (Branduardi-Raymont et al., 2013; Cravens, 1997, 2002; Dennerl, 2002; Dennerl et al., 2002; Lisse et al., 1996, 2001, 2017; Nulsen et al., 2020). For Mercury, which is too close to the Sun to be observed by the Earth-orbiting X-ray observatories, in-situ X-ray instruments have provided detailed maps of the planet's X-ray emissions (Nittler et al., 2011). Of the planets in the solar system, only the Ice Giants, Uranus and Neptune, still remain to be detected in the X-ray waveband. In this study, we will focus on the closer of these two bodies: Uranus.
Previous observations of Uranus in the 1990s with the Röntgensatellit (ROSAT) yielded non-detections sug-gesting that the X-ray flux from the planet must be less than 5.7 × 10⁻¹⁵ erg/cm2/s (Ness & Schmitt, 2000).
Since ROSAT, the launch of the Chandra and XMM-Newton X-ray observatories in 1999 provided ground-breaking new opportunities for planetary X-ray studies with unprecedented spatial and spectral resolution, respectively, and heightened sensitivity. While XMM-Newton is yet to observe Uranus, Chandra has conducted three exploratory relatively short-duration observations that provide the perfect opportunity to evaluate the fluxes beyond the limits of ROSAT.
The study of X-ray emissions from planets provide key and often unique insights into a variety of character-istics of the system. Most relevant for Uranus, these include: atmospheric, surface and planetary ring com-position through fluorescence (Adler et al., 1972; Bhardwaj, Elsner, et al., 2005; Dennerl et al., 2002, 2006; Elsner et al., 2002; Nittler et al., 2011; Nulsen et al., 2020) or scattering (Bhardwaj, Branduardi-Ray-mont, et al., 2005a; Branduardi-Raymont et al., 2007b; Cravens et al., 2006; Dunn, Branduardi-Raymont,
Abstract
Within the solar system, X-ray emissions have been detected from every planet except the Ice Giants: Uranus and Neptune. We analyze the three archival Chandra X-ray observations of Uranus (each 24–30 ks duration) to date: a stand-alone Advanced CCD Imaging Spectrometer (ACIS) observation on August 7, 2002 and two High Resolution Camera (HRC) observations on November 11 and 12, 2017 coordinated with optical observations. For the earlier ACIS observation, the Uranus-coincident photons were clustered in the 0.6–1.1 keV spectral range, consistent with emission from Jupiter and Saturn. To test the significance of the detected signal, we distributed a grid of ∼10,000 Uranus-sized regions across the field of view (FoV). The number of Uranus-coincident X-ray photons in the 0.5–1.2 keV range exceeded 99.9% of Uranus-sized regions across the FoV (10.2 standard deviations > FoV mean; probability of chance occurrence ∼10−6–10−7). However, the planetary signal was low with only 5 ± 2.2 X-ray photons againsta FoV mean background of 0.16 photons. Without the possibility of energy filtering, the recent HRC observations had a much brighter background (FoV mean ∼10 photons). Consequently, neither of the new observations provided a second unambiguous Uranus detection, although a 40-min interval of brightening on November 12, 2017 did produce a signal above 99.9% of the FoV. The observed Uranus X-ray fluxes of 10−15–10−16 erg/cm2/s are consistent with previous observational limits and modeling predictions.
These fluxes exceed expectations from scattered solar emission alone, suggesting either a larger X-ray albedo than Jupiter/Saturn or the possibility of additional X-ray production processes at Uranus. Further observations are needed to test this.
© 2021. The Authors.
This is an open access article under the terms of the Creative Commons Attribution License, which permits use, distribution and reproduction in any medium, provided the original work is properly cited.
B. Snios5 , R. P. Kraft5 , Z. Yao6 , and A. D. Wibisono1
1Mullard Space Science Laboratory, University College London, Dorking, UK, 2European Space Astronomy Centre, Madrid, Spain, 3LESIA, Observatoire de Paris, Université PSL, CNRS, Sorbonne Université, Université de Paris, Meudon, France, 4LAM, Pythéas, Aix Marseille Université, CNRS, CNES, Marseille, France, 5Harvard-Smithsonian Centre for Astrophysics, Smithsonian Astrophysical Observatory, Cambridge, MA, USA, 6Key Laboratory of Earth and Planetary Physics, Institute of Geology and Geophysics, Chinese Academy of Sciences, Beijing, China
Key Points:
• A Chandra ACIS observation reveals a 10.3 sigma detection of X-rays from Uranus with a probability of chance occurrence of 10−6–10−7
• Uranus' X-rays are concentrated between 0.6 and 1.1 keV, consistent with emission observed from Jupiter and Saturn
• The X-ray fluxes seem to exceed scattered solar emission alone, which may suggest X-ray aurora and/or X-ray fluorescence from the rings
Supporting Information: Supporting Information may be found in the online version of this article. Correspondence to:
W. R. Dunn,
w.dunn@ucl.ac.uk
Citation:
Dunn, W. R., Ness, J.-U., Lamy, L., Tremblay, G. R., Branduardi-Raymont, G., Snios, B., et al. (2021). A low signal detection of X-rays from Uranus. Journal of Geophysical Research: Space Physics, 126, e2020JA028739. https:// doi.org/10.1029/2020JA028739
Received 22 SEP 2020 Accepted 24 FEB 2021
et al., 2020); magnetosphere-ionosphere coupling through auroral studies (Dunn et al., 2017; Gladstone et al., 2002); and the nature of solar wind interactions through charge exchange emissions (Cravens, 1997; Lisse et al., 2001; Raab et al., 2016; Soman et al., 2018). For the hydrogen-dominated atmospheres of Ju-piter and Saturn, equatorial X-ray emission is predominately due to elastic-scattering of solar photons and therefore varies with the solar X-ray intensity (Bhardwaj, Elsner, et al., 2005; Bhardwaj et al., 2006; Brandu-ardi-Raymont et al., 2007b, 2010; Cravens et al., 2006; Dunn, Branduardi-Raymont, et al., 2020; Maurellis et al., 2000). For Venus and Mars, the higher relative abundances of larger molecules in the atmosphere result in higher contributions by X-ray fluorescence emissions, for example, lines from the CO2 rich at-mosphere (Dennerl et al., 2002, 2006). The relative abundance of CNO elements is higher in Uranus than Saturn (Atreya & Wong, 2005), which may lead it to be an intermediate between the elastic scattering dom-inated atmospheres of Jupiter and Saturn and the fluorescence domdom-inated atmospheres of Venus and Mars. Cravens et al. (2006) provided theoretical calculations of albedos for elastic backscatter and fluorescence giving a prediction of soft X-ray flux of Uranus of 1.3 × 10⁻¹⁶ erg cm−2 s−1, assuming solar maximum and
the albedo of Jupiter.
X-ray aurorae have also been observed from the poles of Earth and Jupiter (Bhardwaj et al., 2007; Dunn et al., 2017; Gladstone et al., 2002; Jackman et al., 2018; Kimura et al., 2016). Auroral emissions are known to brighten when interplanetary shocks in the solar wind collide with the magnetospheres of the bodies (Dunn, Gray, et al., 2020; Dunn et al., 2016; Weigt et al., 2020; Wibisono et al., 2020). Jupiter's X-ray aurora is thought to be predominately produced by the precipitation of particles from the volcanoes on its moon Io (Elsner et al., 2005; Houston et al., 2020; Hui et al., 2009, 2010; Ozak et al., 2013). However, there are also some less frequent observations that show indications of solar wind particles charge exchanging with the atmosphere (e.g., Dunn, Gray, et al., 2020). At Earth, the X-ray aurora is predominately produced by the precipitation of energetic magnetospheric electrons along the auroral oval, which generate bremsstrahlung emissions and fluorescence emissions from collisions with oxygen and nitrogen in the atmosphere (e.g., Bhardwaj et al., 2007). For the neutral and dusty coma of comets, charge exchange from the collision of solar wind ions is also a key contributor of X-ray emission (e.g., Cravens, 1997 and Lisse et al., 2001). At Earth, this charge exchange process also produces emissions along the magnetosheath and at the cusps (e.g., Carter et al., 2008, 2010, 2011). These emissions will be utilized by the SMILE spacecraft to explore the terrestrial magnetosphere's response to incident solar wind (Raab et al., 2016).
One of the many factors that makes Uranus an interesting target is the configuration of its magnetosphere. While the rotation and magnetic field axes of Earth, Jupiter, and Saturn are all oriented almost perpendic-ular to the ecliptic plane (and thus the direction of the solar wind), Uranus' rotation axis is nearly parallel to its orbital plane. Moreover, the axis of the magnetic field of Uranus is surprisingly far from being spin axis-aligned, so that, during the solstice conditions which prevailed during the Voyager 2 flyby in 1986, the solar wind was incident nearly perpendicularly to the magnetic axis (Russell & Luhmann, 1997). The mag-netic axis is not only tilted with respect to the rotational axis, it also does not pass through the center of the planet and is offset from the center by about a third of the planetary radius Ness et al. (1986). This produces a particularly variable magnetosphere with a complex relationship to the solar wind.
The global dynamics and interactions of a magnetosphere are often studied remotely through their auroral and radio emissions. UV and radio auroral emissions have been observed from Uranus on several previous occasions (for details see reviews by Desch et al., 1991; Farrell et al., 1991; Lamy, 2020). Most of the observa-tions of these emissions were conducted under solstice condiobserva-tions during the Voyager 2 flyby of Uranus in the 1980s, which revealed patchy, mainly nightside, UV aurorae clustered around both magnetic poles at the footprint of flux tubes mapping to the magnetotail. More recently, Hubble Space Telescope (HST) observing campaigns past equinox have revealed complex, time-variable auroral emissions from the Uranian dayside, radically different to those observed three decades earlier by Voyager 2 (Lamy et al., 2012, 2017). These have shown elongated spots in both hemispheres interpreted as polar cusp aurorae. Unambiguous auroral detections were obtained in 25% of observations taken with the Space Telescope Imaging Spectrograph (STIS) onboard HST, with these detections statistically more common when coincident with interplanetary shocks from the solar wind impacting Uranus. One radio component (narrowband bursty emissions) was also observed to vary with solar wind density (Desch et al., 1989). Ground-based near infrared observations
have further revealed emissions from H3+ across the disk of the planet, with some observations suggesting
the possibility of a connection to auroral processes (Lam et al., 1997; Melin et al., 2011, 2019).
2. Chandra X-Ray Observations of Uranus
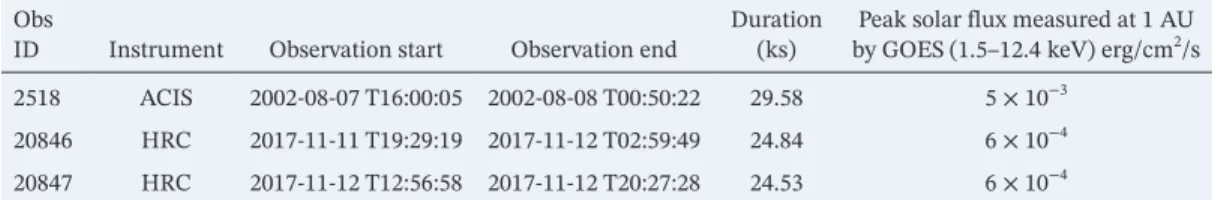
As of June 2020, Uranus had been observed with the Chandra X-ray Observatory three times (Table 1). The first observation (August 7, 2002) used the Advanced CCD Imaging Spectrometer (ACIS) instrument, which provides both spatial and spectral resolution. The ACIS-S instrument on Chandra offers good temporal (each exposure is 3.2 s long with a 42-ms readout time) and spatial resolution (0.5″ Point Spread Function Full Width Half Maximum [PSF FWHM] and 0.5″ pixel size) and provides moderate spectral resolution (E/ ΔE of 10–50). Its energy range is particularly useful for planetary emissions, which are predominately below 1.2 keV (e.g., Branduardi-Raymont et al., 2004; 2007a). Since 2011, a contaminant build-up on the ACIS optical blocking filter has significantly reduced the viability of the instrument for planetary observations, preventing the detection of much of the emission below 1.2 keV, where the majority of the scattered solar emission, charge exchange emission and K-shell fluorescence lines from, for example, carbon, nitrogen, and oxygen occurs, unfortunately meaning that the archival ACIS observation is currently unrepeatable. The observations in 2017 were, therefore, conducted with Chandra's High Resolution Camera's (HRC) im-aging capabilities. The HRC-I is sensitive to softer X-ray emissions (down to 0.06 keV) than ACIS, enabling it to collect more photons in the 0.1–1.2 keV energy range most important for planetary studies. It also offers an improvement in pixel size (0.4″ pixel size). However, HRC offers essentially no energy resolution. The HRC-I and ACIS-S instruments have fields of view of 30′ × 30′ and 8.3′ × 8.3′ (for chip S3), respectively, which extend far beyond the angular size of Uranus (3.7″ angular diameter for the observations presented here).
The ACIS observations were taken through the guest observer program. The HRC observations were award-ed as Director Discretionary Time, as part of a coordinataward-ed multi-spectral observing campaign aimaward-ed at tracking the arrival of powerful interplanetary shocks at the planet including UV (HST) and IR (Very Large Telecope [VLT] and Gemini) observations (Lamy et al., 2018), in line with successful HST detection strate-gies (Lamy et al., 2012, 2017). The observations in 2002 occurred during solar maximum, while those from 2017 occurred near solar minimum. X-ray fluxes from the Sun are shown in Table 1, while plots from the GOES spacecraft are in the supporting information. Given the differences between the instrument capabil-ities (particularly energy filtering), we treat the analysis of the ACIS observation and the HRC observations in turn.
3. Analysis of Chandra ACIS Observation on August 7, 2002
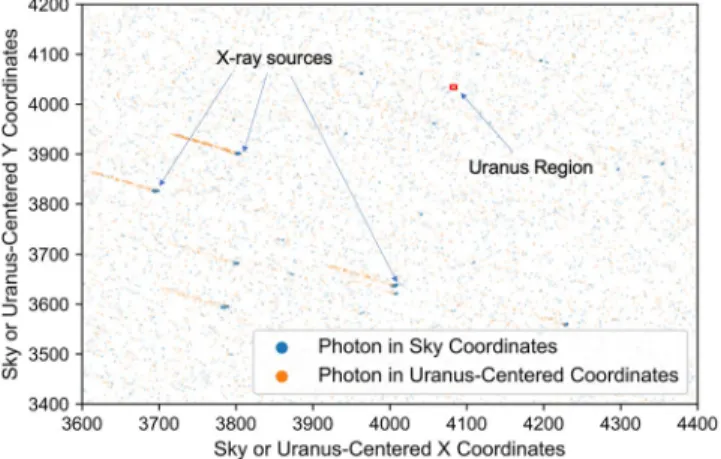
Figure 1 shows the majority of the field of view (FoV) for Chandra ACIS-S Chip-S3 (CCD-ID 7) during the Uranus observation in comparison with the size of the planet (red square) in the planet's rest-frame. The figure overlays the sky x–y coordinates (blue) on the detector with reframed coordinates centered on Uranus (orange). Due to the motion of Uranus across the detector during the observation, bright stationary X-ray sources in sky X–Y coordinates become streaks of emission in the Uranus-centered frame (arrows highlight examples). Given that none of these bright known sources overlapped Uranus' position during the
Obs
ID Instrument Observation start Observation end Duration (ks) by GOES (1.5–12.4 keV) erg/cmPeak solar flux measured at 1 AU 2/s
2518 ACIS 2002-08-07 T16:00:05 2002-08-08 T00:50:22 29.58 5 × 10⁻³
20846 HRC 2017-11-11 T19:29:19 2017-11-12 T02:59:49 24.84 6 × 10⁻⁴
20847 HRC 2017-11-12 T12:56:58 2017-11-12 T20:27:28 24.53 6 × 10⁻⁴
The solar fluxes quoted come from the GOES-10 (2002) and GOES-13 (2017) measurements in the 0.1–0.8 nm (1.5– 12.4 keV) band (see supporting information). For all three observations, the Uranus-Chandra distance was 19 AU. Abbreviations: ACIS, Advanced CCD Imaging Spectrometer; HRC, High Resolution Camera.
Table 1
observation, we chose not to remove the sources, rather than potentially artificially reduce the X-ray emission across the FoV. This leaves the back-ground overestimated. We filtered the ACIS observation to include only photons with energies between 500 and 1,200 eV. As discussed above, this is the energy range in which the majority of the scattered solar emission, charge exchange emission and K-shell fluorescence lines from, for exam-ple, carbon, nitrogen, and oxygen is observed. It is consequently the ener-gy range for which the majority of Saturn and Jupiter's X-ray emission is observed by ACIS. Beyond 1,200 eV, the signal-to-noise ratio for planetary signals worsens, with the main X-ray contributions predominately from bremsstrahlung emissions or scattering from the more energetic compo-nents of the solar emission.
To test the number of photons on the region occupied by Uranus against those present on the entire FoV, we placed a grid of boxes across the de-tector, where each box occupied 2 × 2 RU, where 1 RU = 1 Uranus
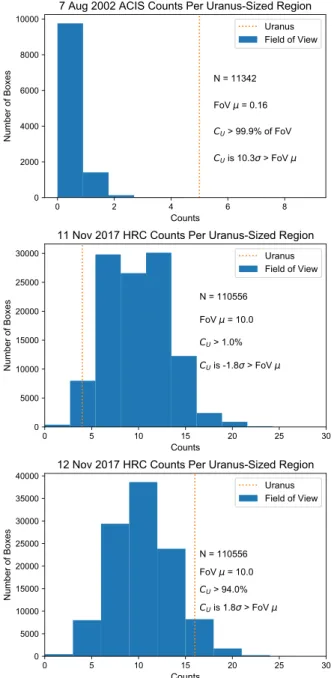
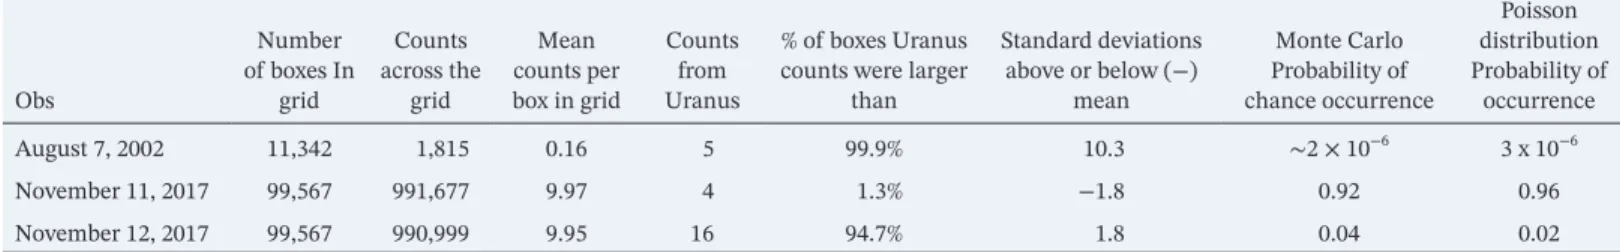
radi-us = 1.85″. This provided a grid with over 10,000 Uranus-sized regions. In each region, the number of photons detected by ACIS was counted. Figure 2 (top) shows a small fraction of this grid, zoomed-in to the re-gion on the detector occupied by Uranus (Uranus' location is shown with the red circle). This shows that 5 X-ray photons were coincident with the location of Uranus during the observation. Figure 3 (top) shows the dis-tribution of photons detected within boxes across the FoV. Text on the plot shows the total number of boxes included in the grid (11,342) and the mean number of photons from those boxes (0.16). The detection of 5 photons from the Uranus-located region is greater than 99.9% of the boxes across the detector (including other X-ray sources) and 10.3 standard deviations above the mean of the regions across the FoV. Table 2 summarizes these values with the HRC observations.
In order to test the probability that 5 photons could occur in the location of Uranus by chance, we applied a Monte Carlo approach of randomly simulating the emission across the FoV. To do this, we took the total number of photons detected during the observation and we randomly placed these photons onto different pixels on the detector. We produced 1,000,000 simulated random observations. In only 2 of these million randomly generated fields of view were 5 or more photons randomly produced at the location of Uranus. This low probability of chance occurrence is also consistent with fitting a Poisson distribution to the distri-bution in Figure 3 (top), which also produced a probability that 5 or more photons would randomly occur 3 or less times in 1,000,000 observations.
Figure 4a shows the distribution in energy of the Uranus-coincident photons, confirming that the concen-tration of photons is similar to what would be expected for a Saturn or Jupiter-like X-ray emission, from charge exchange or scattering of solar photons.
4. Analysis of Chandra HRC Observations on November 11 and 12, 2017
For the HRC observations, we took a Pulse Height Amplitude (PHA) range of 1–90, which removed ∼25% of the background signal, but less than 10% of the Uranus-coincident signal. Higher PHA values than 90 are often associated with particle impacts on the detector rather than X-ray photon observations. However, without being able to filter on energy, as was done for the ACIS observations, the Chandra HRC observa-tions still had a much higher background than the ACIS observaobserva-tions. There is a clear difference in the background as shown in both Table 2 and by comparing the panels in Figure 2. Attempts to reduce this background using a new “Hyperscreen” technique are detailed in the supporting information.
The number of Uranus-located photons for both HRC observations are within 2 standard deviations of the mean of the distribution for both observations. The November 11, 2017 observation (Figure 2 middle panel), shows a very low number of events from Uranus (4 counts), which is less than or equal to 98.7% of the boxes
Figure 1. Field Observed by ACIS Chip-S3 on August 7, 2002. In blue are X-ray Photons in sky coordinates on the detector for the observation. In orange are X-ray photons re-projected into Uranus-centered coordinates. X-ray sources that show as concentrated collections of blue dots for sky coordinates become orange streaks when re-projected, due to the inverse of Uranus' motion across the detector during the observation. The red box is a 2 × 2 RU (1 RU = 1 Uranus radius) region placed on Uranus (in
Uranus-centered coordinates) for the observation, showing for scale the field of view compared with the planet's size and location. The x–y units are Chandra pixels in the sky plane or Uranus-Centered coordinate frame. ACIS, Advanced CCD Imaging Spectrometer.
and is 1.8 standard deviations below the mean (Figure 3 middle panel). The November 12, 2017 observation (Figure 2 lower panel) has 16 pho-tons from the Uranus region meaning it has more phopho-tons than 95% of the distribution and is 1.8 standard deviations above the mean (Figure 3 lower panel). The probability of chance occurrence for so many photons to be coincident with Uranus is ∼2% (see Table 2). This constitutes a 3.6 standard deviation change in counts between the two observations. A similar 12-count increase between the two observations was observed in less than 0.5% of boxes on the detector. We also note that the Uranus-co-incident photons on November 12, 2017 are not uniform in time (Fig-ure 4b), unlike the distribution across the detector. Filtering on time to 17:10–18:10 results in a 6-photon Uranus signal that is higher than 99.9% of boxes (mean of 0.52) across the detector and 7.6 sigma above the FoV mean. Although, we note that, unlike the energy range filtering for the ACIS observation, there is not yet a clear underlying physical reason to filter the data for this brightening.
5. Comparison of Flux Measurements
To calculate the counts from Uranus alone, we subtracted the mean of the FoV distribution from the total number of photons on Uranus. For the ACIS observations, we calculated fluxes by using the energies of the detected photons in the range 500–1,200 eV. For the November 12, 2017 HRC observation we assumed the median photon energy from the ACIS observations (0.743 keV). We took the total energy combined from the photons and divided this by the observation time and instrument effec-tive area at the median photon energy. We validated these calculated flux-es against the NASA HEASARC Tool ( https://heasarc.gsfc.nasa.gov/cgi-bin/Tools/w3pimms/w3pimms.pl) with an astrophysical thermal plasma emission code (APEC) model (Smith et al., 2001). To identify a suitable temperature for the APEC model, we fitted spectra from Jupiter's equator during comparable intervals of solar activity and solar X-ray irradiance, as measured by the GOES spacecraft (see the supporting information for details). This provided APEC models with temperatures of 0.3 keV for the August 2002 ACIS observation and 0.19 keV for the November 2017 ob-servation. Fluxes retrieved from both methods are shown in Table 3. We also note that converting the count-rate from the 5-photon ACIS obser-vation should lead to a Chandra HRC detected photon count of between 13 and 18 photons (depending on the energy range and chosen model), in good agreement with the November 12, 2017 observation but in poor agreement with the November 11, 2017 observation.
For Uranus, Ness and Schmitt (2000) calculated a 95% confidence up-per limit of 5.7 × 10⁻¹⁵ erg/cm2/s, while Cravens et al. (2006) used
mod-els for atmospheric scattering to calculate an emission from Uranus of 1.3 × 10⁻¹⁶ erg/cm2/s. The fluxes measured for both the ACIS and
Novem-ber 12, 2017 HRC observations fall between the Ness and Schmitt (2000) limits and Cravens et al. (2006) predictions.
To determine how much of the observed flux is the result of scattered so-lar emission, we took soso-lar X-ray fluxes measured by the GOES Soft X-ray Imager at 1 AU (see supporting information) and propagated these back to the Sun. Using the PIMMS tool, we converted from the GOES energy band of 1.55–12.4 keV to the Chandra ACIS (HRC) band of 0.5–1.2 keV (0.2–10 keV). We do this assuming an APEC model with a solar
abun-Figure 2. Uranus-centered x and y coordinates for the Chandra ACIS observation on August 7, 2002 (top) and the HRC observation on November 11 (middle) and 12 (bottom), 2017. Red lines indicate the division of the detector into a grid of boxes of size 2 × 2 Uranus Radii. The red circle indicates the region occupied by Uranus on the detector. Each detected X-ray photon is indicated by a blue dot. The x–y units are Chandra pixels in the sky plane or Uranus-Centered coordinate frame. ACIS, Advanced CCD Imaging Spectrometer.
dance and the temperatures of 0.3 and 0.19 keV for the ACIS and HRC observation respectively (see supporting information for details). The resulting fluxes were then propagated to Uranus. The X-ray albedo for Jupiter and Saturn are between 0.001 and 0.01 for photons with energy of 0.5–1.0 keV (Cravens et al., 2006), we therefore applied these as lower and upper albedo limits for the X-ray emission reflected from Uranus. For the August 2002 ACIS observation, this gives an upper (lower) detect-ed flux of 4 × 10⁻¹⁶ (10−17) erg/cm2/s, while for the November 2017 HRC
observation, this gives a detected upper (lower) flux of between 2 × 10⁻¹⁶
(10−17) erg/cm2/s. We note that this value is sensitive to the chosen
tem-perature of the APEC model. A lower temtem-perature model shifts the ma-jority of the emission to lower energies, meaning that the GOES fluxes are measurements of a higher energy tail of the distribution. This means that an under-estimated plasma temperature leads to an over-estimated flux, while an over-estimated temperature leads to an under-estimated flux. We also note that the flux from the GOES data above 1.5 keV is fit-ting the high energy tail of a solar APEC model. The majority of the emis-sion from a solar APEC model is below 1.35 keV.
Because it is particularly challenging to gauge the uncertainties on this es-timation, for the calculations above, we deliberately chose a temperature of 0.3 keV to represent the lower end of possible temperatures for solar maximum and therefore the highest physically consistent fluxes that the propagation could produce. During solar maximum, it is likely that the APEC model solar temperature would have been higher (Dunn, Brandu-ardi-Raymont, et al., 2020), in which case the scattered solar fluxes from a propagation of the GOES observations diminishes (e.g., a solar APEC temperature of 0.4 keV produces an observed flux of scattered solar emis-sion of 1 × 10⁻¹⁶ (10−17) erg/cm2/s). This happens as the center of the solar
spectrum shifts toward the GOES energy range. Conversely, it is possible to reproduce the observed fluxes through solely solar scattered emission if the Solar APEC model uses a temperature that was infeasibly cool for the August 2002 observation. A solar APEC temperature of 0.19 keV dur-ing solar maximum, means that the GOES measurement represented the wings of the distribution and that the scattered solar flux from Uranus between 0.5 and 1.2 keV would be a larger 2.6 × 10⁻¹⁵ (10−16) erg/cm2/s.
While this temperature is improbably low, this serves to caution over-in-terpretation of these low-signal results and further demonstrates the lim-itations of these observations. To better understand the extent to which the observed emissions are produced by scattered solar emission and/or other processes will require further observations with longer exposure times, and ideally with spectral resolution in order to model the spectrum from Uranus and truly test the possible origins of the emission.
Comparing the observed fluxes to the fluxes expected from scattering of solar emission alone, using the estimations above, suggests two possibil-ities either (1) the X-ray albedo of Uranus may be markedly higher than for Saturn or Jupiter, which could be the case, for example, additional fluorescence emissions (as discussed in Section 1) or (2) that scattering of solar emission alone is unable to account for all of the observed X-ray emissions and thus that additional X-ray production mechanisms are at work.
Figure 3. Histogram distribution of counts from each box on the grid relative to the number of counts from the box containing Uranus (orange dashed line) for the Chandra ACIS observation on August 7, 2002 (top) and the HRC observation on November 11 (middle) and 12 (bottom), 2017. Shown in text are the number of 2 × 2 Uranus radius boxes (N) across the detector, the field of view mean from those boxes (FoV μ), the percentage of those boxes that the number of counts from Uranus (CU) was larger/
smaller than and how many standard deviations (σ) CU was greater/less
than the FoV μ. ACIS, Advanced CCD Imaging Spectrometer; CU, counts
6. Discussion and Conclusion on Expected Sources of X-Ray Emissions
The ACIS observation shows a statistically significant detection of X-rays from Uranus. Table 3 further suggests that the ACIS-S observation may require a mechanism beyond scattered solar emission alone, in order to explain the detected X-ray fluxes. However, we remain cautious on this, noting that the Poisson
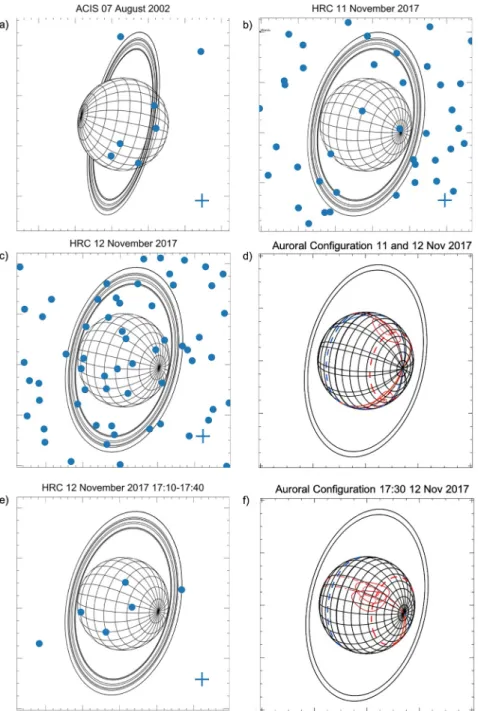
er-rors on the counts could be almost half the detected counts, which would bring the observations more in line with expectations from scattered solar emission alone. We also note the unavoidable challenges of comparing GOES observations in one energy band with Chandra observations in a different energy band. Further observations are required to test whether this excess is simply a fluctuation in Poisson statistics. While the HRC observations formally constitute a non-detection, there are sufficient ten-tative hints to justify a brief speculation on a physical explanation for the observed 4 sigma count variations between observations and for the interval in which the planet brightens to greater than 99.9% of the FoV. Figure 5 presents the locations of the X-ray photons in comparison with a graticule of the planet's orientation for each observation. For the ACIS observation, this may suggest one possible source of a heightened X-ray albedo could be the rings of the planet. At Saturn, the rings are known to produce X-ray fluorescence (Bhardwaj, Elsner, et al., 2005), and a sim-ilar process may be possible for Uranus. In fact, studies of the radiation belts by Mauk and Fox (2010) show that Uranus has a higher intensity of ∼100 keV electrons than Jupiter or Saturn and that the Uranian intensi-ties of MeV electrons are almost identical to those of Jupiter. Collisions by particles with these energies are well-suited to generating fluorescence emissions that can characterize the composition of the rings and possi-bly the surfaces of the satellites, although more detailed examinations of scattering and fluorescence cross-sections and further and longer X-ray observations would be required to explore this. We also note that the 2 photons located at high latitudes would be consistent with the latitudes associated with auroral emission.
The two HRC observations were organized to coincide with the predict-ed arrival of a solar wind shock at Uranus. The multi-instrument cam-paign included (alongside Chandra) HST, VLT, and Gemini observations (Lamy et al., 2018). The November 11, 2017 Chandra HRC observation occurred shortly after a HST observation and coincident with a VLT observation from this campaign. The HST/STIS waveband FUV image showed a bright auroral spot in the southern hemisphere, which could be fitted fairly well with a model of an auroral oval hence providing a
Obs Number of boxes In grid Counts across the grid Mean counts per box in grid Counts from Uranus % of boxes Uranus counts were larger
than Standard deviations above or below (−) mean Monte Carlo Probability of chance occurrence Poisson distribution Probability of occurrence August 7, 2002 11,342 1,815 0.16 5 99.9% 10.3 ∼2 × 10⁻⁶ 3 x 10⁻⁶ November 11, 2017 99,567 991,677 9.97 4 1.3% −1.8 0.92 0.96 November 12, 2017 99,567 990,999 9.95 16 94.7% 1.8 0.04 0.02
The Monte Carlo and Poisson Distributions show the probability that at least the number of photons occurring in the location of Uranus would be generated randomly, for each observation.
Table 2
Uranus Counts Compared With Number of Photons From a Grid of Uranus-Sized Boxes Across the Detector and Resulting Distributions Shown in Figures 2, 4
and 5
Figure 4. (a) Energy Distribution of Uranus photons compared with the energy distribution of photons across the field of view for the Chandra ACIS observation on August 7, 2002. (b) Time Distribution of Uranus photons compared with the time distribution of photons across the field of view for the Chandra HRC observation on November 12, 2017. ACIS, Advanced CCD Imaging Spectrometer; HRC, High Resolution Camera.
Figure 5. (a), (b), and (c) show illustrative graticules of Uranus overlaid with the X-ray photon locations (blue dots) detected by Chandra for each respective observation and (e) for an interval of brightening within the observation on November 12, 2017. The blue cross indicates the spatial resolution of Chandra. (d) shows the start and end auroral location for both HRC observations. This is propagated from the auroral detections of the November 2017 Hubble Space Telescope observing campaign (Lamy et al., 2018). (f) shows the predicted auroral location for the interval shown in (e). The axes are in right ascension and declination for a given instance in the observation. Large X (Y) axis increments are 0.1 (2) seconds right ascension (declination). We note that Uranus moves across the sky during the observation so that the precise right ascension and declination are not included on the axis to remove confusion. The sub-observer and sub-solar point are within one degree of each other (approximately normal to the plane of the page), so that the planet orientation is very similar for both. Graticules were initially produced from: https://pds-rings.seti.org/tools/viewer2_ ura.html. HRC, High Resolution Camera.
reference position of both magnetic poles for coordinated observations. The VLT/NACO wideband NIR image (acquired with adaptive optics) only revealed the rings (likely their thermal emissions) and a hint of the limb (H3+ disc emission of non-auroral nature). This context indicates that dayside auroral
precipita-tions occurred one rotation period before the first HRC observation, so that the non-detection in the X-ray waveband on November 11, 2017 may be explained by limitations in sensitivity and/or time variable auroral activity with weak or absent particle precipitations.
In contrast with the November 11th, on the November 12th the Uranus region was four times (and 3.6 standard deviations) brighter. If physical, the increased fluxes from the HRC observation also exceed the expectations for scattered solar emission. The GOES data (Table 1 and supporting information) shows very little difference between the two HRC observations, showing that changing solar X-ray irradiance (e.g., a so-lar fso-lare) is not responsible for the change. This may also be indicative of additional X-ray emission process-es at Uranus. Lamy et al. (2017) showed that the majority of auroral detections coincide with increases in solar wind pressure. Solar wind shocks are known to cause impulsive brightening of Jupiter's X-ray aurora (Dunn et al., 2016; Dunn, Gray, et al., 2020b). Figure 5 compares the location of the X-ray photons with the location of the auroral ovals and shows X-ray photons coincident with the auroral oval location. However, we note the very low count statistics and that additional observations covering several complete rotations of Uranus would be required to test whether the X-ray fluxes varied in phase with the aurora rotating in and out of view.
In the near term, X-ray emissions like those observed here for the ACIS-S observation would produce 4–7 × 10⁻³ counts per second for XMM-Newton's EPIC-pn instrument, suggesting that an observation
last-ing a few XMM-Newton orbits would be needed to provide a Uranus X-ray spectrum that could be modeled. This would enable a deeper characterization of the spectrum from Uranus, to explore, for example, the pres-ence of fluorescpres-ence line emissions from the rings. Further, and longer, observations with Chandra would help to produce a map of X-ray emission across Uranus and to identify, with better signal-to-noise, the source locations for the X-rays, constraining possible contributions from the rings and aurora. Such longer timescale observations would also permit exploration of whether the emissions vary in phase with rotation, potentially suggestive of auroral emissions rotating in and out of view. However, the current generation of X-ray observatories does not provide sufficient sensitivity to spectrally characterize the short interval tem-poral fluctuation observed in the November 12, 2017 observation. For this, the step-changes in effective area provided by ESA's ATHENA OBSERVATORY or NASA's nominal Lynx mission would be required.
Data Availability Statement
The Uranus X-ray observations presented here are publicly available on the Chandra archive (https://cda.harvard.edu/chaser/).
Observation ACIS August 7, 2002 HRC November 12, 2017
Counts with Poisson Errors 4.8 ± 2.2 6.0 ± 2.5
Counts/s 1.6 ± 0.7 × 10⁻⁴ 2.4 ± 1 × 10⁻⁴
Flux from observation (assuming the ACIS median energy for HRC) (erg/cm2/s) 5.7 ± 2.4 × 10⁻¹⁶ 1.5 ± 0.7 × 10⁻¹⁵
Flux from observations using PIMMS with an APEC model (erg/cm2/s) 4 ± 1.7 × 10⁻¹⁵ (0.5–1.2 keV) 2.3 ± 1 × 10⁻¹⁵ (0.2–10 keV)
Scattered solar flux from Uranus given an albedo of 0.01 (erg/cm2/s) 4 × 10⁻¹⁶ 2 × 10⁻¹⁶
Scattered solar flux from Uranus given an albedo of 0.001 (erg/cm2/s) 4 × 10⁻¹⁷ 2 × 10⁻¹⁷
These are compared with a scattered solar emission from Uranus assuming the upper (0.01) and lower (0.001) limits of Jupiter and Saturn's X-ray albedo (Cravens et al., 2006).
Abbreviations: ACIS, Advanced CCD Imaging Spectrometer; APEC, astrophysical thermal plasma emission code; HRC, High Resolution Camera. Table 3
Field of View Mean-Subtracted Counts From Uranus, Converted to Count Rates and Fluxes, Through an Assumed Photon Energy for HRC From the ACIS Observations, and Through the PIMMs Tool With an APEC Model
References
Adler, I., Trombka, J., Gerard, J., Lowman, P., Schmadebeck, R., Blodget, H., et al. (1972). Apollo 15 geochemical X-ray fluorescence exper-iment: Preliminary report. Science, 175(4020), 436–440. https://doi.org/10.1126/science.175.4020.436
Atreya, S. K., & Wong, A.-S. (2005). Clouds of Neptune and Uranus.
Bhardwaj, A., Branduardi-Raymont, G., Elsner, R. F., Gladstone, G. R., Ramsay, G., Rodriguez, P., et al. (2005). Solar control on Jupi-ter's equatorial X-ray emissions: 26–29 November 2003 XMM-Newton observation. Geophysical Research Letters, 32(3). https://doi. org/10.1029/2004gl021497
Bhardwaj, A., Elsner, R. F., Gladstone, G. R., Waite, J. H., Branduardi-Raymont, G., Cravens, T. E., & Ford, P. G. (2006). Low-to middle-lat-itude X-ray emission from Jupiter. Journal of Geophysical Research, 111(A11), https://doi.org/10.1029/2006JA011792
Bhardwaj, A., Elsner, R. F., Waite, J. H., Jr., Gladstone, G. R., Cravens, T. E., & Ford, P. G. (2005). The discovery of oxygen Kα X-ray emission from the rings of Saturn. Acta Pathologica Japonica, 627(1), L73–L76. https://doi.org/10.1086/431933
Bhardwaj, A., Randall Gladstone, G., Elsner, R. F., Østgaard, N., Hunter Waite, J., Jr., Cravens, T. E., et al. (2007). First terrestrial soft X-ray auroral observation by the Chandra X-ray Observatory. Journal of Atmospheric and Solar-Terrestrial Physics, 69(1–2), 179–187. https:// doi.org/10.1016/j.jastp.2006.07.011
Branduardi-Raymont, G., Bhardwaj, A., Elsner, R. F., Gladstone, G. R., Ramsay, G., Rodriguez, P., et al. (2007a). Latest results on Jovian disk X-rays from XMM-Newton. Planetary and Space Science, 55(9), 1126–1134. https://doi.org/10.1016/j.pss.2006.11.017
Branduardi-Raymont, G., Bhardwaj, A., Elsner, R. F., Gladstone, G. R., Ramsay, G., Rodriguez, P., et al. (2007b). A study of Jupiter's aurorae with XMM-Newton. Astronomy and Astrophysics, 463(2), 761–774. https://doi.org/10.1051/0004-6361:20066406
Branduardi-Raymont, G., Bhardwaj, A., Elsner, R. F., & Rodriguez, P. (2010). X-rays from Saturn: A study withXMM-NewtonandChan-draover the years 2002-05. Astronomy and Astrophysics, 510(1), A73. https://doi.org/10.1051/0004-6361/200913110
Branduardi-Raymont, G., Elsner, R. F., Gladstone, G. R., Ramsay, G., Rodriguez, P., Soria, R., & Waite, J. H. (2004). First observation of Jupiter by XMM-Newton. Astronomy & Astrophysics, 424(1), 331–337. https://doi.org/10.1051/0004-6361:20041149
Branduardi-Raymont, G., Ford, P. G., Hansen, K. C., Lamy, L., Masters, A., Cecconi, B., et al. (2013). Search for Saturn's X-ray aurorae at the arrival of a solar wind shock. Journal of Geophysical Research, 118(5), 2145–2156. https://doi.org/10.1002/jgra.50112
Carter, J. A., & Sembay, S. (2008). Identifying XMM-Newton observations affected by solar wind charge exchange. Part I. Astronomy and Astrophysics, 489(2), 837–848. https://doi.org/10.1051/0004-6361:200809997
Carter, J. A., Sembay, S., & Read, A. M. (2010). A high charge state coronal mass ejection seen through solar wind charge ex-change emission as detected by XMM-Newton. Monthly Notices of the Royal Astronomical Society, 402(2), 867–878. https://doi. org/10.1111/j.1365-2966.2009.15985.x
Carter, J. A., Sembay, S., & Read, A. M. (2011). Identifying XMM-Newton observations affected by solar wind charge exchange – Part II. Astronomy and Astrophysics, 527, A115. https://doi.org/10.1051/0004-6361/201015817
Cravens, T. E. (1997). Comet Hyakutake x-ray source: Charge transfer of solar wind heavy ions. Geophysical Research Letters, 24(1), 105– 108. https://doi.org/10.1029/96gl03780
Cravens, T. E. (2002). X-ray emission from comets. Science, 296(5570), 1042–1045. https://doi.org/10.1126/science.1070001
Cravens, T. E., Clark, J., Bhardwaj, A., Elsner, R., Waite, J. H., Maurellis, A. N., et al. (2006). X-ray emission from the outer planets: Albedo for scattering and fluorescence of solar X rays. Journal of Geophysical Research, 111(A7). https://doi.org/10.1029/2005ja011413
Dennerl, K. (2002). Discovery of X-rays from Mars with Chandra. Astronomy and Astrophysics, 394(3), 1119–1128. https://doi. org/10.1051/0004-6361:20021116
Dennerl, K., Burwitz, V., Englhauser, J., Lisse, C., & Wolk, S. (2002). Discovery of X-rays from Venus with Chandra. Astronomy and Astro-physics, 386(1), 319–330. https://doi.org/10.1051/0004-6361:20020097
Dennerl, K., Lisse, C. M., Bhardwaj, A., Burwitz, V., Englhauser, J., Gunell, H., et al. (2006). First observation of Mars with XMM-Newton. Astronomy and Astrophysics, 451(2), 709–722. https://doi.org/10.1051/0004-6361:20054253
Desch, M. D., Kaiser, M. L., & Kurth, W. S. (1989). Impulsive solar wind-driven emission from Uranus. Journal of Geophysical Research, 94(A5), 5255–5263. https://doi.org/10.1029/JA094iA05p05255
Desch, M. D., Kaiser, M. L., Zarka, P., Lecacheux, A., Leblanc, Y., Aubier, M., & Ortega-Molina, A. (1991). Uranus as a radio source. in Uranus, Tucson, AZ, University of Arizona Press, 894–925.
Dunn, W. R., Branduardi-Raymont, G., Carter-Cortez, V., Campbell, A., Elsner, R., Ness, J.-U., et al. (2020). Jupiter's X-rays 2007 Part 1: Jupiter's X-ray emission during solar minimum. Journal of Geophysical Research: Space Physics, 125(6). e2019JA027219. https://doi. org/10.1029/2019JA027219
Dunn, W. R., Branduardi-Raymont, G., Elsner, R. F., Vogt, M. F., Lamy, L., Ford, P. G., et al. (2016). The impact of an ICME on the Jovian X-ray aurora. Journal of Geophysical Research: Space Physics, 121(3), 2274–2307. https://doi.org/10.1002/2015ja021888
Dunn, W. R., Branduardi-Raymont, G., Ray, L. C., Jackman, C. M., Kraft, R. P., Elsner, R. F., et al. (2017). The independent pulsations of Jupiter's northern and southern X-ray auroras. Nature Astronomy, 1(11). https://doi.org/10.1038/s41550-017-0262-6
Dunn, W. R., Gray, R., Wibisono, A. D., Lamy, L., Louis, C., Badman, S. V., et al. (2020). Jupiter's X-ray Emission 2007 Part 2: Com-parisons with UV and radio emissions and in-situ solar wind measurements. Journal of Geophysical Research: Space Physics, 125(6). e2019JA027222.
Elsner, R. F., Gladstone, G. R., Waite, J. H., Crary, F. J., Howell, R. R., Johnson, R. E., et al. (2002). Discovery of Soft X-Ray Emission from Io, Europa, and the Io plasma torus. The Astrophysical Journal, 572(1), 1077–1082. https://doi.org/10.1086/340434
Elsner, R. F., Lugaz, N., Waite, J. H., Jr., Cravens, T. E., Gladstone, G. R., Ford, P., et al. (2005). Simultaneous Chandra X ray, Hubble Space Telescope ultraviolet, and Ulysses radio observations of Jupiter's aurora. Journal of Geophysical Research, 110(A1). https://doi. org/10.1029/2004ja010717
Farrell, W. M., Desch, M. D., Kaiser, M. L., & Calvert, W. (1991). Evidence of auroral plasma cavities at Uranus and Neptune from radio burst observations. Journal of Geophysical Research, 96(S01), 19049–19059. https://doi.org/10.1029/91ja01409
Gladstone, G. R., Waite, J. H., Grodent, D., Lewis, W. S., Crary, F. J., Elsner, R. F., et al. (2002). A pulsating auroral X-ray hot spot on Jupiter. Nature, 415(6875), 1000–1003. https://doi.org/10.1038/4151000a
Houston, S. J., Cravens, T. E., Schultz, D. R., Gharibnejad, H., Dunn, W. R., Haggerty, D. K., et al. (2020). Jovian auroral ion precipitation: X-Ray production from oxygen and sulfur precipitation. Journal of Geophysical Research: Space Physics, 125(2). e2019JA027007. https:// doi.org/10.1029/2019ja027007
Hui, Y., Schultz, D. R., Kharchenko, V. A., Bhardwaj, A., Branduardi-Raymont, G., Stancil, P. C., et al. (2010). Comparative analysis and variability of the Jovian X-ray spectra detected by the Chandra and XMM-Newton observatories. Journal of Geophysical Research, 115. A07102. https://doi.org/10.1029/2009ja014854
Acknowledgments
The authors greatly thank Belinda Wilkes for the Chandra Director Dis-cretionary Time analyzed in this work. W. R. Dunn would also like to thank D. Weigt, T. Nordheim, and J. Jasinski for valuable discussions on Chandra pro-cessing for planets and X-ray emission sources at the Ice Giants. W. R. Dunn also greatly thanks Catherine Grant for her valuable discussions on low-signal noise sources for X-ray emission via Twitter. W. R. Dunn would also like to greatly thank N. Achilleos for all his continued support at UCL. During the course of this work, W. R. Dunn was supported by a Science and Technology Facilities Council (STFC) research grant to University College London (UCL) and by European Space Agency (ESA) contract no. 4000120752/17/NL/MH. L. Lamy was supported by CNES and CNRS/INSU programs of planetology and heliophysics. The authors also greatly thank the Chandra project for their support.
Hui, Y., Schultz, D. R., Kharchenko, V. A., Stancil, P. C., Cravens, T. E., Lisse, C. M., & Dalgarno, A. (2009). The ion-induced charge-ex-change x-ray emission of the jovian auroras: Magnetospheric or solar wind origin? Acta Pathologica Japonica, 702(2), L158. https://doi. org/10.1088/0004-637x/702/2/l158
Jackman, C. M., Knigge, C., Altamirano, D., Gladstone, R., Dunn, W., Elsner, R., et al. (2018). Assessing quasi-periodicities in Jovian X-Ray emissions: Techniques and heritage survey. Journal of Geophysical Research: Space Physics, 123, 9204–9221. https://doi. org/10.1029/2018ja025490
Kimura, T., Kraft, R. P., Elsner, R. F., Branduardi-Raymont, G., Gladstone, G. R., Tao, C., et al. (2016). Jupiter's X-ray and EUV auroras monitored by Chandra, XMM-Newton, and Hisaki satellite. Journal of Geophysical Research: Space Physics, 121, 2308–2320. https://doi. org/10.1002/2015ja021893
Lam, H. A., Miller, S., Joseph, R. D., Geballe, T. R., Trafton, L. M., Tennyson, J., & Ballester, G. E. (1997). Variation in the H3+emission of Uranus. The Astrophysical Journal Letters, 474(1), L73. https://doi.org/10.1086/310424
Lamy, L. (2020). Auroral emissions from Uranus and Neptune. Philosophical Transactions of the Royal Society A, 378(2187), 20190481.
https://doi.org/10.1098/rsta.2019.0481
Lamy, L., Berland, C., André, N., Prangé, R., Fouchet, T., Encrenaz, T., et al. (2018). Analysis of HST, VLT and Gemini coordinated observa-tions of Uranus late 2017: A multi-spectral search for auroral signatures. ArXiv Preprint ArXiv:1810.08526.
Lamy, L., Prangé, R., Hansen, K. C., Clarke, J. T., Zarka, P., Cecconi, B., et al. (2012). Earth-based detection of Uranus' aurorae. Geophysical Research Letters, 39(7). https://doi.org/10.1029/2012gl051312
Lamy, L., Prangé, R., Hansen, K. C., Tao, C., Cowley, S. W. H., Stallard, T. S., et al. (2017). The aurorae of Uranus past equinox. Journal of Geophysical Research: Space Physics, 122(4), 3997–4008. https://doi.org/10.1002/2017ja023918
Lisse, C. M., Christian, D. J., Dennerl, K., Meech, K. J., Petre, R., Weaver, H. A., & Wolk, S. J. (2001). Charge exchange-induced X-ray emis-sion from Comet C/1999 S4 (LINEAR). Science, 292(5520), 1343–1348. https://doi.org/10.1126/science.292.5520.1343
Lisse, C. M., Dennerl, K., Englhauser, J., Harden, M., Marshall, F. E., Mumma, M. J., et al. (1996). Discovery of X-ray and extreme ultravio-let emission from comet C/Hyakutake 1996 B2. Science, 274(5285), 205–209. https://doi.org/10.1126/science.274.5285.205
Lisse, C. M., McNutt, R. L., Jr., Wolk, S. J., Bagenal, F., Stern, S. A., Gladstone, G. R., et al. (2017). The puzzling detection of x-rays from Pluto by Chandra. Icarus, 287, 103–109. https://doi.org/10.1016/j.icarus.2016.07.008
Mauk, B. H., & Fox, N. J. (2010). Electron radiation belts of the solar system. Journal of Geophysical Research, 115(A12). https://doi. org/10.1029/2010ja015660
Maurellis, A. N., Cravens, T. E., Gladstone, G. R., Waite, J. H., & Acton, L. W. (2000). Jovian X-ray emission from solar X-ray scattering. Geophysical Research Letters, 27(9), 1339–1342. https://doi.org/10.1029/1999gl010723
Melin, H., Fletcher, L. N., Stallard, T. S., Miller, S., Trafton, L. M., Moore, L., et al. (2019). The H3+ ionosphere of Uranus: Decades-long cooling and local-time morphology. Philosophical Transactions of the Royal Society A, 377(2154), 20180408. https://doi.org/10.1098/ rsta.2018.0408
Melin, H., Stallard, T., Miller, S., Trafton, L. M., Encrenaz, T., & Geballe, T. R. (2011). Seasonal variability in the ionosphere of Uranus. Acta Pathologica Japonica, 729(2), 134. https://doi.org/10.1088/0004-637x/729/2/134
Ness, J. U., & Schmitt, J. H. (2000). A search for X-ray emission from Saturn, Uranus and Neptune. arXiv preprint astro-ph/0001131. Ness, N. F., Acuna, M. H., Behannon, K. W., Burlaga, L. F., Connerney, J. E. P., Lepping, R. P., & Neubauer, F. M. (1986). Magnetic fields at
Uranus. Science, 233(4759), 85–89. https://doi.org/10.1126/science.233.4759.85
Nittler, L. R., Starr, R. D., Weider, S. Z., McCoy, T. J., Boynton, W. V., Ebel, D. S., et al. (2011). The major-element composition of Mercury's surface from MESSENGER x-ray spectrometry. Science, 333(6051), 1847–1850. https://doi.org/10.1126/science.1211567
Nulsen, S., Kraft, R., Germain, G., Dunn, W., Tremblay, G., Beegle, L., et al. (2020). X-Ray emission from Jupiter's Galilean Moons: A tool for determining their surface composition and particle environment. Acta Pathologica Japonica, 895(2), 79. https://doi. org/10.3847/1538-4357/ab8cbc
Ozak, N., Cravens, T. E., & Schultz, D. R. (2013). Auroral ion precipitation at Jupiter: Predictions for Juno. Geophysical Research Letters, 40, 4144–4148. https://doi.org/10.1002/grl.50812
Raab, W., Branduardi-Raymont, G., Wang, C., Dai, L., Donovan, E., Enno, G., et al. (2016). SMILE: A joint ESA/CAS mission to investigate the interaction between the solar wind and Earth's magnetosphere. Space Telescopes and Instrumentation 2016: Ultraviolet to Gamma Ray, 9905, 990502. https://doi.org/10.1117/12.2231984
Russell, C. T., & Luhmann, J. G. (1997). Encyclopedia of planetary sciences. New York: Chapman and Hall.
Smith, R. K., Brickhouse, N. S., Liedahl, D. A., & Raymond, J. C. (2001). Collisional plasma models with APEC/APED: Emission-line diag-nostics of hydrogen-like and helium-like ions. The Astrophysical Journal Letters, 556(2), L91. https://doi.org/10.1086/322992
Soman, M. R., Hall, D. J., Holland, A. D., Burgon, R., Buggey, T., Skottfelt, J., et al. (2018). The SMILE Soft X-ray Imager (SXI) CCD design and development. Journal of Instrumentation, 13(01). C01022. https://doi.org/10.1088/1748-0221/13/01/c01022
Weigt, D. M., Jackman, C. M., Dunn, W. R., Gladstone, G. R., Vogt, M. F., Wibisono, A. D., et al. (2020). Chandra Observations of Jupiter's X-ray auroral emission during Juno Apojove 2017. Journal of Geophysical Research: Planets, 125(4). https://doi.org/10.1029/2019je006262
Wibisono, A. D., Branduardi-Raymont, G., Dunn, W. R., Coates, A. J., Weigt, D. M., Jackman, C. M., et al. (2020). Temporal and spectral studies by XMM-Newton of Jupiter's x-ray auroras during a compression event. Journal of Geophysical Research: Space Physics.