Publisher’s version / Version de l'éditeur:
ECS Transactions, 50, 2, pp. 2139-2149, 2013-03-15
READ THESE TERMS AND CONDITIONS CAREFULLY BEFORE USING THIS WEBSITE. https://nrc-publications.canada.ca/eng/copyright
Vous avez des questions? Nous pouvons vous aider. Pour communiquer directement avec un auteur, consultez la première page de la revue dans laquelle son article a été publié afin de trouver ses coordonnées. Si vous n’arrivez pas à les repérer, communiquez avec nous à [email protected].
Questions? Contact the NRC Publications Archive team at
[email protected]. If you wish to email the authors directly, please see the first page of the publication for their contact information.
NRC Publications Archive
Archives des publications du CNRC
This publication could be one of several versions: author’s original, accepted manuscript or the publisher’s version. / La version de cette publication peut être l’une des suivantes : la version prépublication de l’auteur, la version acceptée du manuscrit ou la version de l’éditeur.
For the publisher’s version, please access the DOI link below./ Pour consulter la version de l’éditeur, utilisez le lien DOI ci-dessous.
https://doi.org/10.1149/05002.2139ecst
Access and use of this website and the material on it are subject to the Terms and Conditions set forth at Membrane electrode assemblies based on hydrocarbon electrolytes with nitrile groups for direct methanol fuel cells
Hurter, Stephan; Muller, Martin; Wippermann, Klaus; Guiver, Michael D.; Scoles, Ludmilla; Stolten, Detlef
https://publications-cnrc.canada.ca/fra/droits
L’accès à ce site Web et l’utilisation de son contenu sont assujettis aux conditions présentées dans le site LISEZ CES CONDITIONS ATTENTIVEMENT AVANT D’UTILISER CE SITE WEB.
NRC Publications Record / Notice d'Archives des publications de CNRC: https://nrc-publications.canada.ca/eng/view/object/?id=c8f77568-1b71-46f8-bbe0-64e9ab3bef11 https://publications-cnrc.canada.ca/fra/voir/objet/?id=c8f77568-1b71-46f8-bbe0-64e9ab3bef11
Membrane Electrode Assemblies based on Hydrocarbon Electrolytes with Nitrile Groups for Direct Methanol Fuel Cells
Stefan Hürtera, Martin Müllera, Klaus Wippermanna, Michael D. Guiverb, Ludmila Scolesb and Detlef Stoltena
a
Forschungszentrum Jülich, Institute of Energy and Climate Research – Fuel Cells (IEK-3), 52425 Jülich, Germany
b
National Research Council Canada, Institute for Chemical Process and Environmental Technology, 1200 Montreal Road, Ottawa, Ontario, Canada
Sulfonated poly(aryl ether ether nitrile)s - sPAEEN are promising materials for reducing the methanol permeation from anode to cathode due to the strong polar interchain interactions caused by the nitrile functional groups. This feature allows the preparation of membranes with high proton conductivities and low crossover of methanol and water.
Despite similar specific conductivities and lower thickness of the hydrocarbon membranes compared to Nafion 115, HC-MEAs prepared by a classic hot-pressing step show 40-70 % higher values for the cell resistances compared to Nafion 115 based MEAs. Therefore the MEA preparation procedure was changed to reduce losses due to poor lamination between the Nafion-based GDE and the hydrocarbon membrane.
The impact of the type of sPAEEN membrane and the MEA preparation together with the cell performance data will be compared with state-of-the art Nafion-based cells and discussed in terms of consequences for the operating conditions for a DMFC system.
Introduction
Direct methanol fuel cells (DMFCs) are promising energy converters for portable applications. In contrast to polymer electrolyte fuel cells utilizing H2/air as reactants the
research for DMFCs does not only target the increase of the electrochemical performance but also the decrease of the methanol permeation. Due to methanol permeation the faradaic efficiency (= fuel utilization) of state-of-the-art direct methanol fuel cells based on Nafion membranes amounts to only 50- 70 % under relevant operating conditions [1]. In addition the permeation of methanol leads to a mixed potential on the cathode side which decreases the performance of the DMFC [2, 3]. Reducing this methanol permeation is one of the key issues for improving the DMFC. One of the approaches is to replace the currently used Nafion membrane by alternative membrane materials. Among the large variety of alternative membrane materials, sulfonated poly(aryl ether ether nitrile)s – sPAEENs are promising because of the strong polar interchain interactions caused by the nitrile functional groups [4- 6]. This feature allows the preparation of highly sulfonated materials that exhibit moderate swelling properties. Thus, high proton conductivity can be combined with low crossover of methanol and water [6, 7].
The first examinations of these sPAEEN membranes shown in the literature stated that the electrochemical performance exceeds the performance of Nafion 115 when being applied in a membrane electrode assembly (MEA) in a DMFC under optimized conditions [5, 8]. At the moment the sPAEEN membranes are often assembled with Nafion based gas diffusion electrodes (GDEs). The performance of such MEAs often decreases as a result of incompatibilities between the membrane and the GDE. Due to a poor interface connection between the membrane and the GDE, the MEA resistance can increase strongly, independent of the bulk resistance of the membrane itself. The assembling process of the sPAEEN membrane and the Nafion-based GDEs has a direct influence on the interface between the components and therefore directly impacts the performance of the MEA [9- 12]. Therefore, finding a suitable assembling process to reduce performance losses due to the interface plays an important role by replacing Nafion by sPAEEN-membranes.
In this paper the utilization of sPAEEN membranes in MEAs in a DMFC system is discussed regarding the methanol utilization, the water management and the cathode air flow management of the whole DMFC system. Different assembling methods were investigated regarding their influence on the MEA performance. It will be shown that some assembling parameters have a large influence on the interface between the sPAEEN membrane and the Nafion-based GDE and therefore affect the MEA performance.
Experimental
Membrane Characterization
Water Uptake To measure the water uptake of the deployed membranes, the membranes were dried at 60 °C for 6 h under vacuum condition. After the drying step the membranes were inserted into deionized water at 80 °C for 3 h. Following the heating step the water was cooled down to RT, where the membranes remained for 24 h. The water uptake was obtained by measuring the samples weight before and after being inserted into the water.
Proton Conductivity The proton conductivity of the sPAEEN membranes was determined by means of an in-plane four-point technique in a custom-designed test rig. During the measurements the relative humidity in the measurement chamber was φ = 100 %. The specific conductivity was calculated by equation 1, where d is the membranes thickness, l the distance between the inner electrodes and b the width of the membrane. The resistance R was obtained from AC impedance spectroscopy over a frequency range of 500 Hz to 65 kHz with an amplitude of 20 mV. For the calculation of the specific conductivity the thickness of the dry membrane was taken.
b d R l [1] Membrane-properties
In this paper two sPAEEN membranes with different structures are going to be investigated. Their structure is described in [5]. The utilized membranes are presented in table I.
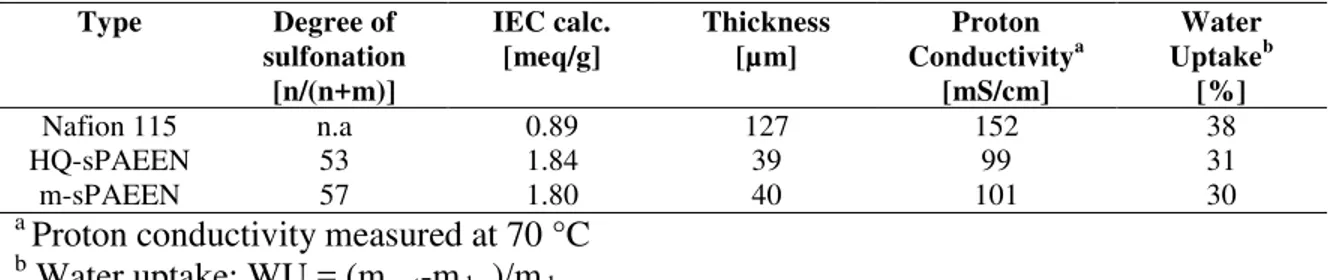
Table I shows that the proton conductivity of the sPAEEN membranes is lower than the proton conductivity of Nafion 115. Therefore the membranes were fabricated very thin to reduce ohmic losses during the cell operation. Table I shows as well that the water uptake
of the sPAEEN membranes is reduced compared to the Nafion 115 membrane. This should lead to a decreased methanol and water permeation through the membrane.
TABLE I: Membrane properties
Type Degree of sulfonation [n/(n+m)] IEC calc. [meq/g] Thickness [µm] Proton Conductivitya [mS/cm] Water Uptakeb [%] Nafion 115 n.a 0.89 127 152 38 HQ-sPAEEN 53 1.84 39 99 31 m-sPAEEN 57 1.80 40 101 30 a
Proton conductivity measured at 70 °C
b
Water uptake: WU = (mwet-mdry)/mdry
MEA-preparation and Testing
The different membranes were assembled with an anode and a cathode GDE. The GDEs were prepared in house by knife coating. The anode GDEs were prepared with an alloy of PtRu/C (47 mass-% Pt, 23 mass-% Ru and 30 mass-% C) from Johnson Matthey on a carbon fleece without microlayer H2315-I6 from Freudenberg, while the cathode GDEs were prepared on a carbon fleece with microlayer H2315-C4 from Freudenberg. The cathode GDEs were prepared with an alloy of Pt/C (60 mass-% Pt and 40 mass-% C) from Johnson Matthey. The average catalyst loading of the GDEs was 2.5 mg/cm2. The sPAEEN based MEAs were assembled without exerting pressure at room temperature. The membranes were in a wet state during assembling. To assemble the Nafion 115 based MEAs, the MEAs were hotpressed for 3 min at a temperature of 130 °C and a pressure of 0.5 kN/cm2.
For DMFC testing, the cell was heated to 60- 80 °C. The anode was fed with a 1M methanol/ water solution at a flow rate of 0.22 ml/(min*cm2). The cathode was fed with dry air at different flow rates. The air was fed at ambient pressure.
Results
Implementation of sPAEEN membran based MEAs in a DMFC system
It was shown, that the sPAEEN membranes exhibit properties which make them promising candidates for the use in a DMFC MEA. To properly judge the membranes, their performance within a DMFC system has to be tested. Therefore the different MEAs were electrochemically investigated. During this investigation the cathodic flow rate of the cell was varied at a constant current while measuring the voltage, the methanol permeation and the water in the cathodic air flow. Figures 1-3 show the typical charts for the measurement of Nafion 115, HQ-sPAEEN 53 and m-sPAEEN 57 based MEAs. Figure 1 shows the electrochemical performance of MEAs based on different membrane types. It is shown in the figure that the replacement of the Nafion 115 membrane with HQ-sPAEEN 53 leads to a voltage reduction of about 3 % in average. It was assumed that this voltage loss is based on an increased MEA resistance which could be shown via impedance measurements. The MEA resistance of the HQ-sPAEEN 53 based MEA was 260 mΩcm2, while the resistance of the Nafion 115 based MEA was about 250 mΩcm2. Due to its low thickness the areic resistance of the HQ-sPAEEN 53 membrane is lower than the resistance of the Nafion 115 membrane (43 mΩ compared to 85 mΩ). Therefore the additional resistance leading to higher MEA resistance of the HQ-sPAEEN 53 based
MEA has to come from the interface between the membrane and the Nafion based GDE. The same case occurs when applying the m-sPAEEN 57 membrane. Despite showing an areic membrane resistance of 40 mΩ, the m-sPAEEN 57 based MEA shows a MEA resistance of 240 mΩcm2, almost the same as the Nafion 115 based membrane. It can be concluded that the application of sPAEEN membranes leads to the same MEA resistances compared to Nafion 115 based MEAs despite the fact, that the membrane resistances are lower. Due to poor assembling large interface resistances appear, which lead to the high MEA resistances. 0.005 0.010 0.015 0.020 0.025 0.030 0.035 0.30 0.35 0.40 0.45 0.50 V o lt a g e [ V ]
Cathodic Flow Rate [l/(min*cm2)]
Nafion 115 HQ-sPAEEN 53 m-sPAEEN 57
Figure 1: Electrochemical characterization of MEAs based on Nafion 115, HQ-sPAEEN 53 and m-sPAEEN 57
Operating conditions: j = 100 mA/cm2, anodic flow rate = 0.22 ml/(min*cm2), T = 60 °C, ambient pressure
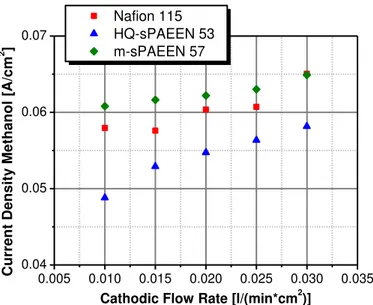
In Figure 2 the methanol permeation through the different MEAs is presented. The figure indicates that the methanol permeation through the m-sPAEEN 57 based MEA is higher than the methanol permeation through the Nafion 115 based MEA. The permeation is about 3 % higher for low cathodic flow rates, while the permeation at high cathodic flow rates is comparable. By utilizing an HQ-sPAEEN 53 based MEA the methanol permeation can be decreased by ~10 % at same points of operation. Over the entire range of different cathodic flow rates, the methanol permeation is reduced for the HQ-sPAEEN 53 based MEA.
0.005 0.010 0.015 0.020 0.025 0.030 0.035 0.04
0.05 0.06 0.07
Cathodic Flow Rate [l/(min*cm2)]
C u rr e n t D e n s it y M e th a n o l [A /c m 2 ] Nafion 115 HQ-sPAEEN 53 m-sPAEEN 57
Figure 2: Methanol permeation of MEAs based on Nafion 115, HQ-sPAEEN 53 and m-sPAEEN 57
Operating conditions: j = 100 mA/cm2, anodic flow rate = 0.22 ml/(min*cm2), T = 60 °C, ambient pressure
The water permeation through the MEAs is strongly reduced by applying the sPAEEN membranes in the MEAs. In Figure 3, the amount of water within the cathodic air flow over different flow rates is shown. The blue dotted line represents the amount of water the air can carry when being fully saturated. The figure shows, that the amount of water on the cathode side strongly depends on the cathodic flow rate. For all the different membranes, the amount of water lessens with decreasing flow rates. The picture also shows that Nafion 115 based MEAs exhibit a large water permeation compared to the sPAEEN based MEAs. By replacing the Nafion 115 membrane by an m-sPAEEN 57 the water permeation can be reduced by ~10 % for high flow rates. A water reduction of 25 % can be obtained for low cathodic flow rates. By replacing the Nafion 115 membrane with a HQ-sPAEEN 53 the water permeation can be lowered even more. At high cathodic flow rates, the water permeation can be lessened by ~20 % while it is reduced by ~40 % at high flow rates. Figure 3 shows as well, that the use of Nafion 115 bears the problem, that the cathodic air flow is saturated at flow rates under 0.025 l/(min*cm2). Liquid water occurs in the flowfield which can lead to a disturbed supply of air in the cathode flow field. For the m-sPAEEN 57 based MEA the cathodic flow rate can be reduced to 0.015 l/(min*cm2) until the air is saturated. When using a HQ-sPAEEN 53 membrane the air does not reach saturation for the measured range of flow rates.
0.005 0.010 0.015 0.020 0.025 0.030 0.035 0.0 0.1 0.2 0.3 0.4
Cathodic Flow Rate [l/(min*cm2)]
H 2 O i n C a th o d ic E x h a u s t G a s [g/ (h *c m 2 )] Nafion 115 HQ-sPAEEN 53 m-sPAEEN 57
Figure 3: Water flux through MEAs based on Nafion 115, HQ-sPAEEN 53 and m-sPAEEN 57
Operating conditions: j = 100 mA/cm2, anodic flow rate = 0.22 ml/(min*cm2), T = 60 °C, ambient pressure
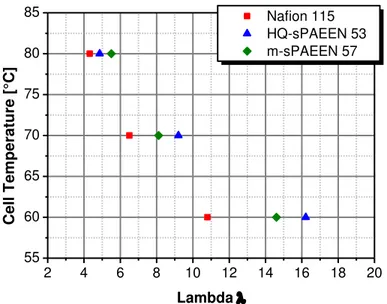
In Figures 1-3 it was shown, that by the application of sPAEEN membranes, key characteristics of the electrochemical behavior of a MEA are changed. This has direct influence on the temperature regulation of a DMFC system. The temperature of a DMFC system is dependent on several factors. The electrochemical reaction, from the power generation and the methanol crossover, and the current are ascribed as heat sources while the convection, the water evaporation and the ingoing and outgoing mass flows are taken as heat sinks. In a DMFC system, the temperature is directly controlled via the applied current and the cathodic air flow. The cathodic air flow directly controls the amount of water which evaporates into the air and therefore cools down the system. In Figure 4 the temperature management of sPAEEN based MEAs is compared to Nafion 115 based MEAs at a steady current. The temperature is controlled just by the cathodic air flow. In Figure 4 it is presented how the cell temperature of different MEAs depends on the cathodic air flow. In this picture the air flow is represented by λ, which is the ratio between the supplied air and the air needed for the electrochemical reaction. The figure shows that the cathodic flow rates which have to be used for the specific cell temperatures are lower for the Nafion 115 based MEA. This is due to the fact that the temperature of the cell is controlled directly by the amount of evaporating water. The Nafion based cell works in the range of saturated air, so modifying the air flow leads to a direct change of evaporating water. For the sPAEEN based cells this is not the case. Here the temperature can be controlled partially over the amount of saturation. Based on the fact that only a small amount of water is present on the cathode side, the heat sink due to water evaporation is insufficient to cool down the cell. So the cell has to be cooled down by the air as well, which leads to high cathodic flow rates.
2 4 6 8 10 12 14 16 18 20 55 60 65 70 75 80 85 C e ll T e m p e ra tu re [ °C ] Lambda Nafion 115 HQ-sPAEEN 53 m-sPAEEN 57
Figure 4: Cell temperature management via cathodic air flow
Operating conditions: j = 100 mA/cm2, anodic flow rate = 0.22 ml/(min*cm2), ambient pressure
As shown in Figure 4, the application of sPAEEN membranes in MEAs has a direct influence on the system operation of a DMFC. Depending on the cathodic flow rates, shown in Figure 4, it was calculated which amount of water has to be recovered within the DMFC system to obtain a closed water cycle. Having a closed water cycle means that the amount of water within the system stays constant and only the water that is generated by the conversion of methanol is allowed to leave the system. An additional tank for water or the use of a methanol water mixture is unnecessary. Figure 5 shows that the amount of liquid water which has to be cycled within the DMFC system is lessened when applying the sPAEEN membranes in the MEA instead of Nafion 115. The cycled water within the system decreases by 15- 20 % for the whole range of cell temperatures.
55 60 65 70 75 80 85 0.0 0.1 0.2 0.3 0.4 L iq u id Wa te r c y c le d i n F u e l C e ll S y s te m [g/ (h *c m 2 )] Cell Temperature [°C] Nafion 115 HQ-sPAEEN 53 m-sPAEEN 57
Figure 5: Amount of cycled water within DMFC system
Operating conditions: j = 100 mA/cm2, anodic flow rate = 0.22 ml/(min*cm2), cathodic flow rate: Figure 2, ambient pressure
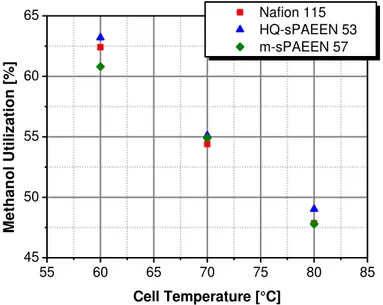
In Figure 2 it was shown, that the methanol permeation through the MEA could be reduced by replacing the Nafion 115 MEA by a HQ-sPAEEN 53. The decrease of the permeation leads to a direct enhancement of the methanol utilization. Figure 6 shows that the reduction of the methanol permeation of ~10 % leads to an increase of the methanol utilization of ~3 % when using the HQ-sPAEEN 53 based MEA compared with the Nafion 115 based MEA. Replacing the Nafion 115 membrane by an m-sPAEEN 57 does not lead to a reduction of the methanol permeation through the MEA. Depending on the cell temperature, the methanol permeation is even worse, as Figure 6 indicates. At low cell temperatures the methanol utilization of the m-sPAEEN 57 based MEA is lower than the utilization of the Nafion 115 based MEA. Therefore the utilization of m-sPAEEN 57 as a membrane doesn’t lead to an improvement in the methanol utilization for the DMFC system. 55 60 65 70 75 80 85 45 50 55 60 65 M e th a n o l U til iz a tio n [ % ] Cell Temperature [°C] Nafion 115 HQ-sPAEEN 53 m-sPAEEN 57
Figure 6: Methanol utilization of sPAEEN based cells
Operating conditions: j = 100 mA/cm2, anodic flow rate = 0.22 ml/(min*cm2); cathodic flow rate: Figure 2; ambient pressure
It was shown that the use of sPAEEN membranes instead of Nafion 115 as membrane in MEAs for a DMFC application leads to promising results regarding their performance within the DMFC system. The water permeation through the MEA could be decreased strongly, which leads to a lower amount of cycled water to obtain a closed water cycle. In addition, the use of HQ-sPAEEN 53 leads to decreased methanol permeation which results in a higher methanol utilization. In the measurements it was also shown that the sPAEEN based MEAs, which were assembled without exerting pressure exhibit a lower electrochemical performance compared to Nafion 115 based MEAs.
Hot-pressing of sPAEEN based MEAs
One of the key challenges for the implementation of the sPAEEN membranes is to find an assembling procedure for the MEA preparation which leads to a good connection between the membrane and the Nafion based GDE and therefore leads to a reduced MEA resistance because of low interface resistances. To enhance the electrochemical performance of the sPAEEN based MEAs, different hot-pressing
temperatures were investigated. The influence of the different hot-pressing temperatures on the electrochemical performance of the MEA is visualized in Figure 7. The figure shows that a pressing step at room temperature leads to an improved MEA performance compared to an unpressed MEA. This applies for HQ-sPAEEN 53 and m-sPAEEN 57. If the hot-pressing temperature is heightened up to a temperature of 100 °C no visible improvement of the electrochemical performance occurs. After the hot-pressing temperature exceeds ~100 °C the MEA performance of the m-sPAEEN 57 based MEA drops. A voltage drop of ~25 mV at j = 100 mA/cm2 and a drop of ~50 mV/cm2 at j = 300 mA/cm2 is visible. If the hot pressing temperature is raised even more no further reduction of the voltage appears.
The negative influence of high pressing temperatures on the HQ-sPAEEN 53 based MEA is visible after the temperature exceeds 130 °C. When the pressing temperature is increased from 130 °C to 170 °C a voltage drop of 30 mV for j = 100 mA/cm2 and a drop of 50 mV for j = 300 mA/cm2 occurs. So for the two types of sPAEEN membranes the voltage loss is comparable, but depends on different pressing temperatures.
0 50 100 150 200 0.0 0.1 0.2 0.3 0.4 0.5 0.6 Vo ltag e [V]
Hot Pressing Temperature [°C]
Current Density 0.1 0.2 0.3 [A/cm2]
HQ-sPAEEN 53 m-sPAEEN 57
unpressed
Figure 7: Influence of Pressing Temperature on electrochemical performance of sPAEEN based MEAs
Operating conditions: j = 100 mA/cm2, anodic flow rate = 0.22 ml/(min*cm2), cathodic flow rate = 36 ml/(min*cm2), T = 70 °C, ambient pressure
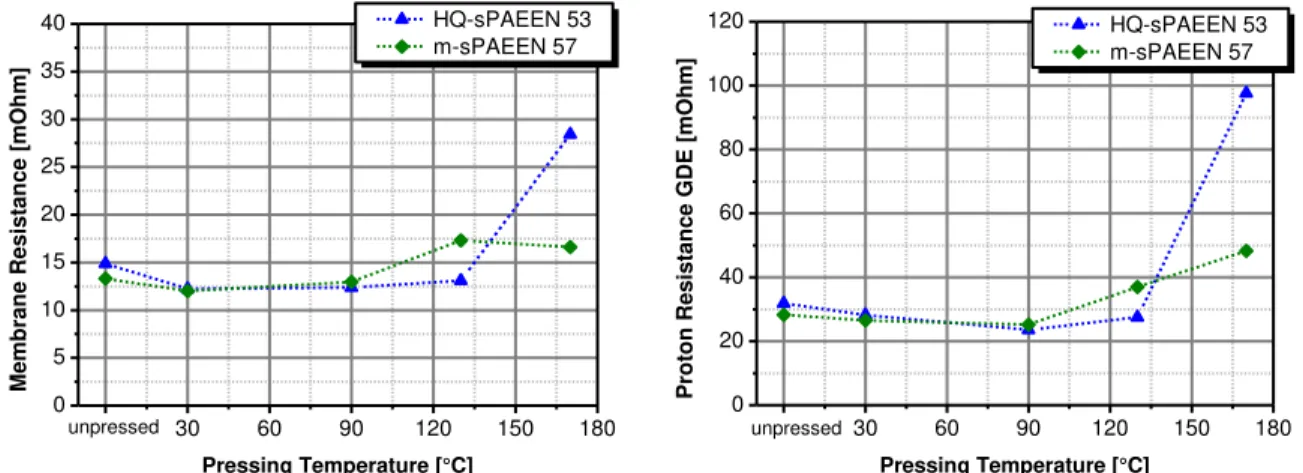
To find the cause of the voltage loss, the assembled MEAs were investigated via impedance spectroscopy. In Figure 8, the results for the impedance spectroscopy measurement are presented. The figure shows that the membrane resistance and the proton resistance of the GDE reduce slightly when the MEA is pressed. The decrease of the membrane resistance and the proton resistance directly reflect the increase of the electrochemical performance of the MEAs because of pressurized assembling, see figure 7. Figure 8 shows as well, that the membrane resistance and the proton resistance of the m-sPAEEN 57 based MEA increases after the pressing temperature exceeds ~100 °C. This correlates well with the data of the electrochemical performance. The membrane resistance and the proton resistance of the HQ-sPAEEN 53 based MEA correlate with the electrochemical performance as well. High pressing temperatures, over 130 °C, lead to a strong gain of the membrane resistance and the proton resistance and therefore to the reduction of the electrochemical performance of the MEA.
0 30 60 90 120 150 180 0 5 10 15 20 25 30 35 40 unpressed M emb ran e R esi stan ce [mOh m] Pressing Temperature [°C] HQ-sPAEEN 53 m-sPAEEN 57 0 30 60 90 120 150 180 0 20 40 60 80 100 120 unpressed Pr o to n R esi stan ce GD E [mOh m] Pressing Temperature [°C] HQ-sPAEEN 53 m-sPAEEN 57
Figure 8: Membrane resistance and GDE proton resistance of sPAEEN based MEAs Operating conditions: j = 100 mA/cm2, anodic flow rate = 0.22 ml/(min*cm2); cathodic flow rate = 36 ml/(min*cm2), T = 70 °C, ambient pressure;
Impedance measurement: F = 0.25 Hz – 50 kHz; U = 0.01 V (AC)
The figures show that high pressing temperatures are disadvantageous for the preparation of sPAEEN based MEAs. Due to the temperatures and the drying out, the membrane resistance and the proton resistance of the GDE increases, which leads to a decrease of the electrochemical performance. Nevertheless a pressurized MEA assembling at low temperatures is advantageous. The membrane resistance and the proton resistance of the GDE can be reduced which leads to an enhanced electrochemical performance.
Conclusion
In this paper two different types of sulfonated poly(aryl ether ether nitrile)s - sPAEEN membranes were discussed regarding their suitability for a DMFC system. It was shown, that by applying the membranes in an MEA without any optimized assembling step, the electrochemical performance is lowered by about ~3 % compared to a Nafion 115 based MEA. But the implementation of the sPAEEN membranes leads to a decrease in methanol permeation, resulting in higher methanol utilization. In addition, the amount of water permeating through the MEA is reduced, which results in a lower amount of water which has to be cycled within the DMFC system to obtain a closed water cycle. In terms of optimizing the assembling procedure different hot-pressing steps were discussed. It could be shown that a pressurized assembling leads to enhanced electrochemical performances of the MEAs. The MEA assembling at high hot-pressing temperatures leads to lower electrochemical performances because of higher membrane resistances and higher GDE proton resistances compared to a MEA assembling at low temperatures.
Acknowledgments
Financial support from the German Federal Ministry of Economics and Technology (contract number 0327853A) and from the National Research Council Canada is gratefully acknowledged.
References
1. Mergel, J., Glüsen, and Wannek, W.: Hydrogen and Fuel Cells: Fundamentals, Technologies and Applications; D. Stolten (Ed), Wiley-VCH, Weinheim (2010) 2. Neburchilov, V., Martin, J., Wang, H., Zhang, J.; A review of polymer electrolyte
membranes for direct methanol fuel cells; Journal of Power Sources 169 (2007) 221-238
3. Eccarius, S., Garcia, B., Hebling, C.; Experimental validation of a methanol crossover model in DMFC application; Journal of Power Sources 179 (2008) 723-733
4. Gao, Y., Robertson, G., Kim, D., Guiver, M., Mikhailenko, S., Li, X. and Kaliaguine, S.; Macromolecules 40, 1512 (2007)
5. Kim, D., Kim, Y., Guiver, M., Pivovar, B.; High performance nitrile copolymers for polymer electrolyte membrane fuel cells; Journal of Membrane Science 321 (2008) 199-208
6. Gao, Y., Robertson, G., Guiver, M., Mikhailenko, S., Li, X., Kaliaguine, S.; Low-swelling proton-conducting copoly(aryl ether nitrile)s containing naphthalene structure with sulfonic acid groups meta to the ether linkage; Polymer 47 (2006) 808-816
7. Robertson, G., Guiver, M., Mikhailenko, S., Li, X., Kaliaguine, S.; Copoly(aryl ether ether nitrile)s Containing Sulfonic Acid Groups for PEM Application; Macromolecules 38 (2005) 3237-3245
8. Kim, Y., Kim, D., Liu, B., Guiver, M., Pivovar, B.; Copoly(arylene ether nitrile)s - high performance polymer electrolytes for Direct Methanol Fuel Cells; Journal of The Electrochemical Society 155 (2008) B21-B26
9. Kim, Y., Pivovar, B.; The Membrane-Electrode Interface in PEFCs; Journal of The Electrochemical Society, 157 (2010) B1616-B1623
10. Kim, Y., Pivovar, B.; The Membrane-Electrode Interface in PEFCs- A Method for Quantifying Membrane-Electrode Interfacial Resistance; Journal of The Electrochemical Society, 154 (2007) B739-B744
11. Kim, Y., Einsla, M., McGrath, J., Pivovar, B.; The Membrane-Electrode Interface in PEFCs-Impact on Fuel Cell Durability; Journal of The Electrochemical Society 157 (2010) B1602-B1607
12. Kim, Y., Pivovar, B; The Membrane-Electrode Interface in PEFCs- The Effect of Methanol Concentration in DMFCs; Journal of The Electrochemical Society 157 (2010) B1608-B1615