LIBRARY OF THE
MASSACHUSETTSINSTITUTE
ALFRED
P.SLOAN
SCHOOL
OF
MANAGEMENT
uewey
MASS. INST.TECH.
JAN
26
1371DEWEYLIBRARY
Control Theory inBrazilian Organizations
GeorgeF. Farris and D. Anthony Butterfield '•
RECEIVED
Abstract
The distribution of control was examined in 16 Brazilian development
banks using Tannenbaum's (1968) "control graph" model. Contrary to the
hypothesis of the "authoritarian Latin American" organization, control in
these organizations was distributed quite evenly among hierarchical levels.
Total control, control by upper hierarchical levels, and control by the
national bank in the state-federal system were all associated with bank
effectiveness. Bankeffectiveness was especially associated with each
level's control in the phase of project decision making for which it was
most responsible. A "competence" hypothesis viewing effective development
banks as "technocracies" was suggested to explain these findings.
An important aspect of all social organizations is the coordination of
member behavior through a pattern of authority relations. "Control" has
been defined by Tannenbaum (1968, p. 5) as "...any process in which a group
of persons or organization of persons determines, that is intentionally
affects, the behavior of another person, group, or organization." Control
in an organization may vary in two important characteristics: total amount
of control in the organization, and distribution of control amongmembers at various levels in the organization's hierarchy. In an organization with a
high amount of total control, members engage in more frequent attempts to
influence behavior than do members of an organization with a low amount of
control. In an organization with a relatively equal distribution of control,
members at all levels have about the same effect on behavior; in an
organiza-tion with a relatively unequal distribution of control, members at certain
hierarchical levels affect behavior more than do members at other levels.
"Democratic" organizations are often said to be characterized by a relatively
equal distribution of control among hierarchical levels, while "authoritarian'
organizations are often said to be characterized by unequal distributions
of control, with greatest control occurring at upper levels of the hierarchy. Tannenbaum (1968) and his colleagues have conducted a series of studies
of control in organizations utilizing the "control graph". In these studies,
members of an organization report on a Likert-type questionnaire item, how
much influence they perceive people at different hierarchical levels have on
control at each level are then averaged, and a "control graph" is constructed
to show the amount of control exerted at each level in the organization. Using control graphs, Tannenbaum has investigated two broad hypotheses:
1) The greater the total control in an organization, the more effective the organization will be, and
2) The more evenly control is distributed in an organization, the more effective the organization will be.
In several hundred organizational units, the first hypothesis has received
considerable support, while the second has not.
As with most empirical research on organizations, Tannenbaum's work
was based chiefly on organizations situated in the United States. Currently,
however, he is directing aprogram of research on organizations in other
countries. In one country where a body of research on control is emerging
—
Yugoslavia
—
, the findings regarding total control and effectiveness areconsistent with Tannenbaum's first hypothesis (see Kavcic, Rus, & Tannenbaum,
1971; and Mozina, Jerovsek, Tannenbaum, & Likert, 1970). Moreover, consistent
with the egalitarian philosophy underlying the Yugoslavian workers' councils,
control was found to be distributed relatively equally (see also Zupanov &
Tannenbaum, 1968).
In the present study the distribution of control is investigated in 16
Brazilian financial institutions. These banks serve as agents in anational
"network" of financial institutions in Brazil which makes loans to small and
medium-sized enterprises. Nearly all the banks are associated with their
state governments. At the apex of the system is the national development
bank, which repasses money to the state and regional banks, which, in turn,
loan money to borrower firms for development projects. Applications for
national bank to assess the technical quality of the proposed project,
qualities of the firm, and contribution of the project to economic
develop-ment. The completeness of the review at the national bank depends on the
size of the proposed project. This program of development loans constitutes
only a portion
—
albeit a significant one in most cases—
of the total business of the national bank and the regional banks.These characteristics of the financial institutions allowed us to extend
control graph theory to explore two areas not yet subjected to empirical
inves-tigation, even in the United States: the distribution of control at various
stages in the process of making decisions on loan applications, and the
amount of control exerted by a federal-government institution in a program
involving state governments. More specifically, we explored three areas of
interest
:
1. Control graphs of Brazilian organizations.
a. How do the control graphs of these Brazilian financial institutions compare with those of various organizations in the United States and Yugoslavia?
b. How does total control relate to the effectiveness of these Brazilian financial institutions?
c. How does the distribution of control amongvarious levels in the organizations relate to organizational effectiveness?
2. How does control by various hierarchical levels in the region-al banks relate to bank effectiveness when control is considered separately for three phases of the process of decision making on loan applications:
a. Determining methods of analysis and control of projects?
b. Evaluating projects?
c. Approving projects?
3. How does control by the federal-government bank in the federal-state loan program relate to the effectiveness of the state banks'
METHOD
Participants in the study were 25 presidents and directors, 51
depart-ment chiefs, 43 technical supervisors, and 156 technical personnel from 16
banks. Most participants were university graduates, with degrees in law,
economics, engineering, or accounting. All were involved in the development
loan program. The number of technical personnel who participated in the
study from each bank ranged from 3 to 25, with a median of 8. Data from
department heads and technical supervisors were combined when they were
found to be quite similar. For these middle managers, the median number
per bank was 5.5, with a range from 3 to 11.
Control was measured, following Tannenbaum (1968), by asking
partici-pants:
How much influence do the groups, persons, and institutions listedbelow have in the functioning of your institution as an agent of (name of loan program)
?
Six parties were listed: a) the national bank, b) the top management of your
institution (president and directors), c) department chiefs, d) technical
supervisors, e) technical personnel, and f) you yourself. Participants were
asked to check one point for each party on a five-point scale ranging from
"little or no" influence to "very great" influence.
Following an identical format, participants were also asked how much
influence each group:
—
ought to have—
had in determining methods of analysis and control of projects'
—
had in evaluationof projects
—
had in approval of projects.concern that ourmeasurements of control in this study might be more associated
with the individuals who reported on control than with the banks onwhich
they reported. Tannenbaum (1968, p. 24) points out that "To the
extent that errors of measurement are not random" (_i. e., are associated
with the individual participants more than with the organization they are
describing^) , "we are probably moving from a measure of organizational
control to ameasure of perceived organizational control."
Analyses of variance were carried out with the measures of control.
They indicated substantial differences in the amounts of control reported
by participants from different hierarchical levels (see below). Therefore,
data from different levels in the same bank were not combined to produce
measures of control for each organization.
Examining the data from technical personnel only, the variance between
banks was greater than the variance within banks for 21 of 25 (parts a - e
of the five control questions) measures of control, including 9 significant
at the .05 level of confidence. Of the five measures of control referring
to "you, yourself," which would be expected to be most associated with the
individual participants, three showed greater differences within banks than
between them, and the F-ratios in the other two cases were only l.T. Thus,
despite the small number of participants from each bank, our measures of
or-ganizational control were generally more associated with the organization
described than with the individual participants.
Bankeffectiveness was measured by asking four experts from the National
Bank to rank order those banks with which they were familiar on "overall
effectiveness as a development bank." (See Beals, 1970, and Farris &
Butter-field, 1971, for details.) Median intercorrelation among the judges was 0.77,
be-tween this ranking of overall effectiveness and several other possible
indicators of bank performance are shown in Table 1. Correlations are all Insert Table 1 about here
positive, but low enough to indicate that bank ettectiveness is not a
uni-tary concept. (Intercorrelations among these other indicators of
effective-ness were of similar magnitude. Control generally related to these other
indicators of effectiveness in amanner quite consistent with the ways in
which it related to the ranking on overall effectiveness.)
RESULTS
Control graphs of Brazilian organizations
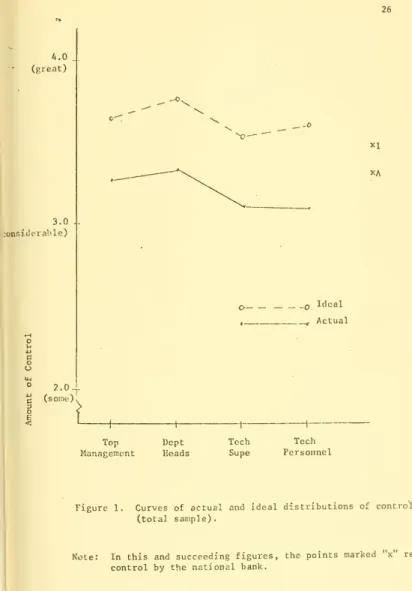
Figure 1 shows the actual and ideal distributions of control for all Insert Figure 1 about here
16 financial institutions. It is based on the average scores of the 275 participants in response to the questions about how much influence each party
has and ought to have in bank operations as an agent of the loan program.
In general, each hierarchical level within the banks was seen as exerting "considerable" to "great" influence, with top management and department
heads having slightlymore influence than technical supervisors and technical
personnel. The curve of the "ideal" distribution of control was roughly parallel
to the curve of "actual" control, and almost half a point higher on the
five-point scale. Participants think there should be more control than there is.
These results are quite consistent with those reported for several U. S.
organizations in Tannenbaum (1968).
If one were to predict the slope of the control graph for these
Bra-zilian organizations, he would be likely to expect to find a steeply sloped
control curve, with upper hierarchical levels having substantially more
con-trol than lower levels. Informed observations of other aspects of Brazilian
society suggest such a prediction. (See, for example, Skidmore, 1967, pp. 318-31?
on the Brazilian political system; Lauterbach, 1966, pp. 8-9, on industrial
Bra-zilian family)
.
The curves of actual and ideal control in Figure 1, however, are contrary
to the notion of an authoritarian distribution of control in these govern-ment organizations. The slopes of both curves are quite flat. In fact,
both the actual and ideal control graphs are more similar in slope to those of
Yugoslav organizations, with their egalitarian workers' councils (see Kavcic,
Rus, & Tannenbaum, 1971, and Zupanov & Tannenbaum, 1968), than they are to
either the League of Women Voters (actual control) or a delivery company
in the United States (see Tannenbaum, 1968, p. 65 and p. 78).
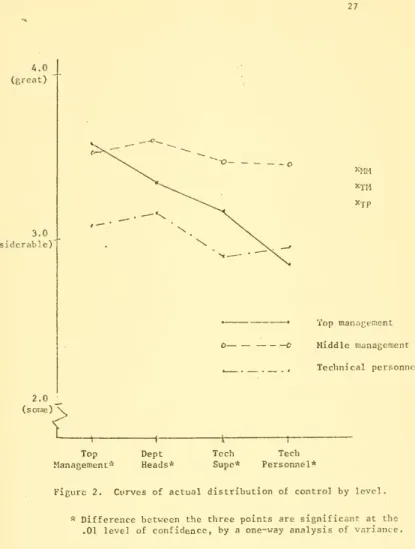
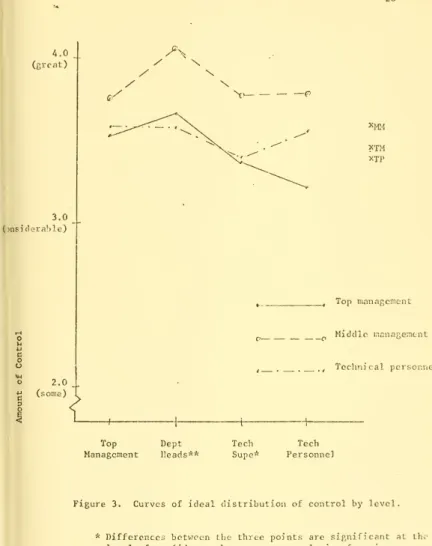
When actual and ideal curves of control were plotted separately for each
level of respondent, signific ant differences occurred. (See Fig ures 2 and 3.) Insert Figures 2 and 3 about here
Top management saw control as distributed quite unevenly, with upper levels
having the most control. They felt that ideally all levels but their own
should have more control. Middle managers reported the highest total control,
and saw control as distributed most equally among hierarchical levels. They
felt that ideally every level, especially department heads, should have more
control. Technical personnel reported the lowest total control, and they also
saw control as distributed quite evenly among levels. Like the middle
managers, they felt that all levels should have more control.
Control and bank effectiveness
Tannenbaum (1968) argues that organizations with more total control and
with amore even distribution of control will be more effective. Table 2 shows Insert Table 2 about here
relationships between the effectiveness of the regional banks (as rated by
experts from the national bank) and control. Total control as seen by
tech-nical personnel is significantly related to bank effectiveness (rho=.56, p<.05).
and total control as seen by middle managers is related to effectiveness in the
predicted direction, but not significantly (rho=.30).
10
also related to bank effectiveness. For the technical personnel data, control
exercised by middle managers (department heads and technical supervisors)
was most strongly associated with bank effectiveness. For control as seen
by middle managers, the control exercised by top management was related most
strongly to bank effectiveness. In short, banks were more effective when
technical personnel and middle managers saw the hierarchical level immediately
above them as exerting more control.
Rank-order correlations between bank effectiveness and four measures of
the evenness of distribution of control are shown in Table 3. None of these Insert Table 3 about here
indications of the evenness of the distributions of control is related to bank
effectiveness
.
Thus, total control is related to bank effectiveness as Tannenbaum
predicts, but banks are not more effective when control is distributed more
evenly. Analysis of the control exercised by individual levels suggests that
control exercised by the upper hierarchical levels is most strongly related to
bank effectiveness, contrary to U. S.-based theories which emphasize that
dele-gation to lower levels leads to organizational effectiveness.
Control in different phases of decision making
Table 4 shows relationships between bank effectiveness and control at Insert Table 4 about here
three phases of the process of decision making on loan applications. (Data
shown are from technical personnel only; results with data from middle managers
were similar.) Neither total control nor the evenness of distribution of
control was related to bank effectiveness. However, an interesting phenomenon
occurredwhen control in each phase was examined separately for each hierarchical
level. For each phase, a significant relationship was found between bank
effectiveness and the control exerted by the level one would expect to be most
responsible for that phase. Department heads are most responsible for
11
related to bank effectiveness. Technical personnel are most responsible
for project evaluation, and their control in this phase was significantly
related to bank effectiveness. Finally, topmanagement is most responsible
for final approval of projects, and their control in this phase was
signifi-cantly related to bank effectiveness.
In short, this analysis of control in different phases of the
decision-making process indicated that banks aremore effective when each level exerts
more control in performing the task forwhich it is most responsible.
National bank control
So far we have examined the distributions of control within individual
organizations. Consistent with Tannenbaum's (1968) model, we found that more
effective banks had .higher total control. These banks function as agents in a
federal-state system of financial institutions which administer a program of
loans for private enterprise. How does the control exerted by the federal
government institution in these inter-organizational relations relate to the
effectiveness of the state-associated institutions? (Or, if revenue-sharing
ever becomes areality in the United States, does the Brazilian experience
with repass programs suggest any lessons to be learned?)
Although control-graph theory does not deal directly with the problem
of inter-organizational relationships, it could be inferred from the theory
that greater control by the federal government institution should be associated
with greater effectiveness of the state-associated organizations. Viewed
simply, greater control by the federal organization increases total control,
and total control is associated with effectiveness.
Table 5 shows relationships between bank effectiveness and control exerted Insert Table 5 about here
by the national bank. As expected, in the more effective banks, technical
personnel see the national bank as having more control in their functioning
12
bank effectiveness was rated by experts from the national bank, who
them-selves are involved in administering the loan program. Conservatively
inter-preted, this correlation means that people from the national bank rate more
highly those regional banks in which they have more influence themselves.
To reduce the effects of this possible bias, national bank control was
related to two other indicators of regional bank effectiveness: a rating by
borrowers from 10 regional banks of the effectiveness of their banks, and the
number of development projects in the loan program approved during the past
year. Relationships between national bank control and these indicators of
effectiveness were in the same direction, but weaker. The borrower rating of
regional bank effectiveness was strongly associated with national bank
con-trol in the separate phases of decision making on proposed projects.
Thus, these trends indicate that in inter-organizational relations, as
well as in intra-organizational decision making, greater control is associated
with greater effectiveness. In the program of development loans, the more
effective banks appear to be characterized by both greater control within them
and greater susceptibility to control from the national bank. This finding
is highly consistent with Likert's (1967) notion that more effective management systems are characterized by higher mutual influence among the organizational
units involved.
CONCLUSIONS
Let us briefly summarize some highlights of this study of control in
Brazilian financial institutions.
1. Contrary to the concept of the "authoritarian Latin American organization", both the actual and ideal control curves in these Brazilian
banks were quite flat, indicating a relatively equal distribution of control.
Differences did occur according to the level of the respondent, however, with
13
2. Total control was positively associated with bank effectiveness.
3. The evenness of the distribution of control was unrelated to bank
effectiveness.
4. Bank effectiveness was especially related to control by the
immediate superiors of those reporting on control (i. e., control by top
managers for control as seen by middle managers, and control by middle
managers for control as seen by technical personnel). Control by technical
personnel was unrelated to bank effectiveness.
5. Bank effectiveness was especially related to the control exerted by the party most responsible in aparticular phase of decision making
—
department heads in determining methods, technical personnel in evaluation,and top management in approval
.
6. Control by the national bank was associated with regional bank effectiveness.
It must be cautioned that these conclusions are based upon only 16 organizations, and a small number of participants at each level in each
organ-ization. I-rtiether these differences would occur for different types of
Bra-zilians working in different organizations on different tasks (e. g., factory
workers) is a questionwhich should be subjected to further empirical research.
Three aspects of these findings deserve special comment: the extensions
of control graph theory, the distribution of the control, and the relationships
between control and effectiveness.
Control graph theory. This study can be added to the increasing body of
research which demonstrates the value of Tannenbaum's control graph theory.
His approach was used successfully in Brazil, and the major hypothesis
regard-ing total control and effectiveness was supported. The extension of the theory
to phases in decision making led to a coherent explanation of the relationship
14
of the theory to inter-organizational relations produced results consistent
with the theory's non-zero-sum assumptions about control. The study of
the distribution of control in inter-organizational relations appears to be
a fruitful one for further work.
Distribution of control. The relatively even distribution of control
found in these organizations was contrary to the authoritarian distributicn
of control predicted by sociological, historical, political, journalistic,
and anthropological observers of Brazilian society. This incorrect prediction
could mean that these observers were not so insightful in their comments on
industrial organizations, the political system, or the family as the consensus
among them indicates. Or alternatively, the development finance institutions
could be quite different from these other Brazilian social organizations,
perhaps reflectingnewer directions in Brazilian society more than the
tradi-tional. The latter explanation appears more attractive, although some
journalists, political scientists, or sociologists may have relied too much
on higher organizational echelons for their information about the distribution
2
of control. Recall that the presidents and directors of the organizations
in the present study saw control as distributed in a relatively authoritarian
manner.
If these development finance institutions are in fact organized differently
from other Brazilian organizations, it suggests that the traditional social
structures in a society are not always good predictors of the modern. Moreover,
the apparent success of these organizations in fostering economic development
suggests that other organizations within Brazil and other developing countries
might operate more effectively if control in them were distributed in a more
egalitarian manner. The relationships between control and effectiveness
15
Control and effectiveness. The more effective development finance
insti-tutions were characterized by greater total control in their operations.
Despite the relatively evendistribution of control among levels, effectiveness
related more strongly to the control exercised bymanagers at upper hierarchical
levels than to control exercised by technical personnel. The following
hypothesis may help to explain these findings:
Performance = f(control, competence).
An organization is more effective when it has members who have the competence
required for the task at hand, and these members have the control necessary
to perform that task effectively. This circular reasoning is especially relevant to developing countries and tasks of greater uncertainty, where
everyone who is asked to perform a task may not have the technical competence
required for effective task performance. In the Brazilian development banks,
the projects to be evaluated are complex and competence outside the banker's
field of professional training is required.
Some of the people at lower levels have the necessary competence, but
others do not. Therefore, on the average, control exercised by technical
personnel is not associated with bank effectiveness. Those at managerial
levels aremore apt to have the required competence; thus, control exercised
by these more competent people is more apt to be associated with bank
effec-tiveness. Some past research (Farris, 1969; Farris and Lim, 1969) has shown
that competent performance is followed by greater influence, which in the case
of thebanks may take the form of promotion to the managerial level.
In a developing country such as Brazil, there may be a tendency to spread
resources
—
especially competent people—
too thin. As a consequence, not enough control is exercised in making important decisions. To oversimplify, insuch a situation, the issue is control versus no control, more than authority
16
bank effectiveness and total control, but not between effectiveness and
evenness of the distribution of control. Control at upper levels of management
is better than lack of control. When competent people are at apremium, a major challenge for managers is to place them in situations in which they
"I
can exercise more control on decisions important to the organization.-^
In short, the effective development finance institution in Brazil
appears to be not an"autocracy" or "democracy" but a "technocracy"
—
a system organized in such away that people are assigned to tasks forwhich theyhave the technical competence to perform. Major responsibilities for
tasks (in this case, different aspects of decision making on loan applications)
are clearly assigned to different levels in the organization, and the
influence of each level on the task forwhich it is most responsible is
associated with effectiveness. The resulting situation is one in which
there is "rule at the top" and rule at other levels in the organization
as well. Andmore important than simply "rule at the top of the organization"
appears to be "rule at the top of the technocracy"
—
the exercise of control by those who have the competence required for the tasks for which they are17
1. Research was supported by Grant 670-0122A to the Banco Nacional Desenvolvimento Economico and the Massachusetts Institute of
Technology from the Ford Foundation. The authors gratefully
acknowledge the comments and suggestions of Allen I. Kraut, Aroldo
Rodrigues, Arnold Tannenbaum and members of the Workshop in
Organ-izational Behavior, Graduate School of Business, University of
Chicago.
2. This observation was made by the Brazilian social psychologist Aroldo Rodrigues.
3. A second challenge is to develop more people who have the competence required for the task at hand. Graduates of two-month training
courses in "development banking" developed by the National Development
Bank and MIT, reported that they had significantly more control in
the operations of their banks as agents of the loan program than did
18
REFERENCES
Beals, A. L. Relationships between control and effectiveness in Brazilian
development banks. Unpublished M. S. thesis, M. I. T,, 1970.
Farris, G. F. Organizational factors and individual performance: a
long-itudinal study. Journal of Applied Psychology, 1969, _53, pp. 87-92.
Farris, G. F., & Butterfield, D. A. Are current theories of leadership
culture-bound? An empirical test in Brazil. Sloan School Working
Paper 529, 1971.
Farris, G. F., & Lim, F. G,, Jr. Effects of performance on leadership,
cohesiveness, influence, satisfaction, and subsequent performance.
Journal of Applied Psychology, 1969, 53, PP- 490-497.
Freyre, G. Casa Grande & Senzala, (Rio (}e Janeiro, 1938). Translated as:
The Masters and the Slaves, by Putraan, S., New York: Alfred A. Knopf, Inc.
1946.
Kavcic, B., Rus, V., & Tannenbaum, A. S. Control, participation, and
effec-tiveness in four Yugoslav industrial organizations. Administrative
Science Quarterly, 1971, J|_6, pp. 74-86.
Lauterbach, A. Enterprise in Latin America, Ithaca: Cornell University
Press, 1966.
Likert, R. The human organization: its management and value. New York:
McGraw-Hill, 1967.
Mozina, S., Jerovsek, J., Tannenbaum, A., & Likert, R. Testing a management
19
Skidmore, T. E. Politics in Brazil, 1930-1964, London: Oxford, 1967.
Smith, T, L. Brazil: People and institutions. third edition, Baton Rouge:
Louisiana State University Press, 1963.
Tannenbaum, A. S. Control in organizations. New York: McGraw-Hill, 1968.
Zupanov, J. & Tannenbaum, A. S. The distribution of control in some Yugoslav
industrial organizations as perceived by members. In Arnold S. Tannenbaum
20
Rank Order Correlation Between Judged Overall Effectiveness and
Borrower rating .A9
Number of projects .57""
Processing speed .20
Quality of project appraisal
(Banks ranked by same judges) .85*
MonCiV rep.nsoer' to bank .09
Chrfnge in effectiveness
(Rated by sanie judges) ,32
OA'crall effectiveness in previous year (Banks ranked previously
by 3 of the A judges) .91*
Total assets .]7
Technical personnel satisfaction .51«
Middle manager satisfaction .52->
Employee rating of bank effectiveness .02
* p^.05
*** p<^.001
Table ].Correlations between "overall effectiveness" and other indicators of bank performance.
21 Measure of Control Total control Top management Dept. heads Tech. supes. Tech. personnel
Correlation Between Effectiveness And Control as Seen by
Measure of Slope
22
Correlation Betv;een Effectiveness
andDistribution as Seen by
Technical Personnel
Middle Manar-ers
Variance from grand mean
Per cent to partyV7ith highest control
Per cent to party with lovjest control ,07 -.11 ,22 -.05 -.19 .33
Per cent difference between liighcst and
lowest groups 17 .32
Table 3. Rank order correlations betweenevenness of distribution of control and bank effectiveness. (N= 15 banks.)
23
Correlation Betv/ecn Effectiveness and Control in
Determining
Methods Evaluation Approval
Measure of Control Total control .34 .37 .13 Top managcTiient .11 ,21 .57** Dept. heads .54* .22 .31 Tech. supes. -.07 .28 .04 Tech. personnel .12 .50* .17 Slope (Variance from grand mean) .04 -.12 .27
* pcL.Ob (one-tailed test)
'" p,£,.01 (one-tailed test)
Table 4. Rank order correlations between control at different stages of
decision-making and bank effectiveness. (H--15 banks; data from technical i-c-.rsonncl
24
Correlation Between Effectiveness
and National Bank Control
As Determining
Agent Methods Evaluation Approval
Measure of Effectiveness
25
Figure Captions
Figure 1. Curves of actual and ideal distributions of control
(total sample)
.
Note.- In this and succeeding figures, the points marked "x"
refer to control by the national bank.
Figure 2. Curves of actual distribution of control by level.
^.0 (great) 3.0 -I ;onsicjprable) ° 2.0 ^ (some)! 3 Top Management Dcpt Heads XA _Q Ideal . Actual Tech Supe Tech Personnel
Figure 1. Curves of actual and ideal distributions of control (total sample).
Note: In this and succeeding figures, the points marked "x" refer to control by the national bank.
27 A.O (great) 3.0 (considerable) 2.0 (some )
I
^
xxM X.pp—
' Top mar.ri^en'.ent —C Middlenianagenient , Teclinical personnc Top ManagemeriL-Dept Heads* Tech Supc-' Tech Personnel*Figure 2. Curves of actual distribution of control by level
Difference between the three points are significant at the
28
4.0 (great)
3.0
(nisideraille)
o 2.0 ^ (some)
{
XMi^ XTM XTp Top nianngcmenL Middle riannge;nent . ,, Technical personnel Top Dept Management Heads** Tech Tech Supe* Personne]Figure 3. Curves of ideal distribution of control by level.
* Differences bctv;een the three points are significant at thf .05 level of confidence, by a one-way analysis of variance.
''• Differences between the tlu'ce points are si;',nificant at the .0] leve] of confidence, by a one-way a\ialysis of variance.
Date
Due
DEC3 f§TEB
18M
OCT*'T* NOV133i ^i^-^I 3