HAL Id: halshs-01440519
https://halshs.archives-ouvertes.fr/halshs-01440519
Submitted on 19 Jan 2017
HAL is a multi-disciplinary open access archive for the deposit and dissemination of sci-entific research documents, whether they are pub-lished or not. The documents may come from teaching and research institutions in France or abroad, or from public or private research centers.
L’archive ouverte pluridisciplinaire HAL, est destinée au dépôt et à la diffusion de documents scientifiques de niveau recherche, publiés ou non, émanant des établissements d’enseignement et de recherche français ou étrangers, des laboratoires publics ou privés.
Fertility Analysis with EU-SILC: A Quantification of
Measurement Bias
Angela Greulich, Aurélien Dasré
To cite this version:
Angela Greulich, Aurélien Dasré. Fertility Analysis with EU-SILC: A Quantification of Measurement Bias. 2017. �halshs-01440519�
Documents de Travail du
Centre d’Economie de la Sorbonne
Fertility Analysis with EU-SILC: A Quantification
of Measurement Bias
Angela G
REULICH,Aurélien D
ASRÉFertility Analysis with EU-SILC: A Quantification of Measurement Bias
Angela Greulich$, Aurélien Dasré* October 2016
The European Union Statistics on Income and Living Condition (EU-SILC) database is increasingly used in demographic analysis, due to its large country coverage, the availability of harmonized socioeconomic measures and the possibility to merge partners. However, so far there exists no comprehensive analysis of the representativeness of fertility behavior reported by EU-SILC. This paper quantifies the quality of fertility measures in EU-SILC. We compare several fertility measures obtained with EU-SILC to unbiased measures from the Human Fertility Database (HFD) for several European countries, by applying a longitudinal as well as a cross-sectional perspective. We show that EU-SILC underestimates completed fertility mainly because the questionnaire does not ask about the number of children ever born to a woman/man, and we identify significant socioeconomic differentials in this measurement bias. Measures of periodic fertility behavior are biased downward mainly due to attrition, while births of order one for ages 20-29 are particularly underreported. However, we find no evidence for socio-economic differentials in attrition. Our results suggest that for the majority of European countries, EU-SILC can be used for demographic analysis when respecting the measures of precaution mentioned in this article. These contain for example applying a retrospective approach and differentiating by rotation groups when calculating aggregate measures of periodic fertility differentiated by socio-economic groups.
The data used in this study are from the European Commission, Eurostat, the European Statistics on Income and Living Conditions (EU-SILC), its French version (SRCV), and the Human Fertility Database (HFD). The providers have no responsibility for the results and conclusions of the authors.
$
Centre d’Economie de la Sorbonne and Ined. * Cresppa-GTM Université Paris Nanterre and Ined.
1. Introduction
The European Statistics of Income and Living Conditions (EU-SILC) is becoming increasingly popular in socioeconomic as well as demographic analysis. Its main advantage is its large country coverage, with a provision of harmonized socioeconomic measures for both individuals and households.
SILC is mainly used for economic analysis, while researchers use demographic information (such as the number of children present in the household) as controls. However, SILC is also used more and more for demographic analysis, and in particular for fertility research, as the large international sample allows both marginal effects to be modeled and institutional determinants to be taken into account.
SILC provides not only cross-sectional data but also a follow-up of individuals and households, albeit for only a relatively short period (see the Box for more detailed information about the database). Therefore, SILC is used not only for measuring household size but also for modelling determinants (and/or consequences) of childbearing behavior. The follow-up actually helps limit the risk of endogeneity, as individual and household characteristics can be observed during a certain period before the potential conception of a child.
SILC-based studies on household size are, for example, Baizan, Arpino and Delclos (2014), who analyze the impact of female education on the number of children of women aged 40. D’Albis, Gobbi and Greulich (2016) as well as Greulich et al. (2016) use measures of approximate completed fertility (i.e. the number of children of women aged 38-44) to identify the birth order that is most responsible for fertility differences between European countries.
SILC-based studies on socioeconomic determinants of timing and intensity of childbirth, differentiated by birth order, have been conducted, for example, by D’Albis, Greulich and Ponthière (2016), Rendall and Greulich (2015), Nitsche, Matysiak, Bavel and Vignoli (2015), Matysiak, Sobotka and Vignoli (2016), Klesment, Puur, Rahnu and Sakkeus (2014), Rendall et al. (2014) and De Santis, Drefahl and Vignoli (2012).
However, both completed and periodic measures of fertility risk being biased in SILC. Measures of completed fertility are likely to be biased mainly due to the fact that children are only observed when living in the households of respondents. Measures of periodic fertility behavior are likely to be biased due to sample selection (underrepresentation of childless individuals who are “at risk of having”, i.e. likely to have a child) and attrition. It is possible that attrition is directly linked to fertility, as child birth (be it planned, expected or completed) might cause the individual or household to move, which implies a risk of losing respondents.
These biases cause problems if the individuals for whom fertility measures are biased have particular socio-economic characteristics. In this case, not only descriptive but also econometric analyses would suffer from distortion.
So far, few studies have addressed the issue of measurement bias in fertility in SILC (De Santos et al., 2014, for example, for Italy), but their quantifications are not systematic and they only focus on one country.
This paper quantifies the quality of fertility measures in the European Statistics of Income and Living Conditions (EU-SILC), for a large set of countries. We compare fertility measures obtained with SILC to unbiased measures from the Human Fertility Database (HFD) for several European countries, by applying a longitudinal as well as a cross-sectional perspective. We quantify the biases by age and birth order and analyze in how far they are linked with socioeconomic characteristics.
Description of the database
The European Union – Survey on Income and Living Conditions (EU-SILC) is a European survey provided by Eurostat. This survey was created in 2003 to replace the European Community Household Panel (ECHP) and now includes 31 European countries. Since then, Eurostat has released a new wave every year. The survey gathers harmonized and comparable data at the individual and at the household level on income and living conditions, as well as on many individuals’ demographic and socio-economic characteristics (sex, age, education, labor market position, parenthood etc.).
EU-SILC is composed of two datasets – one cross-sectional and one longitudinal. The annual cross-sectional data are produced from the longitudinal panel (integrated design). The longitudinal dataset of EU-SILC is a rotational panel of four years, which means that for the majority of countries, individuals are observed for a maximum period of four years. The integrated design allows for a large number of observations for the cross-sectional database. In the cross-cross-sectional database, ¼ of individuals are observed for the first time, ¼ for the second time, ¼ for the third time, and ¼ for the fourth time (as shown for ‘Time = T’ in the Figure). This integrated design reduces measurement bias due to cumulated respondent burden and sample attrition.
Source: Eurostat Guidelines for SILC, 2012
Some countries provide a follow-up for longer than four years (nine years in France, five or more years in some Eastern European countries). In contrast, there is no longitudinal database for Germany. The majority of countries joined the survey in 2004 and 2005, while several Eastern European and Mediterranean countries joined in later (Malta, Croatia, Romania, etc.).
The survey contains information on both individuals and households. It is possible to identify adult women, their partner – if they have one – and the children who live in the same household. EU SILC does not report information on the number of children directly. However, children are observed with a proper identification number when living in their parents’ households, and households are generally followed when moving as a whole. Individuals who leave their original household are, however, hard to follow, and this leads to problems of attrition.
EU-SILC provides information about education but also about individuals’ labor market status (reported on a monthly basis), and different types of income. This information is rarely available in other, more ‘demographic’ surveys. One exception is the Gender and Generations Surveys, but this survey has more limited country and time coverage (just three waves, and only the first wave is nationally representative). Other surveys such as the European Labour Force survey contain information on labor supply, but not on income. Some surveys exist that contain both demographic and economic variables, with individuals being tracked for more than only four years. But the limitation of these datasets is their national focus, since these long-run surveys are generally run in only one given country (the German Socioeconomic Panel or the American Panel Study of Income Dynamics for example).
To get a first idea of the extent to which fertility measures are biased in SILC, we use SILC to construct aggregate measures of fertility for each country. The cross-sectional samples of SILC can theoretically be used to calculate aggregates, as the country samples are designed to be nationally
representative probability samples of the population residing in private households within the country, irrespective of language or nationality. For each country, a minimum effective sample size is respected, and the personal cross-sectional weights of observed individuals (children included) sum to the real population size of each country.
To quantify the measurement bias, we compare the weighted fertility measures obtained from SILC with unbiased measures from the Human Fertility Database (HFD) and from the World Bank World Development Indicators (WB WDI) for 27 European countries.
The HFD also contains fertility measures by cohort and birth order, but they are only available for 10 European countries. They will nevertheless serve in our later analysis. The HFD-measures seem relatively unbiased as they are limited to populations where the registration of births by official statistical agencies is virtually complete and where population estimates over the range of reproductive ages are reliable.
To obtain an approximate measure of completed fertility with SILC, we observe the number of children of women of cohorts 1967 to 1973 in the cross-sectional database of 2011 (i.e. women aged 38-44). We do not observe women of higher ages as in the majority of European countries, SILC reports a decreasing number of children living with their mothers, from age 42 on. We consider more than one cohort in order to smooth cohort fluctuations and in order to obtain a sufficiently large sample size for each country. The SILC measure is compared to the unbiased measure of the number of children of women of cohort 1970, coming from the Human Fertility Database 2012, i.e. women aged 42.
To measure total fertility rates with SILC, we observe children born in 2010 in the cross-sectional database of 2011, for women aged 15+. To obtain the TFR, we calculate the sum of age-specific fertility rates for each country. We compare this measure to the total fertility rates for 2010, given in the World Bank’s World Development Indicators.
Figure 1: Measurement bias in completed and total fertility rates in SILC
TFR: SILC CS 2011 - children born in 2010, against WB WDI 2010.
Figure 1 illustrates the relative measurement bias for both approximate completed and total fertility rates for each country.1 SILC underestimates completed fertility in all countries but Slovenia, while the underestimation is highest in Luxembourg, Norway, Belgium, Denmark and France. The arithmetic mean of the relative difference between the SILC derived CFR and the unbiased CFR is 11%.
SILC underestimates total fertility rates in most European countries except Switzerland, Iceland, Luxembourg, Austria and Sweden. The downward bias is highest in Bulgaria, Greece, Lithuania and Germany. The arithmetic mean of the relative difference between the SILC derived TFR and the unbiased TFR is 14% (in absolute terms).
It should be noted that our method for calculating total fertility rates, also called the “own children method” is known to underestimate total fertility rates, as between the date of birth and the time of the survey, some children may die and some children may no longer live with their mother. Omissions of newborn children by respondents can also lead to understating this measure. However, the underestimation caused by these factors is known to be very low in European countries (5% of children in France, for example; see Desplanques, 1993). Given the relatively large extent of the downward bias in total fertility rates in SILC, it is likely that the bias is caused by other factors, such as sampling selection bias and attrition.
The biases are quite heterogeneous between countries and fertility measures, and they seem not to be systematic. Countries with high biases in completed fertility are not necessarily those with high biases in total fertility rates. On average, the downward bias is more important for total fertility rates than for completed fertility. Countries with high fertility rates are not automatically the ones with the highest biases in SILC. The country classification in high and low fertility countries remains the same for the large majority of countries when using the SILC measures or the unbiased fertility measures. Exceptions occur only for those countries with fertility measures around the European mean. SILC identifies the same highest-high and lowest-low fertility countries as in the HFD and the WB WDI. The left-hand panel of Figure A in the Appendix shows that the SILC estimates tend to underestimate completed fertility rates, but the cross-national variation is highly consistent between the two series. The correlation coefficient between the SILC-derived CFR and the unbiased measure is 0.81. The right-hand panel compares SILC-derived TFRs with the unbiased TFR measures and, besides an underestimation, also illustrates a high consistency between the series. There are larger discrepancies in total fertility rates for only a few countries (Romania and Slovakia for TFR). Without Slovakia and Romania, the correlation coefficient between the two series is 0.85.
Besides quantifying the bias in aggregate measures of fertility, it is important to know if and how far the bias differs among individuals. It is possible that the bias differs not only with demographic but also with socioeconomic characteristics, as demographics are linked with socioeconomic variables such as education and income: this is especially so for women’s and their partners’ age and the number of children.
1
Romania and Slovakia are not included in the figure to make it more readable, as the downward bias in total fertility rates exceeds -50% (-73% in Romania and -64% in Slovakia). The downward bias in completed fertility is, however, relatively small in these two countries (-2% for Romania and -7% for Slovakia).
This article identifies individuals who are most concerned by the measurement bias in terms of fertility/number of children in SILC. It is organized as follows: in Section 2, we apply a longitudinal perspective for the measure of the number of children per woman. We first decompose the bias in the measure of the number of children by the mother’s age and by birth order. Then, we concentrate on children outside the household. We analyze the phenomenon of child departure in SILC and use the French module (SRCV), which contains a question about the number of children outside the household, to identify socioeconomic differentials in the measurement bias. In Section 3, we apply a cross-sectional perspective for the measure of child births observed in SILC. We analyze fertility-linked attrition and its socio-economic differentials and decompose the bias by age and birth order. Section 4 concludes and discusses some solutions to circumvent the biases.
2. Cohort analysis – the number of children
As only those children who are living in the mother’s household can be observed in SILC, the downward bias in the measure of the number of children is likely to increase with women’s age. The age from which the bias exists is likely to be influenced by women’s age at first childbirth, by the birth interval between children and by the age of de-cohabitation. All these factors are potentially linked to socio-economic characteristics.
2.1. Measurement bias by age and birth order
To decompose the measurement bias in the number of children by mother’s age and by birth order, we compare again the SILC-measures to those of the HFD.
Information by age and birth order is available for 10 countries in the HFD (Bulgaria, Estonia, Hungary, Lithuania, the Netherlands, Norway, Portugal, the Czech Republic, Slovakia and Sweden). At the time we conducted the analysis, the latest available year was 2009.
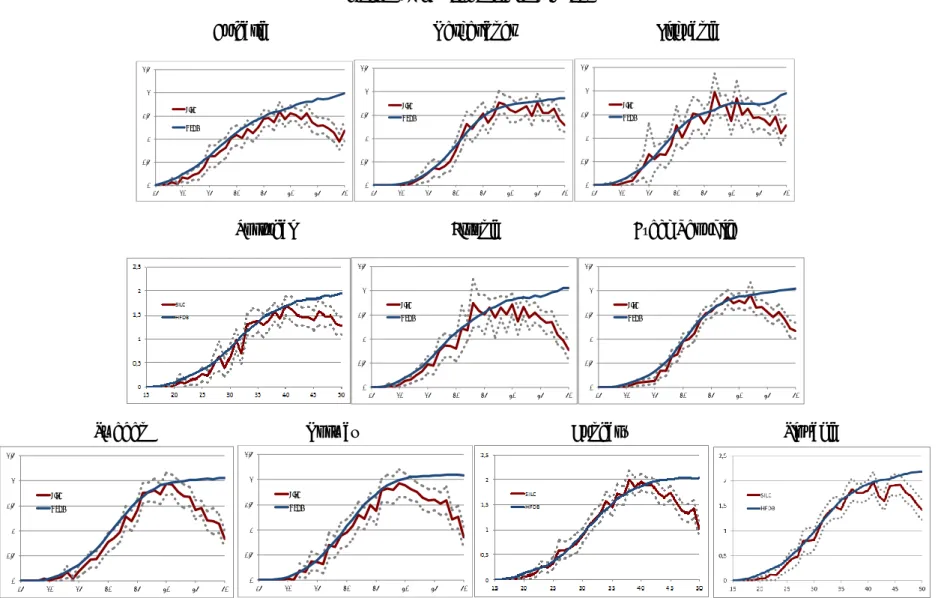
We first focus on the measurement bias in the number of children by mother’s age. We therefore use the age-specific fertility rates by cohort in the HFD. By applying a longitudinal approach, we calculate the sum of age-specific fertility rates until 2009 for each cohort between 1959 and 1994 (cumulative fertility rate). We approximate this measure with SILC (cross-section database of 2009) by observing the average number of children living with their mothers, by the age mothers had in 2009 (cohorts 1959 to 1994). By construction, this measure is lower than the HFD-measure, as it does not take into account children who had already died. Given the relatively low levels of infant-, child- and adolescent-mortality in Europe, this construction bias should however be relatively small. Figure 2 compares the SILC- and HFD-measure of the average number of children, by age, for women of cohorts 1959 to 1994, observed in 2009, for 10 European countries. SILC reports a lower number of children for all ages, but the SILC-measure is within the confidence interval for all 10 countries, until around the age of 40. This is the case for small countries with large confidence intervals like Lithuania, but also for large countries like Poland and Bulgaria. In all countries, the bias is increasing with age and significant from age 40 onwards. This suggests that the underestimation of the number of children in SILC is mainly caused by children who are unobserved, because they have already left their parents’ household.
Figure 2: Number of children by age
Bulgaria Netherlands Lithuania
Portugal Estonia Czech Republic
Sweden Norway Hungary Slovakia
SILC vs. HFD, women of cohorts 1959 to 1994, year 2009.
0 0,5 1 1,5 2 2,5 15 20 25 30 35 40 45 50 SILC HFDB 0 0,5 1 1,5 2 2,5 15 20 25 30 35 40 45 50 SILC HFDB 0 0,5 1 1,5 2 2,5 15 20 25 30 35 40 45 50 SILC HFDB 0 0,5 1 1,5 2 2,5 15 20 25 30 35 40 45 50 SILC HFDB 0 0,5 1 1,5 2 2,5 15 20 25 30 35 40 45 50 SILC HFDB 0 0,5 1 1,5 2 2,5 15 20 25 30 35 40 45 50 SILC HFDB 0 0,5 1 1,5 2 2,5 15 20 25 30 35 40 45 50 SILC HFDB
To shed more light on the issue of unobserved children in SILC, it is useful to distinguish between children of different birth orders. We therefore observe with SILC the proportion of women by age and birth order (x% of women of age y in 2009 have z children). To obtain a comparable measure with the HFD, we use the age-specific fertility rates by birth order. The sum of these rates gives the proportion of women having at least z children. The differences between these proportions then give the proportion of women having exactly z children.
Figure 3 illustrates these proportions exemplarily for Sweden. The proportions of the other nine countries do not differ much and can be found in Figure B in the Appendix.
Figure 3: Proportion of women in Sweden of age y who have z children (SILC vs HFD)
0 children 1 child
2 children 3 and more children
SILC vs. HFD,women of cohorts 1959 to 1994, year 2009.
Figure 3 shows that SILC overestimates the proportion of childless women for all ages. However, the differences only become significant from the age of 40 onwards, suggesting that child departures, and in particular departures of children who have no siblings, cause this bias. Women who have had their children at relatively early ages are particularly at risk of an underestimation of their number of children at age 40, as their children are already relatively old at that time period and start leaving the parental household.
As a consequence, children born first (birth order one) start being overestimated from age 40 on, and children of birth order two and more are underrepresented in SILC from age 40 on. These biases are the logical consequence of the departure of the first child, given the fact that few women have three or more children: a two-child family is identified as a family with only one child after the departure of the first child, causing the proportion of women having one child to be overestimated and the proportion of women having two children to be underestimated. If there was a large proportion of three child-families, child departure of the first child would lead to an overestimation of women having two children. The fact that the proportion of women having two-children is under- instead of
0 0,1 0,2 0,3 0,4 0,5 0,6 0,7 0,8 0,9 1 15 20 25 30 35 40 45 50 SILC HFDB 0 0,05 0,1 0,15 0,2 0,25 0,3 0,35 0,4 0,45 0,5 15 20 25 30 35 40 45 50 SILC HFDB 0 0,1 0,2 0,3 0,4 0,5 0,6 0,7 15 20 25 30 35 40 45 50 SILC HFDB 0 0,05 0,1 0,15 0,2 0,25 0,3 0,35 0,4 15 20 25 30 35 40 45 50 SILC HFDB
overestimated reflects the fact that families with three or more children are less representative than families with two children.
The extent of the measurement bias by birth order depends, however, not only on a country’s fertility level, but also on various other factors such as the age of de-cohabitation, the birth interval between siblings or the age of mothers at first childbirth. The interplay of these various factors potentially explains why on average, there are no important differences in the measurement bias by birth order, between the ten European countries.
In any case, the analysis shows that the fact that children who already left the household are unobserved in SILC leads not only to an underestimation of completed family size, but also to an incorrect attribution of birth orders for those siblings who continue living with their parents.
Figure 4 presents the absolute contribution of the over-/underrepresentation of each birth order in SILC to the downward bias in the number of children by age. With the data from the HFD, we calculate, for each birth order z, the sum of age-specific fertility rates until age y, which gives us the proportion of women having at least z children at age y. The sum of these proportions gives the fertility rate at age y. The difference in the fertility rate at age y between SILC and HFD is obtained by summing up the differences between the proportions of women having at least z children.
Calculation of the absolute contribution of the over-/underrepresentation of each birth order in SILC to the downward bias in the number of children by age:
∅ 𝑛𝑏 𝑜𝑓 𝑐ℎ𝑖𝑙𝑑𝑟𝑒𝑛 (𝑎𝑔𝑒 𝑥)𝐻𝐹𝐷𝐵− ∅ 𝑛𝑏 𝑜𝑓 𝑐ℎ𝑖𝑙𝑑𝑟𝑒𝑛 (𝑎𝑔𝑒 𝑥)𝑆𝐼𝐿𝐶 ∑ 𝑐ℎ𝑖𝑙𝑑𝑟𝑒𝑛 𝑜𝑓 𝑤𝑜𝑚𝑒𝑛 (𝑎𝑔𝑒 𝑥)(𝐻𝐹𝐷𝐵) ∑ 𝑤𝑜𝑚𝑒𝑛 (𝑎𝑔𝑒 𝑥)(𝐻𝐹𝐷𝐵) − ∑ 𝑐ℎ𝑖𝑙𝑑𝑟𝑒𝑛 𝑜𝑓 𝑤𝑜𝑚𝑒𝑛 (𝑎𝑔𝑒 𝑥)(𝑆𝐼𝐿𝐶) ∑ 𝑤𝑜𝑚𝑒𝑛 (𝑎𝑔𝑒 𝑥)(𝑆𝐼𝐿𝐶) ∑ 𝑐ℎ𝑖𝑙𝑑𝑟𝑒𝑛 (𝐻𝐹𝐷𝐵)𝑜𝑟𝑑𝑒𝑟 1+ ∑ 𝑐ℎ𝑖𝑙𝑑𝑟𝑒𝑛 (𝐻𝐹𝐷𝐵)𝑜𝑟𝑑𝑒𝑟 2+ ∑ 𝑐ℎ𝑖𝑙𝑑𝑟𝑒𝑛 (𝐻𝐹𝐷𝐵)𝑜𝑟𝑑𝑒𝑟 3+ ∑ 𝑤𝑜𝑚𝑒𝑛 (𝑎𝑔𝑒 𝑥)(𝐻𝐹𝐷𝐵) − ∑ 𝑐ℎ𝑖𝑙𝑑𝑟𝑒𝑛 (𝑆𝐼𝐿𝐶)𝑜𝑟𝑑𝑒𝑟 1+ ∑ 𝑐ℎ𝑖𝑙𝑑𝑟𝑒𝑛 (𝑆𝐼𝐿𝐶)𝑜𝑟𝑑𝑒𝑟 2+ ∑ 𝑐ℎ𝑖𝑙𝑑𝑟𝑒𝑛 (𝑆𝐼𝐿𝐶)𝑜𝑟𝑑𝑒𝑟 3+ ∑ 𝑤𝑜𝑚𝑒𝑛 (𝑎𝑔𝑒 𝑥)(𝑆𝐼𝐿𝐶) (∑ 𝑐ℎ𝑖𝑙𝑑𝑟𝑒𝑛 (𝐻𝐹𝐷𝐵)𝑜𝑟𝑑𝑒𝑟 1 ∑ 𝑤𝑜𝑚𝑒𝑛(𝑎𝑔𝑒 𝑥)(𝐻𝐹𝐷𝐵)− ∑ 𝑐ℎ𝑖𝑙𝑑𝑟𝑒𝑛(𝑆𝐼𝐿𝐶)𝑜𝑟𝑑𝑒𝑟 1 ∑ 𝑤𝑜𝑚𝑒𝑛(𝑎𝑔𝑒 𝑥)(𝑆𝐼𝐿𝐶)) + ( ∑ 𝑐ℎ𝑖𝑙𝑑𝑟𝑒𝑛(𝐻𝐹𝐷𝐵)𝑜𝑟𝑑𝑒𝑟 2 ∑ 𝑤𝑜𝑚𝑒𝑛(𝑎𝑔𝑒 𝑥) (𝐻𝐹𝐷𝐵)− ∑ 𝑐ℎ𝑖𝑙𝑑𝑟𝑒𝑛 (𝑆𝐼𝐿𝐶)𝑜𝑟𝑑𝑒𝑟 2 ∑ 𝑤𝑜𝑚𝑒𝑛(𝑎𝑔𝑒 𝑥)(𝑠𝑖𝑙𝑐)) + ( ∑ 𝑐ℎ𝑖𝑙𝑑𝑟𝑒𝑛 (𝐻𝐹𝐷𝐵)𝑜𝑟𝑑𝑒𝑟 3+ ∑ 𝑤𝑜𝑚𝑒𝑛(𝑎𝑔𝑒 𝑥) (𝐻𝐹𝐷𝐵)− ∑ 𝑐ℎ𝑖𝑙𝑑𝑟𝑒𝑛 (𝑆𝐼𝐿𝐶)𝑜𝑟𝑑𝑒𝑟 3+ ∑ 𝑤𝑜𝑚𝑒𝑛(𝑎𝑔𝑒 𝑥) (𝑆𝐼𝐿𝐶))
Figure 4 reads as follows: in Bulgaria, at age 45, SILC underestimates the number of children by 0.59 children: 0.15 children of birth order 1, 0.28 children of birth order two and 0.15 children of birth order 3. The higher the age, the larger the underestimation of the number of children, in particular due to missing children of birth order two. For younger ages up to age 30, however, SILC underestimates the number of children slightly mainly due to missing children of birth order one. It is not likely that these children are missing because they have already left their parents’ household. It rather seems that in SILC, women aged 20-30 who have just given birth to their first child are underrepresented. We will come back to this issue in Section 3, when analyzing the event of child birth observed in SILC.
absolute contribution of the over-/under-representation of birth order 1 in
SILC
absolute contribution of the over-/under-representation of birth order 2 in
SILC
absolute contribution of the over-/under-representation of birth order 3+
Figure 4: Absolute contribution of the over-/underrepresentation of each birth order in SILC to the downward bias in the number of children by age.
Bulgaria Lithuania Portugal
Estonia Netherlands Czech Republic Slovakia
Hungary Norway Sweden
To facilitate a comparison between countries, we now calculate for age 49 the relative weight of the over/underrepresentation of children of birth order z to the downward bias in the number of children. Figure 5 presents the results.
Figure 5: Relative weight of the over-/underrepresentation of children of birth order z to the downward bias in the number of children, for women aged 49 (cohort 1960, year 2009)
SILC vs. HFD,women of cohorts 1960, year 2009.
Figure 5 illustrates that for all countries, except Slovakia, missing children of birth order two contribute most to the underestimation of the number of children of women aged 49 in SILC, in comparison to the HFD. The country differences for birth order two are relatively small.
The large contribution of children of birth order two can be explained by the fact that in all 10 countries, having 2 children is the norm for women aged 49, as the HFD measure in Table 1 shows. The departure of the first child leads to the second child being observed as a first child in SILC, and thus a “missing” second child.
The wrong attribution of birth orders also explains two further observations. First, the higher the number of children at age 49 (HFD), the more missing children of birth order three or more contribute to the
downward bias in SILC. Second, the lower the real number of children at age 49, the higher is the contribution of missing children of birth order one to the downward bias in SILC.
0,27 0,27 0,19 0,23 0,21 0,33 0,23 0,26 0,27 0,10 0,46 0,50 0,42 0,42 0,53 0,43 0,43 0,43 0,42 0,42 0,27 0,23 0,40 0,35 0,26 0,24 0,35 0,31 0,31 0,48 0% 10% 20% 30% 40% 50% 60% 70% 80% 90% 100% birth order 3+ birth order 2 birth order 1
Table 1: Number of children at age 49 Number of children at age 49 Country SILC HFD relative diff. Estonia 0.97 2.06 0.53 Bulgaria 0.95 1.95 0.51 Sweden 1.14 2.06 0.45 Norway 1.25 2.09 0.40 Czech Republic 1.21 2.03 0.40 Lithuania 1.10 1.91 0.42 Hungary 1.41 2.02 0.30 Portugal 1.31 1.91 0.31 Netherlands 1.40 1.86 0.25 Slovakia 1.75 2.17 0.20
SILC vs. HFD (cohort 1960 year 2009).
2.2. Missing children 2.2.1. Child departure
Besides the fertility level, the age when children tend to leave their parents’ household influences the downward bias in the number of children observed with SILC. To address this issue, we observe child departures in the longitudinal database of SILC. We therefore focus on women who are observed for at least two consecutive waves from 2009 onwards. The selected women all had at least one observed child in 2009. We identify a child as having left the parental household when a child disappears from one wave to the next, while the parental household continues to be observed in SILC.
Table 2 presents (for each country) the weighted mean age of mothers in the year of child departure and the weighted mean age of the child in the year of departure.
It should be noted that we observe all children here, independent of birth order. This is due to the fact that we cannot be sure of the birth order of children, as we may observe households in which some children had already left, at the beginning period of the observation. In addition, we also want to consider cases for which the younger child has left the parents’ household before the older child did so.
With this procedure, the departure age of children is correctly reported, but not necessarily the departure age for mothers. The departure age for mothers risks being overestimated as we might consider only child departures of children of higher birth orders, while we cannot identify the departure of older children who already have left the household before the beginning of the observed period.
In any case, women’s age at child departure reported by SILC depends on several factors: The number of children ever born to the woman
The age at first childbirth; The birth spacing intervals;
The age at which children leave the parental household. All these factors influence the bias in completed fertility, as reported by SILC.
Table 2: Ages of mothers and children in the year when children leave the parental household
SILC LT 2009-2012
Table 2 shows the highest age of mothers at child departure (above age 46) for the Netherlands, France and Greece, followed by Luxembourg, Romania, Slovenia, Finland, Sweden, Italy, Spain and Denmark. This is a very heterogeneous country group.
For the Nordic countries, France, the Netherlands and Luxembourg, the high age of mothers at child departure is likely to be caused by relatively late ages at first childbirth, but also by high fertility levels, which includes the problem that we only observe departures of children of higher birth orders.
The departure ages of children are the lowest in the Nordic and Baltic countries, followed by Continental European countries. For Greece, Italy, Spain, Romania and Slovenia, long cohabitation is most likely to explain the high ages of mothers at child departure, as the relatively high departure age of children suggests. SILC identifies the same countries as Eurostat (2015), Prioux (2006), Macura and Beets (2002) and Kiernan (2002), as countries with traditionally long cohabitation of parents and children (except Portugal, Cyprus and Slovakia, which are identified as countries with late child departures by Eurostat, 2015).
age of mother age of child
AT 46,20 20,53 BE 46,45 18,91 BG 45,73 23,36 CY 46,16 20,98 CZ 44,24 20,30 DK 46,46 17,87 EE 43,19 19,58 EL 47,86 22,53 ES 46,62 20,82 FI 46,96 19,32 FR 47,93 21,58 HU 45,61 21,45 IS 46,29 18,88 IT 46,73 20,01 LT 45,02 18,80 LU 47,74 21,89 LV 43,21 18,48 NL 48,90 20,28 NO 45,78 18,61 PL 46,32 22,00 PT 40,55 14,63 RO 47,19 25,23 SE 46,80 18,23 SI 47,00 22,50 SK 44,57 19,97 UK 45,62 18,73
Mothers are youngest at child departure in Portugal and the Czech Republic, Estonia and Latvia, where fertility and the women’s age at first childbirth is relatively low and children leave their parents’ household relatively early. In Portugal, the very low age of children at departure suggests a data collection problem: children tend to drop out of the survey at age 15, which is the age beginning at which parents are supposed to fill out a personal file for their children, including information about income, education, labor market status etc.
Even though the determinants of mothers’ ages at child departure are various, the descriptive analysis helps identifying from which age on the measure of the number of children in SILC is not reliable any more. To choose the optimal age to observe women’s final number of children, one has to balance child departures and child births: the higher the age, the higher the risk of underestimating the number of children due to child departures. The younger the age, the higher the risk of underestimating the number of children, due to omitted child births.
The HFD reports that taking into account childbirths for women aged 40+ increases the average number of children per women by 0.1 to 0.2 children, depending on the country in Europe. To enlarge country-coverage, we calculate total fertility rates for women aged 40+ with SILC (unbiased measure).2 The SILC reports that child births for women aged 40+ are important in those countries where women tend to delay first childbirth and where fertility is relatively high: this is particularly the case in the Nordic countries, France and the English-speaking countries. The lowest fertility rates for women aged 40+ are found in Eastern European countries with low fertility and relatively low ages at first childbirth. Continental and Mediterranean countries are intermediate cases with late first childbirth and low or intermediate fertility levels.
To identify the age for which the underestimation bias in the number of children is minimized, we calculate from which age on child departures exceed entries of children in SILC, again based on the longitudinal database of SILC (2009-2012). Therefore, for each woman aged between 25 and 60 having at least one child, we count the number of child departures from the parental household as well as the number of child entries into the parental household (births and adoptions, but returns of older children are also considered). On average in the EU SILC, child departures exceed child entries from age 44 on. Child departures increase exponentially from age 40 on and reach their maximum around age 55. Consequently, birth orders risk being incorrectly attributed for women aged 35+. Child entries decrease continuously until age 45 and then re-increase slightly due to some adult children moving back to their parents’ household. For most countries, the average critical maternal age from which child departures exceed child entries varies between 39 and 42 years. Countries with outstanding early critical ages are Bulgaria and Portugal.3 Countries with outstanding high critical ages are Italy and the Netherlands. However, even when respecting the optimal age for observing the number of children, measures of completed fertility stay underestimated in SILC. In addition, as the optimal age does not vary much between countries, it seems reasonable to state that “approximate” completed fertility size can be observed for women aged 40 in SILC, while it is prudent to take into account some more ages around 40, to avoid fluctuations due to cohort effects and small sample sizes.
2
TFR for women aged 40+ calculated with SILC CS 2012, retrospectively for years 2008-2010 (to reduce the downward bias caused by attrition and to obtain sufficiently large sample sizes for each country: see more on the optimal way to measure TFR in SILC in Section 3).
3
For Portugal, we already identified a potential data collection problem. It is interesting to note, however, that with SILC we see that for women around their sixties, there are more children going back to their parents’ household than leaving. This finding might be explained mainly by the time period covered (2009-2012), which corresponds to the economic crisis when many adult children were obliged to return to live with their parents, due to unemployment.
2.2.2. The socio-economic characteristics of women with children outside the household To see if the number of children outside households differs significantly between socio-economic groups, we use the French version of the Statistics of Income and Living Conditions (Statistiques sur les resources et
conditions de vie – SRCV – CS 2011). In its national version, it contains a question about the number of
children living in and outside the household. We can thus link this information to education, labor market status and income characteristics.
When calculating our measure of approximate completed fertility for France with the French module (SRCV), taking into account children in- and outside the household, we obtain a weighted average total number of children of 2.00, for women aged 38 to 44, in 2011. This total number is composed of 1.69 children in the household and 0.31 children outside the household. The difference in the number of children within the household between SRCV and the international SILC-sample for France is not significant and negligible (1.67 for the international module).
The sample comparison shows clearly that most of the underestimation bias in the number of children in the international SILC comes from the fact that there is no question about the number of children outside the household.
The French case shows that asking directly about the number of children in- and outside the household completely eliminates the measurement bias in the number of children. In comparison to other European countries, the proportion of children outside the household is likely to be relatively high in France. Children leave the parental household relatively early, especially compared to Southern Europe (Eurostat, 2015) and fertility levels are relatively high in comparison to other European countries (Human Fertility Database, 2012). The high number of unobserved children outside the household in France is thus likely to contribute essentially to the relatively important underestimation bias in approximate completed fertility rates reported in Figure 1.
In the SRCV-sample, a problem arises, however, as the number of children in- and outside the household is observed for households, but not on an individual basis.4 In order to attribute children to their mothers as correctly as possible, we exclude women who are themselves registered as ‘children of the household’ in the survey. We also exclude households with more than one woman aged 30+, which concerns only a very small minority of households in the sample (0.3%). With this reduced sample, the total number of children is 1.99, composed of 1.7 children in the household and 0.28 children outside the household.
The remaining problem is that children living outside the household cannot be attributed to their biological parents. Consequently, there is some risk that children with step-parents are counted twice in a representative survey like SRCV: children living with a step-mother count once as a child of the household for the step-mother, and once as child outside the household for the biological mother, if the mother is still alive and living in France.5 Children who do not live with their fathers also can be counted twice, once as a child of the household for the mother, and once as a child outside the household, if the father lives with
4
The concrete question in the SRCV-questionnaire is (for households with more than one household member): “Do you or another member of the household have children who do not live here? Yes/No. If yes, how many?” The reported number of children outside the household can thus not be attributed to an individual respondent, but only to the household as a whole.
5
It is also possible that children enter the panel due to household split-ups, as individuals who move together with a person who is followed-up by SILC (co-residents) are covered by the survey (Burricand and Lorgnet, 2014), albeit weighted with zero in the longitudinal database.
another woman. Even if the majority of children of separated couples still live with their mothers, shared custody is more and more common and thus some children have more than one residence, which also increases the risk of counting children twice in SILC. Toulemon and Pennec (2010) calculate that in the SRCV of 2006, 10.1% of households have at least one family member living also elsewhere (including students). On an individual basis, around 2% of very young children and around 12% of young adults are concerned by multi-residence. Hence, even if some children might be attributed to two women in the French SILC, as a child of the household for one woman and as a child outside the household and for another woman, it seems that the extent of this phenomenon is rather negligible. Toulemon and Pennec (2010) report that 7% of respondents aged 0-18 are counted twice in the survey, i.e. the number of children in SRCV is overestimated by 3.5% due to double counting. With an average number of children of 2 per woman, this corresponds to only 0.07 children. As SRCV reports exactly the same average number of children as the unbiased HFD for women around the age of 40, it seems that the slight overestimation in SRCV caused by double counting is compensated by the fact that in surveys, women tend to under-declare their children slightly. This trend is for example identified by Ni Bhrolchain et al. (2011), who find in addition that in the British household survey, the under declaration of children is increasing with age (due to aging, conflicts etc.).
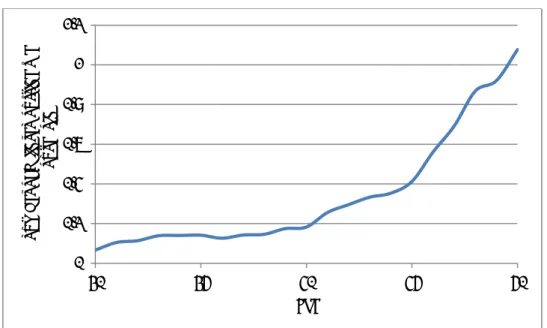
Figure 6 presents the number of children outside the household by woman’s age observed in the 2011-wave of the cross-sectional SRCV-database (3-year moving average).
Figure 6: Number of children outside the household by woman’s age in France
SRCV CS 2011, women aged 30 to 50.
Consistent with our finding that in the longitudinal database in SILC, child departure is importantly increasing from age 40 on average in EU countries (as discussed in section 2.2.1), the French SRCV reports that in France the number of children outside the household increases exponentially from age 40 onwards.
0 0,2 0,4 0,6 0,8 1 1,2 30 35 40 45 50 n u m b e r o f c h ild re n o u tsi d e th e h o u seh o ld age
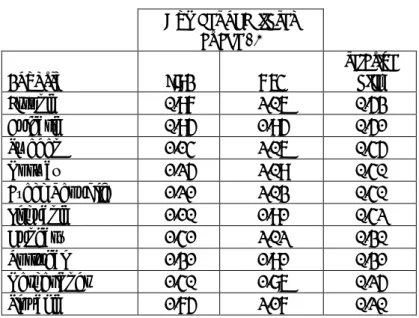
Table 3 shows descriptive statistics for the number of children in- and outside the household by socio-economic categories of French women (SRCV CS 2011, women aged 38 to 44). All categories combined, we recall that in our sample, 0.28 out of 1.99 children live outside their mother’s household, which represents 14%.
Low educated women (pre-primary, primary or lower secondary education) have the highest number of children in- and outside the household in comparison to “middle educated” (upper secondary or post-secondary education) and high educated (tertiary education) women. On average, 0.51 children out of 2.51 children are not living with their mothers (any more) for low educated women, i.e. 20%. When taking into account the distribution of women over education categories, we find that 0.08 out of the average number of 0.28 children outside the household are children of low educated women (i.e. 28%). 47% of children outside the household are children of middle educated women, and 25% of high educated women.
When comparing women of different civil statuses, we see that divorced women have the highest absolute number of children outside the household (0.6), followed by widowed women (0.28), while the number is smallest for women living in a consensual union on a legal basis (marriage and civil partnerships called “PACS” in France) (0.27). However, children of those (currently) married women represent 51% of all children outside the household. Besides, women cohabiting with their partner (without a legal basis: i.e. de
facto partners) have a higher number of children outside the household than married and single women.
Unfortunately, retrospective information on partnership status is not available in the SRCV.
In terms of nationality, the absolute number of children outside the household is by far the highest for women whose nationality is non-European/OECD (0.68), while the difference between French women and those of other high income countries is smaller (0.27 for French and 0.39 for European/OECD women). By taking into account women’s distribution over nationalities, we find however that 88% of children living outside their mothers’ household have a mother whose nationality is French.
Finally, disabled and full-time self-employed women have outstandingly high absolute numbers of children outside the household when compared to women of other activity statuses. However, as these women only represent small minorities, their children outside the household do not contribute very much to explaining the overall number of children outside the household. A large share of children living outside the maternal household (41%) has mothers who are in full-time employment.
Attention must be paid when interpreting these statistics. No inference about causality can be made at that stage. First of all, endogeneity is an issue: Is it because a woman works full-time that her child lives elsewhere? Or is it rather because her child lives elsewhere that she can work full-time? Second, the different categories presented in Table 3 are likely to be correlated to each other, just as they are correlated with other demographic characteristics, such as the number of children, the age at first childbirth, the age difference between children etc.
Table 3: Number of children in and outside the household by socio-economic categories of French women (aged 38-44)
$
nb. of children outside the household / total nb. of children
£
To calculate the absolute contribution, we proceed in the following way (example for two categories A and B): Number of children outside the household:
∑ 𝑐ℎ𝑖𝑙𝑑𝑟𝑒𝑛 𝑜𝑢𝑡𝑠𝑖𝑑𝑒 ℎ𝑜𝑢𝑠𝑒ℎ𝑜𝑙𝑑 ∑ 𝑤𝑜𝑚𝑒𝑛 ∑ 𝑐ℎ𝑖𝑙𝑑𝑟𝑒𝑛 𝑜𝑢𝑡𝑠𝑖𝑑𝑒 ℎ𝑜𝑢𝑠𝑒ℎ𝑜𝑙𝑑 𝐴+ ∑ 𝑐ℎ𝑖𝑙𝑑𝑟𝑒𝑛 𝑜𝑢𝑡𝑠𝑖𝑑𝑒 ℎ𝑜𝑢𝑠𝑒ℎ𝑜𝑙𝑑𝐵 ∑ 𝑤𝑜𝑚𝑒𝑛 ∑ 𝑐ℎ𝑖𝑙𝑑𝑟𝑒𝑛 𝑜𝑢𝑡𝑠𝑖𝑑𝑒 ℎ𝑜𝑢𝑠𝑒ℎ𝑜𝑙𝑑𝐴 ∑ 𝑤𝑜𝑚𝑒𝑛 + ∑ 𝑐ℎ𝑖𝑙𝑑𝑟𝑒𝑛 𝑜𝑢𝑡𝑠𝑖𝑑𝑒 ℎ𝑜𝑢𝑠𝑒ℎ𝑜𝑙𝑑𝐵 ∑ 𝑤𝑜𝑚𝑒𝑛 number of children in the household number of children outside the household total number of children relative number of children outside the household$ absolute contribution to 0.28 children out of the household (distribution of women over categories taken into account) £ relative contribution to 0.28 children out of the household (distribution of women over categories taken into account) All categories 1,71 0,28 1,99 0,14 Education
Low education (pre-primary, primary, lower secondary) 2,00 0,51 2,51 0,20 0,08 0,28 Middle education (upper secondary, post-secondary) 1,66 0,28 1,95 0,15 0,13 0,47
High education (tertiary) 1,63 0,19 1,83 0,11 0,07 0,25
Civil status Never married 1,14 0,20 1,35 0,15 0,07 0,24 Married 2,06 0,27 2,34 0,12 0,14 0,51 Widow 1,28 0,28 1,56 0,18 0,00 0,01 Divorced 1,77 0,60 2,37 0,25 0,06 0,23 Marital status
Married on a legal basis (incl."PACS") 2,06 0,27 2,34 0,12 0,14 0,51 Cohabiting ("de facto" partner) 1,59 0,45 2,04 0,22 0,10 0,35
Single 1,03 0,16 1,19 0,13 0,04 0,13 1st nationality France 1,69 0,27 1,96 0,14 0,25 0,88 EU/OECD 1,47 0,39 1,86 0,21 0,01 0,04 Other 2,23 0,68 2,91 0,23 0,02 0,08 Employment status Full-time employment 1,43 0,24 1,67 0,14 0,12 0,41 Part-time employment 2,02 0,22 2,24 0,10 0,05 0,18
Full-time self employment 1,62 0,54 2,16 0,25 0,03 0,09
Part-time self-employment 1,54 0,18 1,71 0,10 0,00 0,01
Unemployed 1,45 0,36 1,81 0,20 0,03 0,09
Student 0,80 0,00 0,80 0,00 0,00 0,00
Disabled 2,19 0,72 2,91 0,25 0,03 0,10
Inactive due to care and household work 2,70 0,38 3,07 0,12 0,03 0,09
Other inactive 1,36 0,29 1,64 0,17 0,00 0,01
SRCV CS 2011, women of cohorts 1967-1973 (N=1,271)
$nb. of children outside the household / total nb. of children
To disentangle the impacts of the different categories of Table 3, we estimate women’s absolute number of children outside the household as a function of education, marital status, nationality and employment status, and we also control for the number of children currently living in the household.
Table 4: Estimation of the number of children outside the household (women aged 38-44)
Unfortunately, we cannot control for the mother’s age at first childbirth neither for the ages and age differences of the children, as the SRCV does not contain register files for children outside the household.
Table 4 presents the regression results. The number of children outside the household is decreasing with the number of children inside the household. Highly educated women have a significantly lower number of children outside the household in comparison to middle and low educated women, low educated women, while the number of children outside the household is highest for low educated women. However, while these regression results are controlled for some observable characteristics,
Number of children outside the household
Coef. Std. Err. t P>t
Number of children currently present in the household
0 Ref.
1 -0,120 0,075 -1,590 0,111
2 -0,402 0,071 -5,660 0,000
3+ -0,455 0,079 -5,730 0,000
Education
Low education (pre-primary, primary, lower secondary) 0,128 0,061 2,090 0,037 Middle education (upper secondary, post-secondary) Ref.
High education (tertiary) -0,099 0,044 -2,230 0,026
Marital status Married/PACS Ref, Cohabiting 0,167 0,052 3,230 0,001 Single -0,248 0,056 -4,440 0,000 1st nationality France Ref, EU/OECD -0,012 0,124 -0,100 0,923 Other 0,372 0,126 2,960 0,003 Employment status
Full-time employment Ref,
Part-time employment 0,030 0,051 0,590 0,556
Full-time self employment 0,210 0,099 2,130 0,033
Part-time self-employment 0,020 0,159 0,120 0,902
Unemployed 0,100 0,085 1,170 0,242
Student -0,353 0,509 -0,690 0,489
Disabled 0,458 0,105 4,350 0,000
Inactive due to care and household work 0,157 0,083 1,890 0,059
Other inactive -0,012 0,200 -0,060 0,951
Constant 0,541 0,074 7,290 0,000
adj. R² 0,090
N 1266
they do not allow a comprehensive interpretation of the educational gradient, as we lack information about age at first childbirth, the history and stability of partnerships etc.
We further see that the number of children outside the household is significantly higher for cohabiting women in comparison to married women. In France, this category includes women living in a registered civil partnership (called “PACS” in France), which is a legal substitute for marriage. However, without retrospective information on partnerships, a cohabiting partnership cannot be interpreted as a less stable, or at least more recent, partnership.
Differences between French and other European women are not significant, but women having a nationality other than European/OECD have a significantly higher number of children outside the household than French women. An important share of these children is likely to live outside France, and women of this category only represent a minority of women living in France (see Table 3). Due to both these factors, these unobserved children do not contribute much to the underestimation bias in the international module.
Finally, the number of children outside the household is significantly higher for disabled and full-time self-employed women in comparison to full-time employed women, while differences with the other activity statuses are not significant. The coefficient for inactive women is significant at 10%, suggesting that inactive women tend to have a lower number of children outside the household than full-time employed women.
Even if we do not observe all potential determinants of the number of children outside the household (age at first childbirth, stability of relationships, characteristics of the child, etc.), our regression analysis clearly indicates that the number of children outside the household is not randomly distributed among women in France. Following this analysis, it is likely that the underestimation of family size from a certain age onwards in the international SILC module concerns low educated women in particular: those with immigration backgrounds, those who are neither married nor single but cohabiting, and those who are fully engaged in the labor market. This is likely to be the case not only for France. Our finding that the downward bias in the number of children differs significantly between socio-economic groups in SILC is problematic for demographic but also and especially for economic analysis. For analyses modelling the number of children as endogenous or exogenous variable, it seems reasonable to limit the sample to women not older than 40. For socio-economic analyses, it seems important to mention that children living outside the parental household often represent an important cost factor for parents (especially in the case of students). Missing information in this field emerges thus as a major weakness in a survey like SILC, whose main goal is to provide high-quality information in terms of income and living conditions of families. This shortcoming is even more surprising as it should be relatively easy to add to the individual (!) questionnaire a question on the number of children outside the household.
3. Periodic analysis – child birth
We are now concerned with childbirth, as an observed event in SILC. As the SILC contains a 4-year follow-up of individuals, the longitudinal database can be used for analyzing the event of childbirth, while observing parents’ socioeconomic characteristics such as education, income, labor market participation etc. shortly before or shortly after childbirth. In addition, childbirths reported in the cross-sectional sample can be used to calculate total fertility rates, differentiated for example by socio-economic characteristics.
However, it is possible that certain childbirths are not observed in SILC. This would lead, in demographic analysis, to an underestimation of periodic measures of fertility. This underestimation bias exists in the majority of countries covered by SILC, as Figure 1 has already suggested. The total fertility rates presented in Figure 1 were obtained by calculating the sum of age-specific fertility rates, while we observed children born in 2010 in the cross-sectional database of 2011, for women of ages 15+.
The downward bias in total fertility rates exists because child births are underrepresented in SILC. Three potential major causes exist for this underrepresentation:6
First, it is possible that in the questionnaire, some parents do not declare having a new child shortly after childbirth, but provide information about their children with a certain time delay.
Second, it is possible that parents who just had a child, who are about to have children or who are at least likely to have children, are underrepresented in the sample (sampling selection bias). This is potentially linked to attrition.
Third, attrition is potentially linked to child birth. Parents who are planning to have a child, who are about to have a child or who just had a child might move due to this event, which would increase the risk of dropping out of the survey (sampling attrition bias). Attrition affects not only the longitudinal database, but also the cross-sectional SILC samples due to its integrated design (see the Box in introduction for more information about the integrated design in SILC).
In theory, as both the cross-sectional and the longitudinal data shall be based on nationally representative probability samples (see for example Eurostat, 2013, page 20), the weighting procedure in SILC should compensate for these losses. For each country, Eurostat defines the minimum number of individuals and households required for sample sizes, and the database provides a series of weights (household design and cross-sectional weights, individual base weights, individual cross-sectional and longitudinal weights). According to the Commission Regulation on sampling and tracing rules (EC No 1982/2003,§7.4), “weighting factors shall be calculated as required to take into account the units’ probability of selection, non-response and, as appropriate, to adjust the sample to external data relating to the distribution of households and persons in the target population, such as by sex, age (five-year age groups), household size and composition and region (NUTS II level), or relating to income data from other national sources where the Member States
6
As stated in the introduction, our method to calculate total fertility rates (“the own children method”) is also known to underestimate total fertility rates, as between the date of birth and the time of the survey, some children may die and some children may not live with the mother any more. However, we consider this as a minor cause for underestimation.
concerned consider such external data to be sufficiently reliable” (Eurostat, 2013, page 30). Hence, for each country, weights are supposed to be adjusted to external sources (like censuses, population registers, labor force surveys etc.). In theory, by using weights, researchers should thus be able reproduce the population structure of each country, in terms of composition by age and sex, for example, but also in terms of socio-economic characteristics. However, Eurostat gives no precise information about the effectiveness of the weighting procedure conducted in each country. Consequently, the degree to which the weighted data is really representative of each country is not known, neither in terms of particular demographic characteristics such as fertility, nor in terms of particular socio-economic characteristics. The fact that we identify a downward bias in total fertility rates suggests that the weighting process is not efficient to compensate for the underrepresentation of child births/of newborn children in SILC.
3.1. Attrition
Among the three potential causes mentioned above, attrition merits particular attention due to its causal link with fertility.
In general, efforts are made by the interviewers to follow up households for the foreseen time period, even when the household moves or splits. In the longitudinal survey, Household ID and Personal ID never change, not even when the person moves to another household (Eurostat, 2013). Information on household and individual movements is included separately in the longitudinal database (coded as “household status” and “membership status” in SILC). However, tracing individuals and households who move between waves is not always successful. In the French SRCV, for example, only 65% to 70% of individuals who have moved in one year are followed-up in the next year. The likelihood of being followed-up when moving is highest for the principal respondent, but much lower for the other household members. Longitudinal weights provided in SILC are supposed to take into account the phenomenon of non-response, but they are constructed based on the implicit hypothesis that individuals who moved but could have been followed-up have the same characteristics than those who moved but could not have been followed up (Burrican and Lorgnet, 2014).
When comparing the events of child birth reported by the longitudinal database to the ones reported by the cross-sectional SILC-database, we find that the longitudinal weights are calibrated to represent the cross sectional population (for more detailed information, see Figures C and D and their interpretation that can be found in the Appendix). This reduces the bias caused by attrition to some extent, as the cross-sectional database is less affected by attrition. However, due to its integrated design, not only the longitudinal but also the cross-sectional databases are affected by attrition in SILC.
Attrition is potentially linked to fertility, as starting or enlarging a family might incite parents to move, which increases the risk of not being followed up in SILC. This risk is even higher in case of household splits: if a member of the household leaves the household to live elsewhere, the chances are high that he/she is not followed-up any more, especially if the person is not the principal respondent. Adult children who leave their parents’ household are thus potential candidates for having relatively low follow-up rates. These are in general likely of having a first child, which might explain why SILC underestimates especially child birth of order one for young women below the age 30. Following this logic, first childbirth should in particular be underestimated for these adult children who leave their parents’ household because they start their own families. While in some European countries, it is relatively common to live alone, to share a flat with or to live with a partner for a
certain time before having children (Nordic countries, Continental countries), it is quite frequent in other countries, especially in the Mediterranean ones, to leave the parental household only once having one’s own children is an imminent event (Eurostat 2015, Prioux 2006, Macura and Beets 2002, Kiernan 2002). These child births are particularly at risk of not being observed in the longitudinal SILC database.
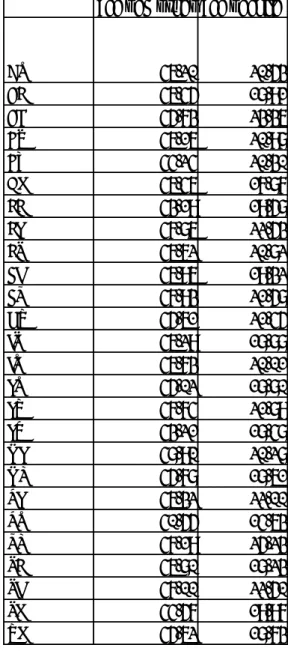
In order to have more insight into the question of who is particularly concerned by attrition, we now analyze follow-up rates for women aged 15 to 55 who entered the SILC in 2009 and who are supposed to be followed-up for four years (women are in the same rotation group, in each country). On average for the 23 European countries concerned, 61% of women are followed-up for four years. Figure 7 illustrates that the follow-up rates are very heterogeneous among European countries in SILC. Countries with lowest ups are Portugal, the United Kingdom and Norway, while follow-up rates are highest in Lithuania, the Czech Republic and Cyprus.
Figure 7: Proportion of women being followed-up for 4 years
SILC LT 2009-2012, women aged 15 to 55
SILC does not provide longitudinal data for Ireland, Switzerland, Germany and Croatia. Sweden, Slovakia and Romania are missing in Figure 7 as for these three countries, longitudinal data was only available until 2011, at the time we conducted the analysis.
The heterogeneity in follow-up is potentially linked to a variety of factors, such as the age structure and fertility behavior, but also the data collection methods. In France, where a subgroup of individuals is supposed to be followed-up for nine years, follow-up rates for the first four years were relatively good. However, Norway, Portugal, Slovakia and Luxembourg also provide follow-up periods of more than four years for at least one third of the sample for more recent periods, but the follow- up rates for the first four years for the period 2009-2012 are low in Norway, Portugal and Luxembourg. In general, we observe that besides Norway, follow-up rates are also relatively low in
0,00 0,10 0,20 0,30 0,40 0,50 0,60 0,70 0,80 0,90 PT UK NO SI LU EL IT NL BE DK IS AT LV ES FI MT FR PL EE BG CY CZ LT
Denmark and Iceland. This might also be linked to the fact that in the Nordic countries, the SILC data are constructed based on register files7.
Those countries which have the highest follow-up rates presented in Figure 7 are not necessarily those countries with the lowest bias in TFR presented in Figure 7. Lithuania, Bulgaria, Estonia and France, for example, have relatively high follow-up rates, but also high downward biases in TFR. A good follow-up does thus not lead per se to less biased periodic fertility measures. Even if 80% or more individuals of a population are followed-up, fertility will be downward biased due to attrition if the individuals who are most ‘at risk’ of childbirth are the ones that are most likely to drop out of the database.
To understand which women are most concerned by attrition, we now calculate follow-up rates by age and number of children.
Figure 8 shows that on average in the 23 countries, follow-up rates drop between age 15 and age 25 and then re-increase until age 30. Therewith, follow up rates are lower for women aged 20 to 30 than for women aged 30+.
Figure 8: Proportion of women being followed-up for n years, by age
SILC LT 2009-2012, women aged 15 to 55, 3 year MA Weighted average of 23 European countries
7
The register countries also are problematic when it comes to observing personal information of several household members at the same time in SILC (for example when the objective is to observe at the same time a women’s and her partner’s characteristics, in terms of education, activity status, income, etc.). While the register files give complete information about the basic demographic characteristics of each household member, the personal file containing information about socio-economic characteristics is only complete for the respondent in many cases. For about 50% of partners, some information, such as the monthly activity status, is missing.
0 0,1 0,2 0,3 0,4 0,5 0,6 0,7 0,8 0 10 20 30 40 50 60 age 1 year 2 years 3 years 4 years
Figure 9 shows that between ages 25 to 35, the proportion of childless women being followed up for four years is much lower, in comparison to women with at least one child. It is only from age 45 onwards that differences between women without and with children are not significant any more. Differences between mothers having one, two and three or more children are never significant. Figure 8 and 9 suggests that once women have their own household with children, they are quite well followed-up, at least from age 25 onwards. Childless women seem to be difficult to follow especially between the ages of 25 and 35. For younger ages, follow-up rates are better for childless women, probably because an important share of these women still live with their parents. For later ages, follow-up rates are also better for childless women, probably because an important share of these women are settled and do not move so much anymore.
Figure 9: Proportion of women being followed up for 4 years, by age and number of children
SILC LT 2009-2012, women aged 15 to 55, 3 year MA Weighted average of 23 European countries
We now further differentiate by a number of individual and household characteristics. Table 5 shows estimations of women’s probability of being followed-up for four years, without and with country-fixed effects (logit regression with robust standard errors). Characteristics are observed in the first observed year, i.e. 2009.
The regression confirms that demographic characteristics linked to fertility are highly related to attrition, once socio-economic characteristics and other side effects are controlled for. Childless women aged 20-30 (who are thus likely to have a first child) have the highest drop-out rates.
Table 5 shows that couples with children have the highest follow-up probability, followed by couples without children. Lone mothers and, above all, single women (we observe here childless women who
0,4 0,45 0,5 0,55 0,6 0,65 0,7 0,75 15 25 35 45 55 age childless at least 1 child