HAL Id: hal-01050649
https://hal.archives-ouvertes.fr/hal-01050649
Submitted on 2 Feb 2021
HAL is a multi-disciplinary open access
archive for the deposit and dissemination of
sci-entific research documents, whether they are
pub-lished or not. The documents may come from
teaching and research institutions in France or
abroad, or from public or private research centers.
L’archive ouverte pluridisciplinaire HAL, est
destinée au dépôt et à la diffusion de documents
scientifiques de niveau recherche, publiés ou non,
émanant des établissements d’enseignement et de
recherche français ou étrangers, des laboratoires
publics ou privés.
Use of various remote sensing land cover products for
plant functional type mapping over Siberia
Catherine Ottlé, Julie Lescure, F. Maignan, Benjamin Poulter, Tao Wang,
Nicolas Delbart
To cite this version:
Catherine Ottlé, Julie Lescure, F. Maignan, Benjamin Poulter, Tao Wang, et al.. Use of various remote
sensing land cover products for plant functional type mapping over Siberia. Earth System Science
Data, Copernicus Publications, 2013, 5 (2), pp.331-348. �10.5194/essd-5-331-2013�. �hal-01050649�
www.earth-syst-sci-data.net/5/331/2013/ doi:10.5194/essd-5-331-2013
©Author(s) 2013. CC Attribution 3.0 License. Open
Access
Science
Data
Use of various remote sensing land cover products
for plant functional type mapping over Siberia
C. Ottlé1, J. Lescure1, F. Maignan1, B. Poulter1, T. Wang1, and N. Delbart2
1LSCE-IPSL, UMR8212, CNRS-CEA-UVSQ, Orme des Merisiers, Gif-sur-Yvette, France 2PRODIG, UMR8586, Université Paris-Diderot, Paris, France
Correspondence to: C. Ottlé (catherine.ottle@lsce.ipsl.fr)
Received: 23 April 2013 – Published in Earth Syst. Sci. Data Discuss.: 27 June 2013 Revised: 8 October 2013 – Accepted: 28 October 2013 – Published: 18 November 2013
Abstract. High-latitude ecosystems play an important role in the global carbon cycle and in regulating the climate system and are presently undergoing rapid environmental change. Accurate land cover data sets are required to both document these changes as well as to provide land-surface information for benchmarking and initializing Earth system models. Earth system models also require specific land cover classification systems based on plant functional types (PFTs), rather than species or ecosystems, and so post-processing of existing land cover data is often required. This study compares over Siberia, multiple land cover data sets against one another and with auxiliary data to identify key uncertainties that contribute to variability in PFT classifications that would introduce errors in Earth system modeling. Land cover classification systems from GLC 2000, GlobCover 2005 and 2009, and MODIS collections 5 and 5.1 are first aggregated to a common legend, and then compared to high-resolution land cover classification systems, vegetation continuous fields (MODIS VCFs) and satellite-derived tree heights (to discriminate against sparse, shrub, and forest vegetation). The GlobCover data set, with a lower threshold for tree cover and taller tree heights and a better spatial resolution, tends to have better distributions of tree cover compared to high-resolution data. It has therefore been chosen to build new PFT maps for the ORCHIDEE land surface model at 1 km scale. Compared to the original PFT data set, the new PFT maps based on GlobCover 2005 and an updated cross-walking approach mainly differ in the characterization of forests and degree of tree cover. The partition of grasslands and bare soils now appears more realistic compared with ground truth data. This new vegetation map provides a framework for further development of new PFTs in the ORCHIDEE model like shrubs, lichens and mosses, to represent the water and carbon cycles in northern latitudes better. Updated land cover data sets are critical for improving and maintaining the relevance of Earth system models for assessing climate and human impacts on biogeochemistry and biophysics.
The new PFT map at 5 km scale is available for download from the PANGAEA website at doi:10.1594/PANGAEA.810709.
1 Introduction
The Siberian region has been a focus of research attention in recent years because it is considered as a hot spot for cli-mate change studies (see for example Lenton et al., 2008). The region is currently undergoing a warming trend with impacts already visible in the environment, its vegetation and soils (Lucht et al., 2002). Pronounced climatic warm-ing in Siberia (Chapin III et al., 2005) has had large
impli-cations on vegetation (Euskirchen et al., 2009), changes that have been already confirmed by numerous studies at various scales. For example, Tape et al. (2006) demonstrated, using aerial photography, an expansion of deciduous shrubs in tun-dra areas in northern Alaska during the last 50 yr. Satellite data sets and especially Normalized Difference Vegetation Index (NDVI) products have also documented landscape-scale greening signals and/or phenological changes, in re-lation with air temperature (see for example, Forbes et al.,
332 C. Ottlé et al.: Use of various remote sensing land cover products for PFT mapping over Siberia
2010; Hüttich et al., 2007; Delbart et al., 2005; Delbart and Picard, 2007; Myneni et al., 2001). However, the response of continental-scale vegetation shifts due to climate warm-ing is not simple because different processes and feedbacks linked to snow, permafrost, soil moisture, albedo, and species competition (Chapin III et al., 2005, Loranty and Goetz, 2012) lead to large uncertainties in predicting and attribut-ing ecosystems and land cover change dynamics.
One approach to understand better the role of interacting processes and how the various species compete for water, light and nutrients is the use of ecosystem models. Ecosys-tem models are now able to represent the main high-latitude physical and biogeochemical processes and especially per-mafrost and snow modeling and vegetation interactions, as well as vegetation dynamics, but these models require a cor-rect representation of current land coverage as initial condi-tions or for benchmarking dynamic global vegetation models (Quaife et al., 2008).
In northern Eurasia, the main challenge for ecosystem modelers is to be able to differentiate short- from high-statured vegetation, as well as deciduous from evergreen phe-nology. Even at this coarse thematic resolution, very di ffer-ent energy, water and carbon cycling processes are repre-sented. For example, vegetation height is directly related to surface roughness and consequently affects turbulent fluxes; in addition, vegetation height can alter the effects of snow on ecosystem energy budgets with implications for surface albedo and related feedbacks. The deciduous character of shrubs or trees is also very important for the calculation of spring and autumn water and carbon fluxes and their seasonal variations.
Improved mapping of current land cover is a high priority for representation within Earth system models, yet there are several challenges that need to be considered. Remote sens-ing instruments provide regular data at global scales, with increasing spatial resolution, and have been used for years to map land cover. Thus, a number of global products have been derived over the last 20 yr. They are used for a wide range of environmental studies and especially in climate models to characterize the land surface and its physical and biogeo-chemical properties and to determine the energy and matter transfers to the atmosphere. In such models, for simplifica-tion, to reduce the computer time, and to develop testable hy-potheses, the various ecosystems are grouped in plant func-tional types (PFTs), with a limited number of types, usually around 10 to 15. As an example, the ORCHIDEE dynamic global vegetation model (DGVM) (Krinner et al., 2005), part of the Institut Pierre Simon Laplace (IPSL) Earth system model (LMDZ, Hourdin et al., 2006; Dufresne et al., 2013), distinguishes 12 PFTs to represent the global land surface. Moreover, the reclassification in PFTs is done with constant, but qualitative, rules defined across climate zones (Poulter et al., 2011), which can lead to significant uncertainty in the class fractions.
The current ORCHIDEE PFT map is based both on the International Geosphere-Biosphere Programme (IGBP) 1 km global land cover map (Belward et al., 1999) reduced by a dominant-type method to 5 km spatial resolution, and on the Olson classification (96 types) (Olson et al., 1983). This spatial resolution is clearly not sufficient for future local-scale studies focused on the environmental impacts of global warming and land use in Siberia and for development per-spectives in terms of parameterization of biogeochemical processes. Therefore, our objective in this study is to develop a new map at 1 km resolution based on recent land cover products, suitable for Earth system modeling, which could be further refined if new PFTs are developed.
For that purpose, different remote sensing land cover prod-ucts are available. They have been developed from multispec-tral and multitemporal imagery, in order to separate the var-ious ecosystems presenting different spectral properties and seasonal variations. At medium resolution (hundreds of me-ters to kilomeme-ters), the most popular and most recent prod-ucts are the GLC 2000 land cover database (Bartholomé and Belward, 2005) based on SPOT-4 VEGETATION in-strument, the GlobCover land cover products (Arino et al., 2005, 2012) derived from Envisat/MERIS radiometer and the MODIS land cover data sets (Friedl et al., 2002, 2010), based on Terra and Aqua MODIS instruments.
These products have been compared in previous works and for some of them over Siberia. For example, Jung et al. (2006) developed the Synergetic land cover product (SYNMAP) dedicated to Earth system modeling, based on the merging of GLC 2000 and MODIS 4.0 products. The fi-nal map, which separates 48 classes, is available at 3000scale
(∼ 1 km). Frey and Smith (2007) inter-compared AVHRR (Advanced Very High Resolution Radiometer) and MODIS products at 1 km scale in West Siberia and highlighted the weaknesses of global land cover (LC) products in northern wetland environments. Urban et al. (2010) focused on pan-Arctic land cover mapping and combined GlobCover, SYN-MAP, MODIS LC and vegetation continuous fields (VCFs) and additional regional products like fire products, to create a new harmonized map separating four classes: trees, shrubs, herbaceous and barren areas. Sulla-Meneshe et al. (2011) de-veloped the Northern Eurasia Land Cover (NELC) database from supervised classification of MODIS data, which allows the separation of 15 land cover classes including land use (ur-ban, agriculture), wetlands and tundra classes. Meanwhile, Pflugmacher et al. (2011) cross-compared GLC 2000, Glob-Cover and MODIS products as well as Landsat-based refer-ence maps in northern Eurasia. The map legends were con-verted to a common classification on the basis of dominant life-form type (LFT). The results show regional disagree-ments among products and the difficulties to map shrubs and herbaceous vegetation types. More recently, Shepaschenko et al. (2011) produced a highly detailed land cover/land use data set for Russia essentially based on GLC 2000 data set at
1 km resolution combined with VCFs from MODIS, soil and vegetation databases and different inventories and statistics.
All these studies found significant differences between data sets and highlighted strengths and weaknesses of each product, but none concluded on the superiority of one com-pared to the other. Moreover, since for most of these works, the final objective was not PFT mapping, the methodology developed for the cross-comparison and the final mapping could not be used directly for our study. Further, no compari-son to date has included the MODIS 5.1 product, which ben-efits from a reprocessing of the complete MODIS archive, with an up-to-date training database, and an extension of the land cover data to 2011. Therefore, it was necessary to develop a new comparison of the most recent land cover products available for Siberia, to build dedicated aggregation rules for ORCHIDEE PFT mapping and to generate a new PFT map over Siberia at 1 km scale.
This paper presents the methodology used to compare medium-resolution remote sensing land cover products for Siberia. The evaluation was performed after aggregating the different land cover data sets to the same spatial scale and under the same harmonized legend. A comparison of the-matic differences was conducted to highlight areas of dis-agreement, and we developed a methodology to generate the PFT distributions. Our results are presented in terms of prod-uct comparison and final PFT mapping, with discrepancies explicitly addressed.
2 Methods
We acquired recent land cover satellite products available at medium spatial resolution (300 to 1000 m) and focused our comparison on Siberia. The data sets are presented in Ta-ble 1 with their specifications in terms of spatial resolution, time of acquisition, geographic projection, and thematic in-formation, including the number of land cover classes with the respective classification legends in Table 2. The global products include the GLC 2000 product (Bartholomé and Belward, 2005) developed in northern Eurasia by Bartalev et al. (2003), the GlobCover 2005 and 2009 products (Bicheron et al., 2006; Arino et al., 2005, 2012) and the MODIS land cover type collection 5.0 and 5.1 (Friedl et al., 2002, 2010). The first four products have been already compared and evaluated in various regions and at different scales, using ground truth measurements and have shown strengths and weaknesses (See and Fritz, 2006; Jung et al., 2006; Frey and Smith, 2007; Kaptué Tchuente et al., 2010, 2011; Pflug-macher et al., 2011; Schepaschenko et al., 2011).
Our first goal was to identify the most suitable product for further PFT mapping. To achieve this, we assessed the land cover classification methodology and land cover class definition in terms of their capacity to represent the spatial heterogeneity and in terms of the spatial agreement between products. To assess these criteria, we compared various data
sets at different temporal and spatial scales, including high-resolution optical images like Landsat-TM (Thematic Map-per) products.
2.1 Land cover products
The GLC 2000 land cover map was developed for different parts of the world with regional experts before applying a generalized legend to create a global land cover map. In this work, we used the regional product over northern Eurasia de-veloped by the European Commission’s Joint Research Cen-tre and the Russian Academy of Science’s Center for Forest Ecology and Productivity (Bartalev et al., 2003; Bartholomé and Belward, 2005). The land cover map was produced from daily observations provided by the SPOT-4 VEGETATION instrument for the year 2000, at 1/112◦ ground sampling
distance (GSD), corresponding to a ∼ 1 km spatial resolu-tion. The automated classification process allows separating 22 land cover types based on local expert opinion follow-ing the land cover classification system (LCCS, Di Gregorio and Jensen, 1998) of the Food and Agriculture Organization (FAO). The map is available from the JRC Land Resource Management Unit website (http://bioval.jrc.ec.europa.eu), in equal area projection (plate carrée) with map datum WGS84. The GlobCover land cover products (GlobCover 2005 and GlobCover 2009) were developed within the framework of European Space Agency (ESA) projects (Bicheron et al., 2006, 2008; Arino et al., 2005, 2012). They are both based on Envisat/MERIS data acquired in years 2005 and 2009 re-spectively and available from the ESA GlobCover project website (http://ionia1.esrin.esa.int). The maps are available in plate carrée (WGS84) projection with a 300 m spatial reso-lution (1/360◦GSD), under the same class definition as GLC
2000 (i.e., LCCS but with a larger number of classes (40) for the regional product available for eastern Eurasia in 2005), whereas GlobCover 2009 product is available only with a global legend that separates 22 classes, fully compatible with the GLC 2000 one. GlobCover uses a fully automated unsu-pervised classification approach using GLC 2000 as the main auxiliary data set for the class interpretation.
Finally, the MODIS land cover products developed by the Boston University Department of Geography and Cen-ter for Remote Sensing (https://lpdaac.usgs.gov) are based on NASA MODIS instruments on board Aqua and Terra plat-forms. They are available at annual time step, from 2001 until 2007 for the C5.0 product (Friedl et al., 2002, 2010) with a spatial resolution of 500 m (1/240◦ GSD). The most
recent product (C5.1) is available for the 2001–2010 period with the same spatial resolution of 500 m. The two products are available on an Integerized Sinusoidal Grid (ISG) pro-jection, with a legend based on the IGBP classification sys-tem that separates 17 classes. The new product C5.1 is an update of C5.0 and an extension in time period. The same classification methodology was used, but significant errors in the training data set were adjusted as noted in the User
334 C. Ottlé et al.: Use of various remote sensing land cover products for PFT mapping over Siberia Table 1.List of the land cover products used and their characteristics.
Products Satellite sensor Time period Spatial resolution
Projection Cover zone Number of classes Land cover GLC2000 (v1.1) SPOT-4 (VGT) 2000 1000 m Plate carrée
WGS84 Global 22 MODIS MCD12Q1 (v5.0) Terra Aqua (MODIS) 2001–2007 500 m Sinusoidal Global 17 MODIS MCD12Q1 (v5.1) Terra Aqua (MODIS) 2001–2010 500 m Sinusoidal Global 17 GlobCover Eastern Eurasia (v2.2) 2005 Envisat (MERIS) 2004–2006 300 m Plate carrée WGS84 Regional map (eastern Eurasia zone) 40 GlobCover (v2.2) 2009 Envisat (MERIS) 2009 300 m Plate carrée WGS84 Global 22
Auxiliary Circumpolar Arctic Vegetation Map NOAA (AVHRR) 1993–1995 1 : 7.5 M Lambert azimuthal Circumpolar Arctic zone 18 Yakutsk Land Cover (A. Fedorov et al., personal communication, 2012) Landsat-TM 2002 60 m Lambert azimuthal Yakutsk region 12 Forest height (Simard et al., 2011)
GLAS/ICESAT 2005 1 km Plate carrée WGS84
Global 1
MODIS VCF (V4) Terra (MODIS) 2000–2010 500 m Sinusoidal Global 3
Guide for the MODIS Land Cover Type Product, MCD12Q1 (which is available at http://www.bu.edu/lcsc/files/2012/08/ MCD12Q1_user_guide.pdf).
2.2 Auxiliary data sets
Several auxiliary products representing different features of the land surface were used to assist in the evaluation of the global products (see Table 1). These products first helped us in the interpretation of the different legends and later assisted in the merging process, which permitted us to build the har-monized legend. Among them, two land cover maps based on aerial photointerpretation and ground truth data have been used to understand better the class significance and evalu-ate product accuracy and spatial variability representation. For these two products, the digital database was not acces-sible and only graphical maps were used. The first one is the Circumpolar Arctic Vegetation Map (CAVM, Walker et al., 2005), which was developed within the National Sci-ence Foundation Arctic Transitions in the Land-Atmosphere System (ATLAS) project, and is presently the most precise mapping of the Arctic tundra. It is available at 1 : 7 500 000 scale at http://www.geobotany.uaf.edu/cavm, in Lambert az-imuthal projection, and separates 18 classes describing very
precisely the various tundra ecosystems. This data set is based on photointerpretation by vegetation experts of nine Arctic regions, which allowed delineating the various biomes into a NOAA-AVHRR images database.
The second one is the Yakutsk region land cover mapping provided by A. Fedorov (personal communication, 2012), which was derived from Landsat images acquired in 2002 combined with ground truth data. In this map, 12 land cover classes were separated including six different types of for-est like larch and birch in different states and three types of grasslands (alas, wet and dry valley meadows). These 2 maps have mostly been used in the following to evaluate the ability of the various land cover products to separate the shrubs/herbaceous classes and the broadleaf/needleleaf forests.
Lastly, the MODIS global VCFs (Hansen et al., 2003, 2006) and the forest canopy height map proposed by Simard et al. (2011) complemented all these data sets. The VCF product derived from MODIS sensors is provided at 500 m spatial resolution on an annual basis (2000–2010) and at global scales. The VCF is a proportional estimate of veg-etative cover types: woody vegetation, herbaceous vegeta-tion, and bare ground. Collection 4 (version 3) was down-loaded at http://glcf.umd.edu/data/vcf, where it is available
Table 2.Aligning the legends of global maps: dominant life-form type (LFT) and corresponding land cover classes from GLC 2000, GlobCover and MODIS IGBP.
Dominant LFT
GLC2000 GlobCover 2005 GlobCover 2009 MODIS
Tree [1] Tree cover, broad-leaved,
evergreen
[40] Closed to open broad-leaved evergreen or semi-deciduous forest
[40] Closed to open broad-leaved evergreen or semi-deciduous forest
[1] Evergreen needleleaf forest
[2] Tree cover, broad-leaved, deciduous, closed
[50] Closed broad-leaved deciduous forest
[50] Closed broad-leaved deciduous forest
[2] Evergreen broadleaf forest
[3] Tree cover, broad-leaved, deciduous, open
[60] Open broad-leaved deciduous
forest/woodland [60] Open broad-leaved deciduousforest/woodland [3] Deciduous needleleafforest [4] Tree cover, needle-leaved,
evergreen
[70] Closed needle-leaved evergreen forest
[70] Closed needle-leaved evergreen forest
[4] Deciduous broadleaf forest
[5] Tree cover, needle-leaved, deciduous
[91] Open needle-leaved deciduous forest
[5] Mixed forest
[6] Tree cover, mixed leaf type
[90] Open needle-leaved deciduous or evergreen forest
[90] Open needle-leaved deciduous or evergreen forest
[8] Woody savannas
[7] Tree cover, regularly flooded, freshwater
[92] Open (15–40 %) needle-leaved evergreen forest
[9] Savannas
[8] Tree cover, regularly flooded, saline water
[100] Closed to open (> 15 %) mixed broad-leaved and needle-leaved forest
[100] Closed to open mixed broad-leaved and needle-leaved for-est
[10] Tree cover, burnt [101] Closed (> 40 %) mixed broad-leaved and needle-leaved forest
Shrub [11] Shrub cover,
closed–open, evergreen
[130] Closed to open shrubland [130] Closed to open shrubland [6] Closed shrublands
[12] Shrub cover, closed–open, deciduous [131] Closed to open (> 15 %) broad-leaved or needle-leaved evergreen shrubland [7] Open shrublands
[134] Closed to open broad-leaved deciduous shrubland
Herbaceous [16] Cultivated and managed areas
[11] Post-flooding or irrigated croplands (or aquatic)
[11] Post-flooding or irrigated croplands (or aquatic)
[12] Croplands
[12] Post-flooding or irrigated shrub or tree crops
[14] Rainfed croplands [10] Grasslands
[13] Post-flooding or irrigated herbaceous crops
[140] Closed to open (> 15 %) herbaceous vegetation [14] Rainfed croplands
[15] Rainfed herbaceous crops [16] Rainfed shrub or tree crops [13] Herbaceous cover, closed–open [140] Closed to open (> 15 %) herbaceous vegetation [141] Closed grassland [143] Open grassland Barren [14] Sparse herbaceous or
sparse shrub cover
[150] Sparse (< 15 %) vegetation [150] Sparse (< 15 %) vegetation [151] Sparse (< 15 %) grassland
[152] Sparse (< 15 %) shrubland [22] Artificial surfaces
and associated areas
[190] Artificial surfaces and associated areas
[190] Artificial surfaces and associated area
[13] Urban and built up
[19] Bare areas [200] Bare areas [200] Bare areas [16] Barren or sparsely
vegetated [201] Consolidated bare areas
(hard-pans, gravels, bare rock, stones, boulders)
[202] Non-consolidated bare areas (sandy desert)
[203] Salt hardpans
336 C. Ottlé et al.: Use of various remote sensing land cover products for PFT mapping over Siberia Table 2.Continued.
Dominant LFT
GLC2000 GlobCover 2005 GlobCover 2009 MODIS
Mosaic [9] Mosaic: tree cover/ other natural vegetation
[20] Mosaic cropland (50–70 %)/ vegetation (grassland/shrubland/ forest) (20–50 %) [20] Mosaic cropland (50–70 %)/ vegetation (grassland/shrubland/ forest) (20–50 %) [11] Permanent wetlands
[15] Regularly flooded shrub
and/or herbaceous cover [21] Mosaic cropland (50–70 %)/grassland or shrubland (20–50 %)
[30] Mosaic vegetation (grassland/ shrubland/forest) (50–70 %)/ cropland (20–50 %)
[14] Cropland-natural vegetation mosaic [17] Mosaic: cropland/tree
cover/other natural vegetation [30] Mosaic vegetation (grassland/shrubland/forest) (50–70 %)/ cropland (20–50 %)
[110] Mosaic forest or shrubland (50–70 %)/grassland (20–50 %) [18] Mosaic: cropland/shrub
and/or grass cover [32] Mosaic forest (50–70 %)/cropland (20–50 %)
[120] Mosaic grassland (50–70 %)/ forest or shrubland (20–50 %) [110] Mosaic forest or shrubland
(50–70 %)/grassland (20–50 %) [160] Closed to open (> 15 %)broad-leaved forest regularly flooded
[120] Mosaic grassland (50–70 %)/ forest or shrubland (20–50 %)
[170] Closed (> 40 %) broad-leaved forest or shrubland permanently flooded
[170] Closed broad-leaved forest or shrubland permanently flooded
[180] Closed to open (> 15 %) grassland or woody vegetation on regularly flooded or waterlogged soil
[180] Closed to open grassland or woody vegetation on regularly flooded or waterlogged soil [185] Closed to open grassland on regularly flooded or waterlogged soil
Water [20] Water bodies [210] Water bodies [210] Water bodies [0] Water bodies
in the same projection as the land cover product. Finally, the forest height product based on 2005 data from the Geo-science Laser Altimeter System (GLAS) on board ICEsat (Ice, Cloud, and land Elevation Satellite) is available glob-ally at 1 km spatial resolution and provides an estimation of the canopy height. These two last products provided an inde-pendent mapping of the forested areas and were mostly used in the PFT map generation. The data were obtained through the website http://lidarradar.jpl.nasa.gov in GeoTIFF format.
2.3 Harmonized legend approach
Because these land cover products did not have the same spatial resolution and, more importantly, did not use the same classification system, a harmonization procedure was developed. As already discussed by all the works dedicated to land cover map cross-comparison (to cite a few – See and Fritz, 2006; Frey and Smith, 2007; Urban et al., 2010; Sulla-Menashe et al., 2011; Pflugmacher et al., 2011; Kaptué Tchuente et al., 2011), the classification method, the original data, the number of thematic classes chosen, etc., can highly bias the classification results and the overall regional biogeo-graphic characteristics.
For example, GLC 2000 and GlobCover legends give more weight to the dominant tree species than to the density char-acter, compared to MODIS. This is probably the result of the
classification methodology applied for the MODIS product, which is based on the combined use of surface reflectance and land-surface temperature (LST), contrary to the other products, which use only surface reflectance. The addition of LST, which is known to be highly sensitive to vegetation fraction, could have increased the weight of the tree cover-age in the class separation. Therefore, the LCCS legend used for GLC 2000 and GlobCover defines forest as greater than 15 % tree cover with trees defined as woody plants larger than 5 m, whereas IGBP (used in the MODIS product) de-fines forest as greater than 60 % tree cover with trees defined as woody plants larger than 2 m. Two other IGBP classes of eight and nine (woody savannas/savannas) are then used to represent more open canopies with the same height thresh-olds but different cover thresholds down to 10 %. In the same way, for shrublands, LCCS distinguishes between evergreen and deciduous species, whereas IGBP considers open and closed types. Further, for barren lands, IGBP merges bare and sparsely vegetated soils, when LCCS separates sparse herba-ceous, sparse shrubs and bare areas. Given all these features, a comparison work could not be performed before having converted all the study products in a common legend. For our final purpose of water and carbon cycle modeling, this com-mon classification requires the following: first, to be based on PFT features and, secondly, to discriminate trees, shrubs, water and barren as well as leaf type and senescence. This
Table 3.Harmonized legend used and correspondence with original product classes.
Classes GlobCover 2005 GlobCover 2009 MODIS GLC 2000 Evergreen needleleaf forest 92, 70 70 1 4
Evergreen broadleaf forest – – 2 –
Deciduous needleleaf forest 90, 91 90 3, 8, 9 5 Deciduous broadleaf forest 50, 60 50, 60 4 2 Mixed forest 32, 40 ,100 40, 100 5 6 Mixed forest–shrubs 110, 12 110, 12 – 9
Shrubs 130, 131, 134 130 6 11, 12
Sparse vegetation 150, 151, 152 150 7, 16 14 Herbaceous regularly flooded 180, 185 180 10 15
Herbaceous 30, 32, 140 30, 140 – 13 Urban 190 190 13 22 Bare soil 200, 201, 202, 203 200 – 19 Snow/ice 220 220 15 21 Water 210 210 0 20 Burnt areas – – – 10 Croplands 11, 12, 13, 14, 15, 16, 20, 21 11, 14, 20 12, 14 16, 17, 18
choice leads us to merge the IGBP and LCCS classes under the 16 classes listed in Table 3, which are in close agree-ment with the GlobCover 2009 legend. The merging rules and the allocation of the ambiguous classes have been driven by the comparison of the spatial distribution of the land cover classes and the help of the auxiliary products, especially the high-resolution maps (CAVM map and the various Landsat images acquired in different subregions of Eurasia).
Afterwards, in order to allow the comparison, all the data have been re-projected to the WGS84 plate carrée projec-tion with square pixel size (1/112◦about 1 km scale), using a majority class criterion, since GLC 2000 and GlobCover are already available in this projection and grid.
3 Results
The various products have been compared over Siberia, with a focus on central and southwest Siberia (over Yaku-tia and around Omsk respectively, where high-resolution data were available). The coordinates of these two domains are 55–75◦N/104–163◦E and 50–58◦N/56–96.5◦E, respec-tively. These two regions were chosen because they cover al-most all the variety of Siberian ecosystems. The first region, Yakutia (Sakha Federal Republic of Russia, capital Yakutsk), covers a large area of about 3 M km2, with 40 % above the Arctic Circle. The region is one of the coldest continental regions in the world (outside Antarctica) with large annual temperature amplitude varying between −60 and+40◦C. It
is all covered by permafrost and mainly drained by the Lena River and its tributaries. The vegetation is driven by these extreme climate conditions, which limits the extent of Arc-tic tundra, composed of lichens and mosses in the north, and the taiga forest mostly composed of deciduous trees (espe-cially larch) in the south. The other region studied is
situ-ated in the southwest part of Siberia. It represents an area of about 2 M km2and is part of the Irtysh River catchment. The vegetation is mostly composed of croplands (wheat, barley, potatoes, etc.) and deciduous forests with the predominant species being larch in the north taiga and birch and aspen in the south.
3.1 Comparison to central Siberia
Figure 1 presents the land cover maps extracted from the five global products (GLC 2000, GlobCover 2005 and 2009, MODIS 5.0 and 5.1) at 1 km scale under the harmonized legend discussed previously. The five products were com-pared considering the representative time period. Thus, Cover 2005 was compared with MODIS 2005 data set, Glob-Cover 2009 with MODIS 2009 product and GLC 2000 with MODIS 2001.
The maps clearly show the latitudinal distribution of tree cover, with forested areas between the mountains of Verkhoyansk and Chersky on the east side and Stanovoy in the south, sparse vegetation in the northern latitudes and bare soils in the mountainous areas. In this large region, the main land cover classes are deciduous needleleaf forest (mostly larch) covering the middle latitudes, and shrubs often mixed with forests and sparse vegetation. Although present in the five products, the fraction and spatial distributions of forest differ significantly among them. Table 4 presents the frac-tion of each land cover class for each study product. The fractions were calculated excluding the water pixels in order to avoid the Arctic Ocean pixels, which could have biased the statistics. In Table 4, values greater than 10 % have been highlighted in bold (i.e., excluding vegetation types not well-represented in this region).
338 C. Ottlé et al.: Use of various remote sensing land cover products for PFT mapping over Siberia
1
GLC 2000 GlobCover 2005 GlobCover 2009
MODIS 5.0 (2001) MODIS 5.0 (2005) MODIS 5.1 (2009)
MODIS 5.1 (2001) MODIS 5.1 (2005)
Figure 1
Figure 1.Comparison of five land cover products in Yakutia: GLC2000, GlobCover 2005 and 2009, MODIS 5.0 and 5.1 for 2001, 2005 and 2009, aggregated at 1 km scale to a common legend.
Table 4.Fraction of each class in each product for Yakutia, values larger than 0.1 appear in bold.
Classes GlobCover 2005 GlobCover 2009 MODIS5.0 (2005) MODIS5.1 (2005) GLC 2000 Evergreen needleleaf forest 0.03 0.00 0.01 0.01 0.04 Evergreen broadleaf forest 0.00 0.00 0.00 0.00 0.00 Deciduous needleleaf forest 0.56 0.58 0.42 0.28 0.45
Deciduous broadleaf forest 0.01 0.01 0.00 0.00 0.01
Mixed forest 0.01 0.01 0.01 0.03 0.02
Mixed forest–shrubs 0.16 0.13 0.00 0.00 0.04
Shrubs 0.00 0.00 0.05 0.00 0.18
Sparse vegetation 0.17 0.21 0.50 0.64 0.08
Herbaceous regularly flooded 0.01 0.02 0.02 0.04 0.04
Herbaceous 0.00 0.00 0.00 0.00 0.07 Urban 0.00 0.00 0.00 0.00 0.00 Bare soil 0.05 0.05 0.00 0.00 0.06 Snow/ice 0.00 0.00 0.00 0.00 0.00 Water 0.00 0.00 0.00 0.00 0.00 Burnt areas 0.00 0.00 0.00 0.00 0.00 Croplands 0.00 0.00 0.00 0.00 0.00
The main features are a larger representation of the sparse vegetation class in MODIS (50 % and 64 % for 5.0 and 5.1 products respectively) compared to 8 and 21 % in GLC 2000 and GlobCover 2009, to the detriment of deciduous needle-leaf forest (28 % in MODIS 5.1 compared to 58 % in Glob-Cover 2009). This disagreement was already pointed out by Frey and Smith (2007) when they compared MODIS prod-uct to land cover field-based observations. It can be noted also that the shrub class is represented in the north of the re-gion only in the GLC 2000 product and that regularly flooded areas are more represented in GlobCover and MODIS prod-ucts compared to GLC 2000, especially in the Lena River delta. The spatial agreements are quantified in Table 5 for the main classes present in this region (i.e., deciduous
needle-leaf, mixed forests, shrubs, sparse vegetation, herbaceous and bare soils). The statistics were calculated by compar-ing each product to the GlobCover 2005 one (values above 0.5 are highlighted in bold in the table, and statistics were not calculated for the classes presenting amounts less than 0.5 % like shrubs). As previously, the total agreement per-centages do not account for water pixels, which could have biased the accuracy assessment. The results confirm the spa-tial comparisons: the best agreements are obtained for the two GlobCover products as expected, even though some classes like mixed forests or herbaceous present some dis-crepancies, probably linked to the low number of pixels in-volved since these classes represent about 1 % of the Glob-Cover 2005 map. The comparison with GLC 2000 shows
Table 5.Agreement percentages in Yakutia (for the main classes and comparison of GlobCover 2005 with GlobCover 2009, GLC 2000, MODIS 5.0, MODIS 5.1), values larger than 0.5 appear in bold.
Classes GlobCover2005 GlobCover 2005 GlobCover 2005 GlobCover 2005 GLC 2000 GLC 2000 MODIS 5.0
– GLC2000 – GlobCover 2009 – MODIS 5.0 – MODIS 5.1 – MODIS 5.0 – MODIS 5.1 – MODIS 5.1
Deciduous needleleaf 0.65 0.95 0.64 0.42 0.68 0.70 0.61 Forest Mixed forest 0.24 0.73 0.25 0.33 0.31 0.23 0.73 Mixed forest–shrubs 0.09 0.74 – – – – – Shrubs 0.66 – 0.50 – 0.18 0.12 – Sparse vegetation 0.36 0.90 0.88 0.85 0.14 0.11 0.86 Herbaceous regularly 0.18 0.97 0.20 0.22 0.04 0.04 0.31 flooded Herbaceous 0.24 0.58 – – – – – Bare soil 0.49 0.83 – – – – – Total agreement 0.60 0.89 0.61 0.52 0.49 0.43 0.76 Total agreement 0.38 0.68 0.40 0.31 0.28 0.21 0.55 Without water
that a lower scores are obtained for the same ambiguous classes, which probably present a larger heterogeneity and could suffer from the lower spatial resolution. The evalua-tion with MODIS maps displays worse statistics especially for shrubs, mixed forests and herbaceous vegetation, and the total agreement values are all lower than 0.5 except when two products of the same family are compared. A qualitative comparison was further performed with the CAVM product (Walker et al., 2005). The comparison of photointerpretations presenting continuous fields with pixel-based classifications has proven difficult, but in specific regions like in the Lena River delta, the different types of tundra appear better sepa-rated in the GLC 2000 and GlobCover 2005 products than in the other ones (not shown in this paper).
3.2 Comparison at finer scale in Yakutsk surroundings
In order to check the accuracy of the various products and the impact of the increased resolution of 300 m on the spatial representation of the land variability, we focused our compar-isons around Yakutsk region taking advantage of the high-resolution map provided by A. Fedorov’s team (personal communication, 2012). This map is shown in Fig. 2 (bot-tom image). It shows clearly a precise delineation of the ev-ergreen needleleaf forest (identified as “Pine” in light green color) and the mixed forest plots (in light blue (“Pine larch”) and in pink (“Birch Larch”)) within the dominant deciduous needleleaf ecosystem (“Larch” in middle green), particularly on the right bank of the Lena River. In Fig. 2, only the corre-sponding images for the GLC 2000 and GlobCover products exhibit this same spatial variability with evergreen needleleaf forests along the river banks in dark green and mixed forests in middle green, whereas the MODIS maps only show the de-ciduous needleleaf forest in light green. However, the lower spatial resolution of GLC 2000 does not allow representing correctly the riverbed and the flooded areas, contrary to the GlobCover 2005 product in which the herbaceous vegetation
regularly flooded class along the riverbed is well character-ized. Therefore, in that region, it seems that GlobCover 2005 better captures the main features of the land coverage.
3.3 Comparison in southwest Siberia
The second region where we focused our cross-comparison is the southwest part of Siberia where we are interested in analyzing the evolution of agriculture in future works. This region is mostly covered by croplands, deciduous broadleaf and needleleaf forests, and herbaceous and sparse vegetation. The grid cell fractions range between 0.3 and 0.43 for crop-lands, and are generally lower than 0.2 for the other cover types (Table 6).
The main difference among the LC products stems in the representation of the southern part of the region, covered by sparse and herbaceous vegetation in GlobCover and GLC 2000 maps, and by regularly flooded lands in MODIS. This area at the limit of Kazakhstan is drained by the Irtysh River and presents irrigated croplands, which could be identified wrongly as flooded areas. The main cropland area in pur-ple in Fig. 3 is well delimited between the forested areas in the north and the sparse vegetated lands in the south. We also noted differences in the eastern part of the region, which is classified as croplands by MODIS and as sparse vegetation in the other products. This disagreement was an-alyzed more deeply by looking at this region with Landsat images. The views show undoubtedly that this region is cov-ered by agricultural fields presenting an unambiguous spatial structure. The classification discrepancies between crop and sparse vegetation highlight the difficulties in separating such ecosystems if several dates per year are not used to assess the intra-seasonal variability, and if a pixel-based classification technique is used. An object-based classification methodol-ogy should have performed better in that case in the absence of higher spatial resolution imagery. Anyway, MODIS clas-sification appears here to be more accurate for crop mapping.
340 C. Ottlé et al.: Use of various remote sensing land cover products for PFT mapping over Siberia
2
GLC2000 GlobCover 2005 MODIS 5.0 2001
MODIS 5.1 2001
Vegetation map of the Middle Lena River Basin,
compiled by A.N. Fedorov, Y.I. Torgovkin, A.I. Vasiliev, M.I. Petrov and A.A. Shestakova
Figure 2
Figure 2.Comparison of five land cover products in Yakutsk region: GLC2000, GlobCover 2005, MODIS 5.0 and 5.1 for 2001, aggre-gated at 1 km scale to a common legend with the land cover map provided by A. Fedorov (Melnikov Permafrost Institute, Russia, personal communication, 2012).
The spatial agreement statistics are presented for the main land cover classes in Table 7. The classes that appear in best agreement are the crops and the mixed forest (except for GLC 2000) with values larger than 0.5. The lowest val-ues are obtained for sparse vegetation, which can be mixed with crops or herbaceous ecosystems. Moreover, the decidu-ous needleleaf and broadleaf forests appear to be better sep-arated in the GlobCover products compared to MODIS and GLC 2000, where all the forested areas are grouped in the mixed forest class. Finally, the overall agreement percent-ages are very low, with values never exceeding 0.4 similar to what has been previously shown in Yakutia (except when products of the same family are compared).
3.4 Forest mapping accuracy
Our motivation being the development of PFT maps for land surface modeling, the characterization of biomes and the
sep-aration of forested areas from shrublands are particularly im-portant. Indeed, the vertical structure of forests implies dif-ferent ground shading, aerodynamic and roughness proper-ties, and consequently significant impacts on surface fluxes. Therefore, a product of forest canopy height like the one pro-posed by Simard et al. (2011) appears interesting for the in-terpretation of the land cover product legend as well as for its accuracy assessment. This recent product, based on li-dar measurements, provides, at a global scale, the estima-tion of canopy height at 1 km resoluestima-tion with an error eval-uated against ground truth data of less than 6 m. For the comparison with land cover products, the forest classes were grouped together. Since the lidar product is based on 2005 data, and since the two GlobCover products are very similar, only the GlobCover 2005 map was included in the compar-ison. Figure 4 presents the comparison of the current forest height product with GLC 2000, GlobCover 2005 and the two MODIS products extracted for the year 2005. Qualitatively,
Table 6.Fraction of each class in each product for South Siberia, values larger than 0.1 appear in bold.
Classes GlobCover 2005 GlobCover 2009 MODIS 5.0 (2005) MODIS 5.1 (2005) GLC2000 Evergreen needleleaf forest 0.05 0.02 0.06 0.02 0.07 Evergreen broadleaf forest 0.00 0.00 0.00 0.00 0.00 Deciduous needleleaf forest 0.08 0.12 0.05 0.06 0.04 Deciduous broadleaf forest 0.13 0.11 0.00 0.00 0.01
Mixed forest 0.03 0.06 0.23 0.26 0.24
Mixed forest–shrubs 0.05 0.03 0.00 0.00 0.00
Shrubs 0.00 0.00 0.01 0.00 0.02
Sparse vegetation 0.17 0.13 0.02 0.01 0.03
Herbaceous regularly flooded 0.01 0.01 0.19 0.27 0.17
Herbaceous 0.17 0.10 0.00 0.00 0.00 Urban 0.01 0.00 0.00 0.00 0.00 Bare soil 0.00 0.01 0.00 0.00 0.00 Snow/ice 0.00 0.00 0.00 0.00 0.00 Water 0.00 0.00 0.00 0.00 0.00 Burnt areas 0.00 0.00 0.00 0.00 0.00 Croplands 0.30 0.41 0.43 0.37 0.43
Table 7.Agreement percentages in South Siberia (for the main classes and comparison of Globcover2005 with Globcover2009, GLC2000, MODIS 5.0, MODIS 5.1), values larger than 0.5 appear in bold.
Classes GlobCover 2005 GlobCover 2005 GlobCover 2005 GlobCover 2005 GLC 2000 GLC 2000 MODIS 5.0
– GLC2000 – GlobCover 2009 – MODIS 5.0 – MODIS 5.1 – MODIS 5.0 – MODIS 5.1 – MODIS 5.1
Evergreen needleleaf 0.65 0.13 0.54 0.71 0.56 0.71 0.34 Forest Deciduous needleleaf 0.16 0.68 0.13 0.07 0.10 0.07 0.29 Forest Deciduous broadleaf 0.55 0.50 – – – – – Forest Mixed forest 0.56 0.50 0.88 0.90 0.36 0.39 0.80 Mixed forest–shrubs – 0.32 – – – – – Sparse vegetation 0.24 0.72 0.03 0.02 0.08 0.01 0.22 Herbaceous regularly – – – – – – 0.93 flooded Herbaceous – 0.46 – – – – – Croplands 0.54 0.96 0.79 0.70 0.42 0.67 0.80 Total agreement 0.42 0.65 0.31 0.27 0.32 0.39 0.74 Total agreement 0.40 0.64 0.30 0.26 0.31 0.38 0.72 Without water
the extension of forested areas appears better represented in GlobCover 2005 if a threshold of 10 m height is imposed to delineate trees and shrubs. The agreement with the for-est class was calculated for the four land cover products (MODIS5.0, MODIS5.1, GLC 2000 and GlobCover 2005). The spatial agreements obtained (43.5 %, 37.4 %, 57.9 % and 76.1 %) for the four products show clearly that GlobCover 2005 better captures the degree of woodiness at the land sur-face, which is an essential parameter for vegetation charac-terization in carbon and water cycle modeling.
4 Discussion
The results of the cross-comparison of the five land cover products studied, in two different regions of Siberia, show differences and similarities that can be explained either by the lack of resolution (for GLC 2000) or by the methodolo-gies used to assess the class separation and interpretation. The agreement among the maps is highest in the zones that present more homogenous landscapes (for example inside the taiga region) and lower in the transition zones or in sparse ecosystems for which the class definition is determinant. The contribution of higher resolution products is therefore a sig-nificant improvement for discriminating vegetation types and for better mapping such regions. For our modeling purposes,
342 C. Ottlé et al.: Use of various remote sensing land cover products for PFT mapping over Siberia
since the main objective is to identify the type of ecosystem whatever its density (which will be anyway provided by the leaf area index (LAI) variable used as forcing or prognosti-cally computed by the big-leaf type DGVM), the definition provided by GlobCover or GLC appears more valuable. Fur-thermore, this class definition allows delineating forested ar-eas more precisely, as was demonstrated in the comparison with the recent forest height product. In addition, GlobCover 2005 provides a more precise legend (compared to Glob-Cover 2009, even if this level of detail is not ensured glob-ally) and an increased spatial resolution (compared to GLC 2000).
For all these reasons, the GlobCover 2005 product was chosen as a basis for the PFT mapping, keeping in mind its class definition, especially the forest classes, which can include pixels with spatial coverage as low as 15 %. This definition more suitable for land cover type identification will require merging with other indices to account for veg-etation density. Otherwise, it could lead to a likely over-representation of forests in transition zones with tundra in the northern latitudes and with herbaceous cover types in the south.
5 PFT mapping
Given the GlobCover 2005 land cover map, our next chal-lenge is to define merging rules to build a PFT map for the ORCHIDEE dynamic global vegetation model (DGVM). For that purpose, we have followed the approach of Poul-ter et al. (2011) and associated with each GlobCover 2005 land cover class the corresponding classification in the OR-CHIDEE DGVM. In this work, we focused only on the PFTs present in Siberia. Given the previous studies and drawbacks highlighted in the GlobCover 2005 product, the reclassifica-tion rules proposed by Poulter et al. (2011) have been slightly modified and adjusted to boreal ecosystems, as described in Sect. 4.2.
5.1 ORCHIDEE model
The ORCHIDEE land surface model is a mechanistic dy-namic global vegetation model (Krinner et al., 2005) that is part of the IPSL Earth system model (Friedlingstein et al., 2006). It calculates the energy, momentum and hydrological budget of vegetation and soil and the entire carbon and nitro-gen cycle in the different soil and vegetation pools. Photosyn-thesis, phenology, allocation of carbon and nitrogen into the different organs, plant growth and mortality, and decomposi-tion of litter and soil organic matter, are derived from primi-tive equations that depend on vegetation characteristics. OR-CHIDEE is built on the concept of PFTs to describe vegeta-tion distribuvegeta-tions. Species with similar characteristics are re-grouped together, and the model distinguishes 12 PFTs (trop-ical evergreen and deciduous forests, temperate broadleaf evergreen and deciduous forests, temperate needleleaf
for-est, boreal needleleaf evergreen and deciduous forests, bo-real broadleaf deciduous forest, natural C3 and C4 grassland, and C3 and C4 crops) plus bare soil. In its standard version, the PFTs are defined from two databases: the AVHRR IGBP 1 km global land cover map (Belward et al., 1999) and Ol-son et al. (1983) biome classification including 96 land types (Vérant et al., 2004). The final map prescribes the fraction of each vegetation type over a resolution cell of 5 km. There-fore, different PFTs can coexist in every grid element, and their fraction can vary when the dynamic vegetation sub-module is activated. Figure 5 presents the standard PFT maps used in ORCHIDEE.
In Siberia, nine PFTs are present in the standard land cover map. They include four types of forests (temperate and boreal needleleaf evergreen, needleleaf summergreen, broadleaf summergreen forests), C3 grass, C3 crops, unlikely (but very few) C4 crops and bare soils.
5.2 ORCHIDEE PFTs
Table 8 presents the merging rules that have been defined to reclassify the GlobCover 2005 classes present in Siberia, into the ORCHIDEE PFTs. The original crosswalk table from Poulter et al. (2011) was slightly modified to map the bo-real PFTs better, based on the ancillary satellite data and considering the LCCS legend for regional land cover types. In particular, the fractions of forested PFTs in the open for-est classes were decreased to account for the lower density of forests in boreal regions, as well as the fractions of bare soil in the sparse vegetation classes to account for mosses in tundra environments. Moreover, because of the absence of the boreal broadleaf evergreen class in the ORCHIDEE PFT classification, this class has been equally distributed between the broadleaf summergreen and the needleleaf evergreen PFT classes. For the same reasons, the lichens were merged with C3 grasses and the shrublands were spread among the C3 grass, the forests and bare soil classes. Further, the percent-ages of forests, bare soils and grasslands (only C3 in boreal zones) were adjusted with the support of the MODIS VCF products. These data, indeed, permit assessing the land sur-face heterogeneity and the amount of vegetation inside the pixels. For example, Montesano et al. (2009), in their eval-uation of the VCF product in the circumpolar taiga–tundra transition zone, showed the contribution of these continu-ous fields to capture the forest cover variability and the spa-tial heterogeneity, especially in land cover transition zones. Therefore, the VCF data for the year 2005 have been up-scaled at 1 km scale, and the fractions of trees, grasslands and bare soil have been extracted and averaged for each Glob-Cover 2005 class. The results permitted a better understand-ing of the LCCS legend, and the PFT reclassification was then performed according to the new merging rules described in Table 8.
The new PFT maps have been generated from the Glob-Cover 2005 data set, keeping the benefit of the high
Table 8.Merging rules from GlobCover classes to ORCHIDEE PFTs.
ID GlobCover description Bare
soil Boreal needleleaf evergreen Boreal broadleaf summer Boreal needleleaf summer C3 grass C3 agri-culture Water Snow/ice
11 Post-flooding or irrigated croplands 100.0
12 Post-flooding or irrigated shrub or tree crops 100.0
13 Post-flooding or irrigated herbaceous crops 100.0
14 Rainfed croplands 100.0
15 Rainfed herbaceous crops 100.0
16 Rainfed shrub or tree crops 100.0
20 Mosaic cropland (50–70 %)/vegetation
(grassland/shrubland/forest) (20–50 %) 10.0 15.0 15.0 60.0
21 Mosaic cropland (50–70 %)/grassland or shrubland (20–50 %)
10.0 15.0 25.0 50.0
30 Mosaic vegetation (grassland/shrubland/
forest) (50–70 %)/cropland (20–50 %) 13.8 21.3 25.0 40.0
32 Mosaic forest (50–70 %)/cropland (20–50 %)
10.0 50.0 40.0
40 Closed to open broad-leaved evergreen or semi-deciduous forest
47.5 52.5
50 Closed broad-leaved deciduous forest 85.0 15.0
60 Open broad-leaved deciduous
forest/woodland 10.0 55.0 35.0
70 Closed needle-leaved evergreen forest 77.5 7.5 15.0
90 Open needle-leaved deciduous or evergreen forest
15.0 20.0 5.0 15.0 45.0
91 Open needle-leaved deciduous forest 10.0 60.0 30.0
92 Open needle-leaved evergreen forest 15.0 47.5 7.5 30.0
100 Closed to open mixed broad-leaved and needle-leaved forest
10.0 27.5 37.5 10.0 15.0
110 Mosaic forest or shrubland (50–70 %)/ grassland (20–50 %)
17.5 32.5 10.0 40.0
120 Mosaic grassland (50–70 %)/forest or shrubland (20–50 %)
12.5 22.5 5.0 60.0
130 Closed to open shrubland 10.0 30.0 30.0 30.0
131 Closed to open broad-leaved or needle-leaved evergreen shrubland
10.0 45.0 15.0 30.0
134 Closed to open broad-leaved deciduous shrubland
15.0 40.0 45.0
140 Closed to open herbaceous vegetation 40.0 60.0
141 Closed (> 40 %) grassland 40.0 60.0
143 Open (15–40 %) grassland 60.0 40.0
150 Sparse (< 15 %) vegetation 35.0 9.4 9.4 6.3 40.0
151 Sparse (< 15 %) grassland 35.0 65.0
152 Sparse (< 15 %) shrubland 35.0 7.5 7.5 5.0 45.0
160 Closed to open (> 15 %) broad-leaved forest regularly flooded
15.0 45.0 20.0 20.0
170 Closed (> 40 %) broad-leaved forest or shrubland permanently flooded
40.0 40.0 20.0
180 Closed to open (> 15 %) grassland or woody vegetation on regularly flooded
15.0 15.0 40.0 30.0
185 Closed to open (> 15 %) grassland on regularly flooded or waterlogged soil
70.0 30.0
190 Artificial surfaces and associated areas 75.0 2.5 2.5 15.0 5.0
200 Bare areas 100.0
201 Consolidated bare areas (hardpans, gravels, bare rock, stones, boulders)
100.0
202 Non-consolidated bare areas (sandy desert) 100.0
203 Salt hardpans 100.0
210 Water bodies 100.0
344 C. Ottlé et al.: Use of various remote sensing land cover products for PFT mapping over Siberia
3
GLC 2000 GlobCover 2005 GlobCover 2009
MODIS 5.0 (2001) MODIS 5.0 (2005) MODIS 5.1 (2009)
MODIS 5.1 (2001) MODIS 5.1 (2005)
Figure 3
Figure 3.Comparison of five land cover products in southwest Siberia: GLC2000, GlobCover 2005 and 2009, MODIS 5.0 and 5.1 for 2001, 2005 and 2009, aggregated at 1 km scale to a common legend.
4
GLC 2000 GlobCover2005
Forests Shrubs Herbaceous
Herbaceous regularly flooded Croplands Bare soil Urban Snow/Ice Water MODIS 5.0 MODIS 5.1
Forest canopy height (Simard et al., 2011)
0-10m 11-20m >20m
Figure 4
Figure 4.Comparison of four land cover products in Yakutia: GLC2000, GlobCover 2005, MODIS 5.0 and 5.1 for 2001, with the forest canopy height product provided by Simard et al. (2011). The forest classes were grouped together at 1 km scale.
resolution of 300 m. The data were aggregated at 1 km scale in PFT fractions, and the results are presented in Fig. 6. The results show the main features characterizing Siberia (i.e., the predominance of needleleaf summergreen forests in the cen-ter, broadleaf summergreen and then croplands in the south, grasslands and larger fractions of bare soil in the northern latitudes). Compared to the previous maps (see Fig. 7 for the difference mapping), the temperate broadleaf PFTs and sparse C4 crops have disappeared, and generally the fractions are less contrasted. The amount of bare soil and grasslands is larger (up to 15 %) in central Siberia, better representing the sparse feature of Siberian forests, and the broadleaf summer-green forest abundance decreased in the northern part of the region, which seems to be more realistic. The boreal needle-leaf summergreen forest covers now a larger area north and south of the previous limited location, where the abundance
decreased from 100 to 60 %. The water surfaces are also more and better represented.
The agreement between the original Olson-based PFT map and the new GlobCover-based PFT map was quantified with the commonly used Euclidian distance between the PFT classes (Legendre et al., 2005; Poulter et al., 2011), calcu-lated for each 1 km pixel. Equation (1) presents the expres-sion of the dissimilarity index for a grid cell c calculated be-tween the two classifications (new and standard) composed of 14 classes (12 PFT+ water and ice classes) and their cor-responding fractional abundance P in the two classifications.
Dc= 14 X i
(Pnewi,c− Pstani,c)
2 0.5 (1)
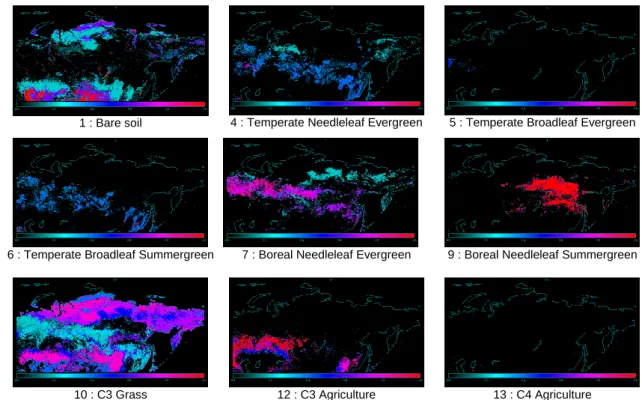
5 1 : Bare soil 4 : Temperate Needleleaf Evergreen 5 : Temperate Broadleaf Evergreen
6 : Temperate Broadleaf Summergreen 7 : Boreal Needleleaf Evergreen 9 : Boreal Needleleaf Summergreen
10 : C3 Grass 12 : C3 Agriculture 13 : C4 Agriculture
Figure 5.Standard ORCHIDEE PFT maps. The respective fractions of the following nine classes are represented in color scale, from blue (0 %) to red (100 %): bare soil (PFT1), temperate needleleaf evergreen (PFT4), temperate broadleaf evergreen (PFT5), temperate broadleaf summergreen (PFT6), boreal needleleaf summergreen (PFT9), C3 grass (PFT10), C3 agriculture (PFT12), and C4 agriculture (PFT13).
6
1 : Bare soil 7 : Boreal Needleleaf Evergreen 8 : Boreal Broadleaf Summergreen
9 : Boreal Needleleaf Summergreen
10 : C3 Grass 12 : C3 Agriculture
14 : Water 15 : Snow/ice
Figure 6.New ORCHIDEE PFT maps. The respective fractions of the following eight classes are represented in color scale, from blue (0 %) to red (100 %): bare soil (PFT1), boreal needleleaf evergreen (PFT7), boreal broadleaf summergreen (PFT8), boreal needleleaf summergreen (PFT9), C3 grass (PFT10), C3 agriculture (PFT12), water (PFT14), and snow/ice (PFT15).
346 C. Ottlé et al.: Use of various remote sensing land cover products for PFT mapping over Siberia
7
1 : Bare soil 4 : Temperate Needleleaf Evergreen 5 : Temperate Broadleaf Evergreen
6 : Temperate Broadleaf Summergreen
7 : Boreal Needleleaf Evergreen 9 : Boreal Needleleaf Summergreen
10 : C3 Grass 12 : C3 Agriculture 13 : C4 Agriculture
Figure 7.Difference (new − standard) PFT maps. The percentage differences are represented in color scale, ranging from −1 (blue) to +1 (red).
8
Figure 8.PFT dissimilarity index ranging from 0 (full agreement) to √2 (full disagreement).
This index, which is 0 for full agreement and
√
2 for full dis-agreement, is displayed in Fig. 8. The agreement is best in the northern latitudes and worse in the center of Siberia where the fractions of grasslands and forested PFTs have been more modified.
6 Discussion and conclusion
Land cover mapping is crucial for many environmental stud-ies, and the re-gathering in PFT classes is necessary for the specific purposes of land surface modeling. In this study fo-cused on Siberia, we compared five medium-resolution land
cover maps derived from remote sensing and highlighted some discrepancies mostly linked to the legend definition adopted. The strengths and weaknesses of each product were shown, and the results led us to choose the GlobCover 2005 product because of its highest spatial resolution and more detailed legend. Therefore, a new PFT map at 1 km scale over Siberia has been generated for the ORCHIDEE DGVM. This map shows large differences compared to the standard maps in the differentiation of broadleaf and needleleaf forests and in the representation of the landscape heterogeneity. The fractions of the various ecosystems are smoothed and seem to represent the vegetation diversity better, thanks to the use of higher resolution data sets for the PFT mapping.
These differences should significantly impact the DGVM simulations. Indeed, PFT fractions are used to define the veg-etation characteristics in terms of photosynthesis capacity, phenology, roughness, etc. All these properties are determi-nant for the calculation of the water and carbon fluxes, espe-cially the evapotranspiration and the gross primary produc-tion fluxes. Consequently, such modificaproduc-tions should impact the biosphere–atmosphere exchanges and will be analyzed in further works.
This study also showed the difficulties in linking vege-tation classes to a limited number of PFTs, constrained by global modeling and time computing issues. The absence of a shrub PFT and the solution to distribute the shrub classes among grasslands, bare soils and forests is not satisfactory. Such vegetation types have such different properties that it appears difficult to represent well the energy and mass
transfers with an aggregation of such variability. In the same way, moss- and lichen-dominant ecosystems are not rep-resented in the final PFT map and are assimilated to bare soils, the same for regularly flooded areas and peatlands that have been spread between the grasslands and water classes, which in terms of carbon cycle could lead to significant er-rors. Therefore, the development of new PFT classes in OR-CHIDEE, to represent better these specific northern ecosys-tems, appears to be a priority if one wants to represent boreal ecosystems and their future evolution correctly.
Acknowledgements. The authors are grateful to the French ANR CLASSIQUE and EU-FP7 PAGE21 projects for funding this study (internship of J. Lescure). They acknowledge also the MODIS team, Mark Friedl and Damien Sulla-Menasche, the JPL (M. Simard), the Melnikov Permafrost Institute SB RAS (A. Fedorov), ESA and JRC for making their data sets available for this work. The anonymous reviewers are also acknowledged for their constructive comments, which helped to improve the paper. Edited by: R. Key
References
Arino, O., Trebossen, H., Achard, F., Leroy, M., Brockman, C., and Defourny, P.: The GLOBCOVER Initiative, Proceedings of the MERIS (A) ATSR Workshop 2005 (ESA SP-597), 26–30 September 2005 ESRIN, Frascati, Italy, edited by: Lacoste, H., Published on CDROM, p. 36.1, 2005ESASP.597E.36A, 2005. Arino, O., Ramos Perez, J. J., Kalogirou, V., Bontemps, S.,
Defourny, P., and Van Bogaert, E.: Global Land Cover Map for 2009 (GlobCover 2009), © European Space Agency (ESA) & Université Catholique de Louvain (UCL), doi:10.1594/PANGAEA.787668, 2012.
Bartalev, S. A., Belward, A. S., Erchov, D. V., and Isaev, A. S.: A new SPOT4-VEGETATION derived land cover map of Northern Eurasia, Int. J. Remote Sens., 24, 1977–1982, doi:10.1080/0143116031000066297, 2003.
Bartholomé, E. and Belward, A. S.: GLC 2000: a new ap-proach to global land cover mapping from Earth ob-servation data, Int. J. Remote Sens., 26, 1959–1977, doi:10.1080/01431160412331291297, 2005.
Belward, A., Estes, J., and Kline, K.: The IGBP-DIS Global 1-km Land-Cover Data Set DISCover: A project overview, Pho-togramm. Eng. Remote Sens., 9, 1013–1020, 1999.
Bicheron, P., Leroy, M., Brockmann, C., Krämer, U., Miras, B., Huc, M., Ninô, F., Defourny, P., Vancutsem, C., Arino, O., Ran-era, F., Petit, D., Amberg, V., Berthelot, B., and Gross, D.: GLOBCOVER: a 300 m global land cover product for 2005 us-ing ENVISAT/MERIS time series, Proceedings of the Second Recent Advances in Quantitative Remote Sensing Symposium, Valencia, 538–543, September 2006.
Bicheron, P., Defourny, P., Brockmann, C., Schouten, L., Vancut-sem, C., Huc, M., Bontemps, S., Leroy, M., Achard, F., Herold, M., Ranera, F., and Arino, O.: “GlobCover 2005 – Products de-scription and validation report”, Version 2.1, available on the ESA IONIA website: http://ionia1.esrin.esa.int/, 2008.
Chapin III, F. S., Sturm, M., Serreze, M. C., McFadden, J. P., Key, J. R., Lloyd, A. H., McGuire, A. D., Rupp, T. S., Lynch, A. H., Schimel, J. P., Beringer, J., Chapman, W. L., Epstein, H. E., Eu-skirchen, E. S., Hinzman, L. D., Jia, G., Ping, C.-L., Tape, K. D., Thompson, C. D. C., Walker, D. A., and Welker, J. M.: Role of Land-Surface Changes in Arctic Summer Warming, Science, 310, 657–660, doi:10.1126/science.1117368, 2005.
Delbart, N. and Picard, G.: Modeling the date of leaf appearance in low-arctic tundra, Glob. Change Biol., 13, 2551–2562, 2007. Delbart, N., Kergoat, L., Le Toan, T., L’Hermitte, J., and Picard,
G.: Determination of phenological dates in boreal regions using Normalised Difference Water Index, Remote Sens. Environ., 97, 26–38, 2005.
Di Gregorio, A., Jansen, L. J. M., and Resources, S.: Land Cover Classification System (LCCS): Classification Concepts and User Manual, in: Environment and Natural Resources Ser-vice, GCP/RAF/287/ITA Africover – East Africa Project and Soil Resources, Management and Conservation Service, 157 pages, 28 figures and 3 tables, FAO, Rome, 1998.
Dufresne, J.-L., Foujols, M.-A., Denvil, S., Caubel, A., Marti, O., Aumont, O., Balkanski, Y., Bekki, S., Bellenger, H., Benshila, R., Bony, S., Bopp, L., Braconnot, P., Brockmann, P., Cadule, P., Cheruy, F., Codron, F., Cozic, A., Cugnet, D., de Noblet, N., Duvel, J.-P., Ethé, C., Fairhead, L., Fichefet, T., Flavoni, S., Friedlingstein, P., Grandpeix, J.-Y., Guez, L., Guilyardi, E., Hauglustaine, D., Hourdin, F., Idelkadi, A., Ghattas, J., Jous-saume, S., Kageyama, M., Krinner, G., Labetoulle, S., Lahellec, A., Lefebvre, M.-P., Lefevre, F., Levy, C., Li, Z. X., Lloyd, J., Lott, F., Madec, G., Mancip, M., Marchand, M., Masson, S., Meurdesoif, Y., Mignot, J., Musat, I., Parouty, S., Polcher, J., Rio, C., Schulz, M., Swingedouw, D., Szopa, S., Talandier, C., Terray, P., and Viovy, N.: Climate change projections using the IPSL-CM5 Earth System Model: from CMIP3 to CMIP5, Clim. Dynam., 40, 2123–2165, doi:10.1007/s00382-012-1636-1, 2013. Euskirchen, E. S., McGuire, A. D., Chapin III, F. S., Yi, S., and Thompson, C. C.: Changes in vegetation in northern Alaska un-der scenarios of climate change, 2003–2100: Implications for cli-mate feedbacks, Ecol. Appl., 19, 1022–1043, 2009.
Forbes, B. C., Macias Fauria, M., and Zetterberg, P.: Russian Arc-tic warming and “greening” are closely tracked by tundra shrub willows, Glob. Change Biol., 16, 1542–1554, 2010.
Frey, K. E. and Smith, L. C.: How well do we know northern land cover? Comparison of four global vegetation and wetland prod-ucts with a new ground-truth database for West Siberia, Global Biogeochem. Cy., 21, GB1016, doi:10.1029/2006GB002706, 2007.
Friedl, M., Sulla-Menashe, D., Tan, B., Schneider, A., Ra-mankutty, N., Sibley, A., and Huang, X.: MODIS Collection 5 global land cover: Algorithm refinements and characteriza-tion of new datasets, Remote Sens. Environ., 114, 168–182, doi:10.1016/j.rse.2009.08.016, 2010.
Friedl, M. A., McIver, D. K., Hodges, J. C. F., Zhang, X. Y., Mu-choney, D., Strahler, A. H., Woodcock, C. E., Gopal, S., Schnei-der, A., Cooper, A., Baccini, A., Gao, F., and Schaaf, C.: Global land cover mapping from MODIS: algorithms and early results, Remote Sens. Environ., 83, 287–302, 2002.
Friedlingstein, P., Cox, P., Betts, R., Bopp, L., Von bloh, W., Brovkin, V., Cadule, P., Doney, S., Eby, M., Fung, I., Bala, G., John, J., Jones, C., Joos, F., Kato, T., Kawamiya, M., Knorr, W.,