HAL Id: hal-02079872
https://hal.archives-ouvertes.fr/hal-02079872
Submitted on 7 Nov 2019
HAL is a multi-disciplinary open access
archive for the deposit and dissemination of sci-entific research documents, whether they are pub-lished or not. The documents may come from teaching and research institutions in France or abroad, or from public or private research centers.
L’archive ouverte pluridisciplinaire HAL, est destinée au dépôt et à la diffusion de documents scientifiques de niveau recherche, publiés ou non, émanant des établissements d’enseignement et de recherche français ou étrangers, des laboratoires publics ou privés.
Sparsely Pillared Graphene Materials for
High-Performance Supercapacitors: Improving Ion
Transport and Storage Capacity
Harish Banda, Sandy Périé, Barbara Daffos, Pierre-Louis Taberna, Lionel
Dubois, Olivier Crosnier, Patrice Simon, Daniel Lee, Gaël de Paëpe, Florence
Duclairoir
To cite this version:
Harish Banda, Sandy Périé, Barbara Daffos, Pierre-Louis Taberna, Lionel Dubois, et al.. Sparsely Pillared Graphene Materials for High-Performance Supercapacitors: Improving Ion Transport and Storage Capacity. ACS Nano, American Chemical Society, 2019, 13 (2), pp.1443-1453. �10.1021/ac-snano.8b07102�. �hal-02079872�
OATAO is an open access repository that collects the work of Toulouse
researchers and makes it freely available over the web where possible
Any correspondence concerning this service should be sent
to the repository administrator:
[email protected]
This is an author’s version published in:
http://oatao.univ-toulouse.fr/24657
To cite this version:
Banda, Harish and Périé, Sandy and Daffos, Barbara
and Taberna,
Pierre-Louis
and Dubois, Lionel and Crosnier, Olivier and Simon, Patrice
and Lee,
Daniel and De Paëpe, Gaël and Duclairoir, Florence Sparsely Pillared Graphene
Materials for High-Performance Supercapacitors: Improving Ion Transport and
Storage Capacity. (2019) ACS Nano, 13 (2). 1443-1453. ISSN 1936-0851
desolvation and confinement of electrolytic ions in such pores restrict charge overscreening and result in efficient charge storage. Researchers have consequently explored matching pores sizes to electrolytic ions as an efficient strategy for improved energy storage.17,18However, difficulties in precisely tuning the pores in traditional carbons along with reliably determining pore sizes using gas sorption analyses have been major hindrances to swift progress.2,8
In parallel to ACs, various graphene derivatives have been proposed as potential materials for SCs owing to their high electrical conductivities, large surface areas, and mechanical flexibilities.19
Reduced graphene oxide (RGO), readily prepared from graphene oxide (GO), is extensively studied as a model graphene like material.20RGO displays good power capability but suffers from low capacitances, as the reduced graphene sheets partially restack through π−π interactions.21 Various three dimensional (3D) architectures based on graphene (aerogels, films, and fibers) are being evaluated to mitigate such restacking with a focus on tuning the material porosity.22 Exploring the layered structures of graphene derivatives for ion sorption could be another complementary approach to tuning the material porosity. The graphitic arrangement with 3.3 Å interlayer separation in restacked graphene derivatives is too small for ion sorption but could be tuned with an intercalant to exhibit an expanded layer structure.23−26It can be speculated that such expanded layered structures could offer additional ion sorption sites through ion desolvation and confinement effects as earlier seen with ultramicropores in CDCs.11
Recently, we synthesized a class of reduced pillared graphene materials (RPs) with varied interlayer separation using alkyl diamines as pillars and have investigated their use in SCs.25 This comprehensive study using ions with various sizes showed that ions could access the interlayer graphene galleries as soon
as the naked ion sizes are smaller than the gallery height (defined by d spacing). Although this preliminary study has demonstrated ion sieving in pillared graphene materials, the observed capacitances remained only marginally better than RGO with appropriate electrolytic ions.25 Further electro chemical impedance analyses have also shown extremely limited ion transport in these galleries.27 These poor performances probably arose from excessive filling of the galleries with diamine pillars, leading to impeded ion transport to active sites.28,29
Herein, we report a substantial and simultaneous improve ment of both the power and energy densities in pillared materials following a two pronged strategy. First, the number of diamine pillars were systematically lowered for improved ion transport in the interlayer galleries of RPs. Second, a 3D macroporous graphene hydrogel was synthesized with this low density of pillars and with a different bulk porosity. Although pillared graphene materials with diamine cross linkers were proposed a decade ago, the nature of the cross linking is still debated.23,24 Using one dimensional (1D) and two dimen sional (2D) solid state nuclear magnetic resonance (ssNMR) spectroscopy, we confirm the covalent attachment between diamines and graphene and notably demonstrate that the cross linking is similar for materials with different pillar densities and as well as for the graphene hydrogels. Electrochemical analysis using various electrolytic ions in SCs led to observation of ion sieving30 in pillared graphene hydrogels. Ion sorption in the interlayer galleries of the pillared materials with tuned diamine pillar content enabled twice the capacitances (200 F·g−1) compared to RGO (107 F·g−1). Low densities of the gels were overcome by using an ambient drying approach, which led to high volumetric capacitance values of 210 F·cm−3. The definitive evidence of covalent attachment of diamine pillars with control over pillar density combined with Scheme 1. Synthesis of Reduced Pillared Graphene Materials (RPs) and Pillared Graphene Hydrogels (GHs) using 1,6 Diaminohexanea
a(a) 6 RPs are synthesized in two step process, cross linking and reduction, and (1) dried in vacuum oven at 100°C for 24 h. (b) 6 GHs are
synthesized in a one step process and either (2) freeze dried or (3) ambient dried (25°C) for 2 days. (c) The graphitic and cross linked domains in each of the materials are represented schematically. The selected materials with chosen equivalents for the electrochemical analyses are presented here in the digital picture with a ruler for scale (cm).
their stability during long electrochemical tests (40,000 cycles) brings important perspectives to research on pillared materials for high performance SCs.
RESULTS AND DISCUSSION
GO has been extensively used as an ideal precursor for the synthesis of various graphene derivatives owing to its abundant oxygen functional groups.31The carboxylic groups at the edges and the epoxy groups distributed on the sheets offer substantial possibilities for functionalization with organic linkers.32,33 Among others, alkyl diamines are efficient bifunctional groups that could react with these functionalities and cross link two GO sheets to form pillared graphene materials (Ps).17,23We chose 1,6 diaminohexane (6 diamine) as the pillar molecule due to the resulting d spacing (7.8 Å) and the ion sizes of tetraalkylammonium tetrafluoroborate (TAABF4) salts (6.8− 9.5 Å for the cations and 4.8 Å for the anions).25 After the
initial functionalization of GO with 6 diamine, the resulting 6 Ps were chemically reduced with hydrazine hydrate to give 6 RPs (Scheme 1a). Diamine functionalized graphene hydrogels (6 GHs) were synthesized in a one step hydrothermal process by reacting GO with 6 diamine (Scheme 1b).
Despite being synthesized in a one step process, the 6 GHs are sufficiently reduced during the hydrothermal process.34 One equiv. of diamine to GO was chosen as an excess condition where the 2 Ns in diamine are available for 1 C in GO (see the Experimental Section for more details), and a series of 6 RPs and 6 GHs were synthesized using X equivalents of diamines with respect to GO and are named as 6 RP X or 6 GH X.“RGO” has also been synthesized as a control material by direct reduction of GO with hydrazine hydrate. The synthesized materials were characterized physico chemically using various spectroscopic techniques, and the porosity characteristics were analyzed using scanning electron Figure 1. Solid state MAS NMR spectra recorded at 9.4 T (1H Larmor frequency of 400 MHz) using a MAS frequency of 12 kHz. (a) {1H
}13C cross polarization (CP) spectra (natural isotopic abundance) of graphene oxide (GO) and unreduced pillared materials (6 Ps) with
varied diamine equivalents, recorded at 300 K. (b) {1H }15N CP spectra of unreduced pillared materials synthesized with different
equivalents of15N labeled 1,6 diaminohexane, recorded at 300 K. (c) 2D15N−13C TEDOR chemical shift correlation spectrum of 6 P 0.05
synthesized with15N labeled 1,6 diaminohexane, recorded at 100 K. Since the samples with varying numbers of equivalents were chemically
reduced to different extents, consequently requiring different NMR acquisition times for a high signal to noise ratio, the spectra have therefore been scaled arbitrarily, and no relative quantitative information can be obtained.
microscopy (SEM) and gas sorption studies. 1D and 2D magic angle spinning (MAS) ssNMR spectroscopy was performed using naturally abundant13C and15N labeled materials.
Pillared graphene materials were proposed in the early 2000s as interesting GO derivatives that could be readily prepared through reaction of the surface epoxy groups with nucleophilic primary amines.26 Intercalation studies using diamines of various alkyl chain lengths have later allowed the tuning of the interlayer spacing of these graphene based materials.23 However, the nature of the interaction (i.e. covalent and/or noncovalent) between alkyl diamines and GO sheets is not clearly understood. Fourier transform infrared (FTIR) analysis has mainly been used to study the presence of diamine in the pillared materials (Figure S1).26 Indirect strategies such as swelling through solvent insertion,24 sequential amine reactions,23 and charge−discharge under polarization have been proposed to test the robustness of the pillared structures.25 Although each of the indirect analyses supports the assumption of a covalent bond at each end of the diamine, a direct analysis of the interactions is still lacking. Direct observation and comparison of 6 RP with RGO through transmission electron microscopy (TEM) showed ordered graphene stacks in RGO, whereas the stacks in 6 RP appear rugose and non uniformly aligned, suggesting a chemical functionalization of the graphene sheets (Figure S2). Further atomic force microscopy (AFM) analyses showed elevated height profile in 6 RP compared to RGO, confirming the growth of particles in the z direction due to cross linking of graphene sheets by diamines (Figure S3). However, these microscopic observations along with the aforementioned indirect analyses do not provide direct evidence of the nature of interaction between diamines and graphene sheets. Hence, we obtained 13C ssNMR spectra to detect the amine functionalization of GO, which was shown to occur via the epoxy groups,35and investigated13C and15N ssNMR spectra
to directly study the atomic environments of the graphene sheets and the nature of interaction with pillar molecules.
13C ssNMR studies were conducted on GO and 6 Ps
synthesized with different equivalents of diamines (0.05, 0.20, and 1.00), as shown in Figure 1. These experiments were restricted to 6 Ps rather than 6 RPs as the fully reduced samples display high electric conductivity, which prohibits magic angle sample spinning (MAS) ssNMR studies due to resulting problems in tuning the radio frequency circuit.36 Moreover, as the 6 P samples are already partially reduced due to the mild reducing nature of the alkyl diamine, large degradation in NMR spectral quality is already observed for increasing numbers of equivalents. The13C NMR spectrum of the GO starting material shows the presence of CO from carbonyls (δ(13C) ∼ 150−200 ppm), aromatic carbons (δ(13C) ∼ 120−140 ppm), C−OH from hydroxyls (δ(13C) ∼ 70 ppm), and C−O−C from epoxides (δ(13C)∼ 60 ppm)
(Figure 1a).32,33,37After reaction with 1,6 diaminohexane, the
13C spectra of the 6 Ps are clearly different than that of GO.
Additional 13C signals arising from the alkyl chains of the
diamine (δ(13C) ∼ 10−50 ppm) and RGO (δ(13C) ∼ 120
ppm) appear. Carbons in the alkyl chains inα position to the Ns of the diamines are also seen as a discrete13C peak (δ(13C) ∼ 40 ppm) in 6 P 0.05. In 6 Ps, signals from the C−O−C epoxides and C−OH hydroxyls are drastically decreased relative to GO, and the signals from CO moieties shift to amide positions (δ(13C) ∼ 150−180 ppm). With a low number of diamine equivalents (6 P 0.05 and 6 P 0.2), some C−OH and C−O−C (δ (13C) ∼ 60−70 ppm) functions remain, but the majority have been removed. These observations suggest covalent attachment of the amine groups in pillar molecules with epoxide and carboxylic groups on GO sheets. Still, it is noteworthy here that a simple reduction step and direct adsorption of the pillar molecule may also resemble the aforementioned spectral features.
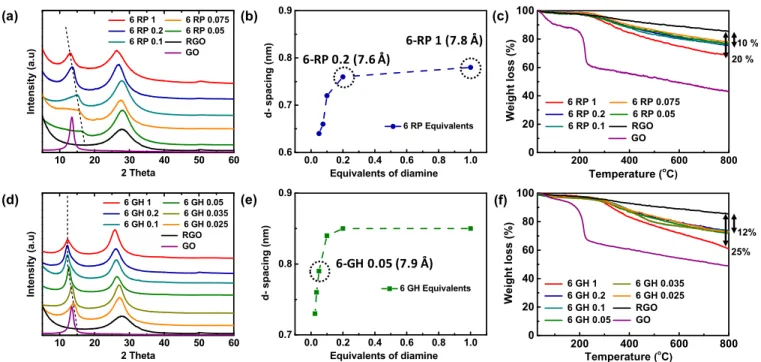
Figure 2. (a) XRD patterns of 6 RPs synthesized with various equivalents and (b) the correspondingd spacing values of the cross linked arrangement (CL) (peaks under dotted line). (c) TGA of various 6 RPs in the 30−800 °C temperature range at 5 °C·min−1ramp rate. (d) XRD patterns, (e)d spacing values from CL peaks, and (f) TGA analyses of 6 GHs synthesized with varied equivalents of diamine. The specific 6 RPs and 6 GH chosen for electrochemical studies are highlighted with a dotted circle.
The nature of the interaction between the pillar molecules and graphene was thus further investigated using15N labeled diamine as the pillar. The15N ssNMR spectra of15N 6 P 0.05
and 15N 6 P 0.2 display three main peaks (Figure 1b): (i)
δ(15N)∼ 100−200 ppm, assigned to N from amides (formed
after reaction of diamine with carboxylic groups on GO sheets), (ii)δ(15N)∼ 83 ppm, which notably arises from N in α position relative to an aromatic carbon or a C−OH, and (iii) δ(15N)∼ 34 ppm, which is from unreacted amines. The signals
at higher nitrogen chemical shifts (δ(15N) > 50 ppm) confirm
that the pillar molecule is covalently grafted, while the peak from unreacted amine reveals that some remaining pillar molecules are either adsorbed on the graphene surface or are monografted. It is possible that the unreacted amine from monografted pillar molecules is able to form hydrogen bonds with functions on the opposite graphene layer, providing additional (noncovalent) interactions.
To gain further evidence on the location of the grafted pillar molecules, a through space (dipolar) 2D15N−13C correlation
spectrum was recorded on 15N 6 P 0.05. The zfiltered transferred echo double resonance (TEDOR) experiment38,39 was employed for this purpose, with short mixing time (1.3 ms) so as to detect only directly bonded15N−13C pairs.39
The
13C peak from the C−N carbons of the alkyl chain (δ(13C)∼
40 ppm) correlates with the unreacted amine nitrogen signals (δ(15N) ∼ 34 ppm), as one would expect for physisorbed or monografted alkyl diamines. Clear correlation peaks can be observed between amide nitrogen (δ(15N) ∼ 110−170 ppm) and amide CO (δ(13C) ∼ 165−180 ppm) as well as
between these same Ns and pillar C−N carbons (δ(13C)∼ 40 ppm) (Figure 1c). This proves that the diamines have reacted with the carboxyl functions on the GO sheets. Finally, the C− N pillar Cs (δ(13C)∼ 40 ppm) correlate with the −C−N−C−
Ns in α position to aromatics or hydroxyls (δ(15N) ∼ 83 ppm), indicating that the diamine has been grafted to the graphene surface through reactions with epoxides. Overall, these 2D ssNMR experiments on the pillared graphene materials confirm the covalent grafting of alkyl diamines to the basal planes and edges of graphene sheets. Note that 6 GH 0.05 was also examined with ssNMR, and it exhibits the same13C and15N spectral features as 6 P 0.05 (Figure S4).
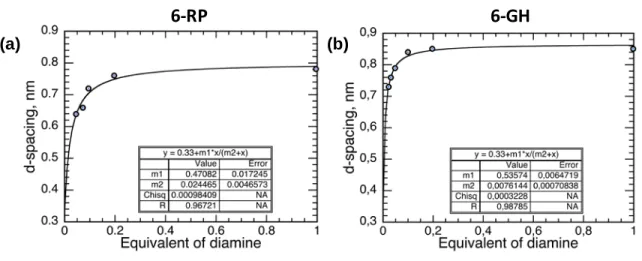
X ray diffraction (XRD) patterns were obtained to directly analyze the layered structures in the synthesized materials (Figure 2a,d). Freeze dried GO shows a sharp peak at a 2θ of 13.5°, which relates to a d spacing of 7.6 Å, indicating a high degree of oxidation of the oxidized graphite precursor. Upon direct reduction of GO with hydrazine hydrate, the resulting RGO displays a broad peak at 28° corresponding to a graphite like pattern (G), suggesting removal of oxygen groups and partial restacking of the reduced graphene sheets.40 Diamine functionalization of GO in 6 RPs and 6 GHs results in two distinct diffraction peaks around 25−27° and 11−13°. The peaks at higher angles correspond to G stacking and indicate a reduction degree close to that of RGO. The peaks below 20°, corresponding to diamine intercalation and cross linking (CL) of the graphene sheets, shift with respect to the number of equivalents used.25With increasing number of equivalents, the CL peaks of both 6 RPs and 6 GHs systematically shift towards lower angles (higher d spacing values). The obtained d spacing values for 6 RP (Figure 2b) and 6 GH (Figure 2e) initially increase and then saturate at 0.2 and 1 equiv. for 6 RP and 6 GH, respectively. The observed d spacing valuesfit well into a chemisorption type model and suggest a grafting of the
alkyl diamines on the graphene surfaces instead of a simple physisorption (Figure S5), in line with the NMR data.
A closer look at the shape and position of the CL peak reveals important information about the evolution of 6 RP and 6 GH structures with different number of equivalents. 6 RP shows relatively sharper peaks with 1 and 0.2 equiv., whereas increasingly broad and less intense peaks are seen with lower equivalents. On the other hand, whatever the number of equivalents, 6 GHs exhibit similar CL peak intensities and width. Nevertheless, in both materials, lower equivalents of diamine lead to a lower average d spacing, probably due to reduced availability of diamines to react with all epoxides (vide supra). 6 RP saturates at a lower d spacing of∼7.8 Å, whereas 6 GH saturates at 8.5 Å (cf. Figure 2b,e). Moreover, 6 GH saturates faster, at 0.1−0.2 equiv., suggesting a relatively higher density of grafted diamines. This evolution of shapes and the higher d spacing values in 6 GH could probably be related to the stronger reaction conditions used to prepare GHs compared to RPs. A comparison of the 13C ssNMR spectra of 6 P 0.05 and 6 GH 0.05 (Figure S4a) shows that 6 GH 0.05 consumes nearly all of the epoxides from the GO precursor, whereas 6 P 0.05 still has a considerable number of unreacted epoxides. Moreover, the15N spectra show a relatively narrow peak for unreacted amine in 6 P 0.05 and a relatively less intense and broader corresponding peak in 6 GH 0.05 (Figure S4b), suggesting that more amines have reacted in the 6 GHs and also that those that remain unreacted in the 6 GHs are blocked in various environments, probably through hydrogen bonds with the opposite graphene layer. The stronger reaction conditions used to prepare 6 GHs thus lead to enhanced cross linking with diamines and result in higher d spacing values for same number of equivalents compared to 6 RPs. These reaction conditions enable the vast majority of diamines anchored on one GO sheet to find a functional group on another GO sheet, growing larger cross linked particles, which can explain the sharper CL peaks observed for 6 GHs.
The thermal degradation responses of the materials under N2are shown inFigure 2c,f. GO displays two distinct weight loss events corresponding to the removal of adsorbed water below 100 °C and the decomposition of surface oxygen functional groups around 200°C. A steady drop beyond 200 °C is generally attributed to gradual removal of stable functionalities.41 RGO shows only a slight weight loss throughout the temperature range, suggesting an effective removal of oxygen groups in its synthesis. Both 6 RPs and 6 GHs show a broad weight loss between 300 and 500°C and a gradual weight loss similar to RGO. This broad weight loss beyond the boiling point of 6 diamine (204°C) is attributed to the removal of nonlabile 6 diamine species.25Moreover, the absence of loss due to moisture or oxygen functionalities further confirms the reduced nature of the functionalized materials. In addition, the weight losses between different 6 RPs or 6 GHs are smaller for lower equivalents, signaling a reduction in diamine grafting densities. Taking RGO as the reference, 6 RP displays weight losses of 20 and 10% with 1 and 0.2 equiv., respectively, whereas 6 GH exhibits 25 and 12% (for the same number of equivalents).
In summary, GHs and RPs are both cross linked with alkyl diamines, are reduced, and are chemically similar despite synthesis under different reaction conditions. To study the impact of the number of diamine pillars in the galleries and the bulk porosities on the overall ion sorption in SCs, we chose 6 RP 1 as the sample with the highest number of diamine pillars
GH 0.05 and highlight them as suitable materials to study the ion transport in between graphene layers.
Impedance Analyses. The ion transport dynamics in the synthesized materials were studied using EIS measurements. OneM TEABF4/AN was chosen as the electrolyte due to its
sufficiently small ion sizes that could access the interlayer galleries of the pillared materials. Impedance responses were recorded at 1 V and−1 V vs Ag to obtain the distinct anion and cation transport characteristics, respectively, and the normalized complex plane Nyquist plots are displayed in Figure 3b and Figure S9a. These plots can be divided into three regions of high, medium, and low frequencies.47,48 At high frequencies, only the electrical conductivity of the electrode together with bulk electrolyte ionic conductivity can be seen; thus, SC electrodes behave like a resistor (Z′′ = 0). At low frequencies, a sharp increase of the imaginary part of the impedance (−Z′′), related to capacitive behavior, is seen. The intermediate 45° region is associated with the electrolyte resistance arising from ion transport in the porous network of the electrode. At 1 V vs Ag, the pillared materials and RGO display similar capacitive like Nyquist curves and indicate comparable anion transport behavior (Figure S9a). A closer look at the high frequency region (inset) shows a slightly longer 45° region for 6 RP 1 compared to others. The slight differences of ion transport are more obvious under −1 V vs Ag when the larger TEA+cations are involved. At−1 V vs Ag, 6
RP 1 exhibits a large 45° region in the medium frequency range compared to the others (Figure 3b), signaling higher ion transport resistance. 6 RP 0.2 and 6 GH 0.05, which possess a low number of diamine pillars, show significantly improved ion transport with a smaller 45° region than 6 RP 1. This difference in ion transport highlights the merits of having fewer pillars. Interestingly, 6 RP 0.2 and 6 GH 0.05 seem to show similar curves despite their differences in material macroporosity.
The obtained Nyquist plots give an idea about the relative impedances of the materials but are difficult to use to extract information about frequencies. The Complex Capacitance model, reported by Taberna et al.49and derived from Cole and Cole,50provides an easier way of studying frequency responses of the materials. The real and imaginary parts of the capacitance, defined as C′(w) and C′′(w) in eqs 1 and 2, respectively, represent the available stored energy with respect
to frequency and energy losses during the charge storage, respectively. Z′(w) and Z′′(w) are the real and imaginary parts of impedance Z(w), where w is the frequency.
C w Z w w Z w ( ) ( ) ( )2 ′ = − ″ | | (1) C w Z w w Z w ( ) ( ) ( )2 ′′ = − ′ | | (2)
As C′′ represents the irreversible losses in a SC, we studied C′′(w) with respect to Z′(w) (Figure 3c andFigure S6b). Such an analysis relates energy losses to the impedance in various frequency regions and also enables an easier determination of the distinct ionic resistances (Ri) in the materials.25,27 The C′′(w) vs Z′(w) plots at 1 V vs Ag show clear differences between 6 RP 1 and the other materials (see Figure 3c and Figure S9b). 6 RP 1 displays a broader curve and a maximum imaginary capacitance that occurs at higher resistances compared to RGO, 6 RP 0.2, and 6 GH 0.05. With the larger TEA+ cation at −1 V vs Ag, the maximum imaginary
capacitance of 6 RP 1 shifts to even higher resistances (see Figure 3c). The Ri values at both potentials were readily obtained from the C′′(w) vs Z′(w) curves and are shown in Figure 3d. Rivalues for 6 RP 0.2 and 6 GH 0.05 are between 6 and 12 mΩ·g under 1 V and −1 V, whereas 6 RP 1 displays higher Ri values of 15 and 20 mΩ·g, respectively. These quantified ionic resistances highlight the impact of the number of pillars on the ion transport inside the galleries. Importantly, Ri values obtained for the pillared materials with lower
numbers of equivalents (6 RP 0.2 and 6 GH 0.05) are closer to that of RGO, which has no cross linked galleries. This demonstrates the significance in optimizing these pillared materials.
The imaginary C′′(w) vs w curves have a maximum at a frequency f0that defines the transition between purely resistive
and capacitive behaviors of a SC (see Figure S10a,b). This frequency, known as the knee frequency, defines the time constant (τ0) as the minimum time required to extract half of the capacitance from a SC.49Theτ0values of a SC depend on
the combination of all the ionic, electrical, and cell resistances. 6 RP 0.2 and 6 GH 0.05 exhibit τ0 values of 5 and 7 s,
respectively, under both polarizations and are close to that of RGO (5 s). 6 RP 1 shows high values of 13 and 17 s under Scheme 2. Schematic Representation of the Ion Transport in the Synthesized Materialsa
aIon sorption in RGO occurs on the graphene surfaces in micro/mesopores and the ion transport is relatively easy. In pillared materials, in addition
to the external graphene surfaces, ion sorption occurs in the inter layer galleries. The diaminefilling density in the galleries regulates the ion transport in these materials.
images indicate clear shrinking and densification upon ambient drying (seeFigure S12).
Two electrode symmetrical cells of 6 GH 0.05 and 6 GH 0.05 AD were fabricated and studied in a 2.8 V window. The CVs obtained at 0.02 V·s−1in TEABF4/AN show rectangular shaped curves with similar current densities for both 6 GH 0.05 and 6 GH 0.05 AD (see Figure 4a). The gravimetric power capabilities of the materials from 0.01 to 1 V·s−1show identical profiles for both materials (seeFigure 4b). The close performances of the freeze dried and ambient dried pillared materials suggest that the shrinking of the macroporous network in 6 GH 0.05 AD results in negligible loss to the overall ion sorption and ion transport characteristics. Further EIS analyses of both the samples under a negative polarization of −1 V vs Ag have confirmed their similar ion transport characteristics. Nyquist plots and additional analyses (Ima C vs Real Z and Bode diagrams) from the frequency responses of both the materials appear identical (Figure S13) and closeτ0
values of 7.1 and 7.1 s and Rivalues of 13 and 15 mΩ·g for 6 GH 0.05 and 6 GH 0.05 AD, respectively, were noted. These observed similarities in ion transport characteristics despite densification could be attributed to the ambient drying process which shrinks large macropores into mesopores that are large enough to support facile ion transport.
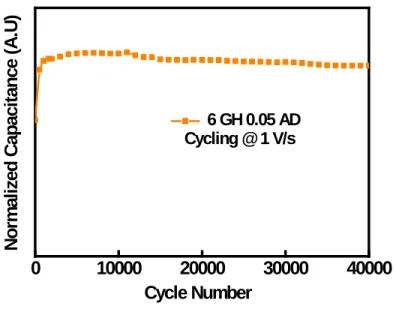
Upon ambient air drying, the volumetric capacitance of 6 GH 0.05 AD has dramatically increased with respect to that of 6 GH 0.05: from 4 to 200 F·cm−3. Notably, this value is four times higher than that of RGO, calculated to be around 50 F· cm−3(seeFigure 4c). Cycling of 6 GH 0.05 AD at a high scan rate of 1 V·s−1 for 40,000 cycles resulted in 93% capacitance retention with nearly 100% columbic efficiency (Figure S14). Additionally, various spectroscopic (XPS, IR, NMR) and electrochemical analyses performed on the cycled electrodes have confirmed the robustness of the pillared structure during electrochemical cycling (Figures S15 and S16). The observed volumetric values are among the best for carbon based SCs with double layer charge storage (see Table S4 for a comparison).53 The straightforward single step synthesis of 6 GH and the subsequent ambient drying process add further merit to the current approach compared to others. Addition ally, the proposed pillared materials also provide avenues toward even higher performances. Improving the type of pillar (e.g. electrochemically active), the relative content of cross linked particles compared to graphitic like arrangements, and/ or trapping redox molecules in the galleries could be a few such strategies. In addition to thefield of energy storage, the pillared graphene architectures offer great scope for applications in other scientific fields such as gas storage, water desalination, and membranefiltration.
CONCLUSIONS
Pillared graphene materials were synthesized to mitigate the graphitic restacking in graphene based materials by separating graphene sheets with a pillar molecule, providing additional ion sorption sites for SCs. The physicochemical characterization of the materials demonstrated that the pillar molecule acts as a spacer, forming cross linked graphene galleries. In particular, ssNMR studies confirmed the covalent nature of the interaction between the pillars and graphene sheets. Thus, the synthesized graphene galleries are structurally robust for long cycle life in SCs. The electrochemical performances of the synthesized materials in SCs were compared to RGO, which has no pillared structures. Pillared graphene materials
synthesized with an optimized number of pillars exhibit high specific capacitances of 185 F·g−1 (vs 107 F·g−1 for RGO), confirming the enhanced electrochemically active surface area. The number of pillars in the galleries was found to have a significant influence on the SC performances; a dense filling of the galleries led to lower capacitances and poor power capability, whereas sparsefilling improved both. These results show that the optimized number of pillars preserves gallery structures, provides ion access to new active sites, and offers efficient ion transport pathways. Finally, pillared graphene hydrogels, synthesized to contain additional 3D interconnected porous networks, delivered even higher capacitances of 200 F· g−1and, once air dried, volumetric capacitances of 210 F·cm−3. Overall, covalent and sparsely pillared structures add encouraging perspectives toward achieving high performance graphene based SCs.
EXPERIMENTAL SECTION
Reduced Pillared Graphene Material (6-RPs). An aqueous solution of well dispersed 5 mg·mL−1GO was prepared and used as a
precursor for all syntheses (details inSupporting Information).546 RPs were synthesized in a two step process of cross linking with 1,6 diaminohexane and further chemical reduction with hydrazine hydrate. One molar equivalents of diamine to GO was used as a sufficiently excess condition providing 2 molar equivalents of N for 1 C in GO. The formula weight of the synthesized GO was calculated as 13.01 g from the elemental composition obtained by XPS. Materials with 1, 0.2, 0.1, 0.075, and 0.05 equiv of diamine were synthesized using 75 mL of GO (28 mmol) and 3.27, 0.651, 0.325, 0.243, and 0.162 g of 1,6 diaminohexane, respectively. 75 mL of GO and diamine dissolved in 75 mL of ethanol was sonicated for 10 min and then heated under reflux at 80 °C for 24 h while being continuously stirred. The reaction mixtures were later cooled,filtered through P3 filter, and washed with copious amounts of ethanol, water, and ethanol again, sequentially. The obtained product was then dried in the vacuum oven at 100 °C overnight. The obtained pillared materials were further reduced by treating with excess hydrazine hydrate at 90°C for 24 h while being continuously stirred. The obtained reduced pillared materials were cleaned with an excess of water, dried under a vacuum at 100°C, and labeled as the respective 6 RPs.
Pillared Graphene Hydrogels (6-GHs). An aqueous solution of well dispersed 5 mg·mL−1GO was prepared and used as a precursor
for all syntheses. 6 GHs were synthesized in a one step hydrothermal process using 1,6 diaminohexane as cross linking agent. Each synthesis was performed with 15 mL of GO (5.6 mmol) with 1, 0.2, 0.1, 0.05, 0.035, and 0.025 equiv of diamine using 1.21, 0.242, 0.121, 0.060, 0.042, and 0.016 g of 1,6 diaminohexane, respectively. Fifteen mL of GO and the required amount of diamine were sonicated for 10 min and then reacted in a sealed 23 mL vessel at 180 °C for 17 h. The resulting hydrogel was cleaned with excess ethanol and water sequentially and freeze dried using liquid N2to obtain 6
GH aerogels. Ambient dried gels were obtained by drying the hydrogels at room temperature for 2 days, and the remaining moisture was removed by heating in vacuum at 80°C overnight.
ASSOCIATED CONTENT
*
Supporting InformationThe Supporting Information is available free of charge on the ACS Publications websiteat DOI:10.1021/acsnano.8b07102. Details about the instrumentation, material character ization, and further electrochemical studies of the materials (PDF)
AUTHOR INFORMATION
Corresponding Author
Characterization of 13C Labeled Graphite Oxide. Science 2008, 321, 1815−1817.
(34) Xu, Y.; Sheng, K.; Li, C.; Shi, G. Self Assembled Graphene Hydrogel via a One Step Hydrothermal Process. ACS Nano 2010, 4, 4324−4330.
(35) Vacchi, I. A.; Spinato, C.; Raya, J.; Bianco, A.; Ménard Moyon, C. Chemical Reactivity of Graphene Oxide towards Amines Elucidated by Solid State NMR. Nanoscale 2016, 8, 13714−13721.
(36) Freitas, J. C. C.; Emmerich, F. G.; Cernicchiaro, G. R. C.; Sampaio, L. C.; Bonagamba, T. J. Magnetic Susceptibility Effects on 13C MAS NMR Spectra of Carbon Materials and Graphite. Solid State Nucl. Magn. Reson. 2001, 20, 61−73.
(37) Szabó, T.; Berkesi, O.; Forgó, P.; Josepovits, K.; Sanakis, Y.; Petridis, D.; Dékány, I. Evolution of Surface Functional Groups in a Series of Progressively Oxidized Graphite Oxides. Chem. Mater. 2006, 18, 2740−2749.
(38) Hing, A. W.; Vega, S.; Schaefer, J. Transferred Echo Double Resonance NMR. J. Magn. Reson. (1969 1992) 1992, 96, 205−209.
(39) Jaroniec, C. P.; Filip, C.; Griffin, R. G. 3D TEDOR NMR Experiments for the Simultaneous Measurement of Multiple Carbon− Nitrogen Distances in Uniformly 13C,15N Labeled Solids. J. Am. Chem. Soc. 2002, 124, 10728−10742.
(40) Banda, H.; Aradilla, D.; Benayad, A.; Chenavier, Y.; Daffos, B.; Dubois, L.; Duclairoir, F. One Step Synthesis of Highly Reduced Graphene Hydrogels for High Power Supercapacitor Applications. J. Power Sources 2017, 360, 538−547.
(41) Stankovich, S.; Dikin, D. A.; Piner, R. D.; Kohlhaas, K. A.; Kleinhammes, A.; Jia, Y.; Wu, Y.; Nguyen, S. T.; Ruoff, R. S. Synthesis of Graphene Based Nanosheets via Chemical Reduction of Exfoliated Graphite Oxide. Carbon 2007, 45, 1558−1565.
(42) Brunauer, S.; Emmett, P. H.; Teller, E. Adsorption of Gases in Multimolecular Layers. J. Am. Chem. Soc. 1938, 60, 309−319.
(43) Jagiello, J.; Olivier, J. P. 2D NLDFT Adsorption Models for Carbon Slit Shaped Pores with Surface Energetical Heterogeneity and Geometrical Corrugation. Carbon 2013, 55, 70−80.
(44) Ue, M. Mobility and Ionic Association of Lithium and Quaternary Ammonium Salts in Propylene Carbonate and Γ Butyrolactone. J. Electrochem. Soc. 1994, 141, 3336−3342.
(45) Mysyk, R.; Raymundo Piñero, E.; Pernak, J.; Béguin, F. Confinement of Symmetric Tetraalkylammonium Ions in Nano porous Carbon Electrodes of Electric Double Layer Capacitors. J. Phys. Chem. C 2009, 113, 13443−13449.
(46) Lin, R.; Huang, P.; Ségalini, J.; Largeot, C.; Taberna, P. L.; Chmiola, J.; Gogotsi, Y.; Simon, P. Solvent Effect on the Ion Adsorption from Ionic Liquid Electrolyte into Sub Nanometer Carbon Pores. Electrochim. Acta 2009, 54, 7025−7032.
(47) Portet, C.; Taberna, P. L.; Simon, P.; Laberty Robert, C. Modification of Al Current Collector Surface by Sol−Gel Deposit for Carbon−Carbon Supercapacitor Applications. Electrochim. Acta 2004, 49, 905−912.
(48) de Levie, R. On Porous Electrodes in Electrolyte Solutions: I. Capacitance Effects. Electrochim. Acta 1963, 8, 751−780.
(49) Taberna, P. L.; Simon, P.; Fauvarque, J. F. Electrochemical Characteristics and Impedance Spectroscopy Studies of Carbon Carbon Supercapacitors. J. Electrochem. Soc. 2003, 150, A292−A300.
(50) Cole, K. S.; Cole, R. H. Dispersion and Absorption in Dielectrics I. Alternating Current Characteristics. J. Chem. Phys. 1941, 9, 341−351.
(51) Kondrat, S.; Wu, P.; Qiao, R.; Kornyshev, A. A. Accelerating Charging Dynamics in Subnanometre Pores. Nat. Mater. 2014, 13, 387−393.
(52) Tao, Y.; Xie, X.; Lv, W.; Tang, D. M.; Kong, D.; Huang, Z.; Nishihara, H.; Ishii, T.; Li, B.; Golberg, D.; Kang, F.; Kyotani, T.; Yang, Q. H. Towards Ultrahigh Volumetric Capacitance: Graphene Derived Highly Dense but Porous Carbons for Supercapacitors. Sci. Rep. 2013, 3, 2975.
(53) Liu, C.; Yan, X.; Hu, F.; Gao, G.; Wu, G.; Yang, X. Toward Superior Capacitive Energy Storage: Recent Advances in Pore Engineering for Dense Electrodes. Adv. Mater. 2018, 30, 1705713.
(54) Ashok Kumar, N.; Gambarelli, S.; Duclairoir, F.; Bidan, G.; Dubois, L. Synthesis of High Quality Reduced Graphene Oxide Nanosheets Free of Paramagnetic Metallic Impurities. J. Mater. Chem. A 2013, 1, 2789−2794.
1
Sparsely Pillared Graphene Materials for High
Performance Supercapacitors: Improving Ion
Transport and Storage Capacity
Harish Banda†, Sandy Périé†, Barbara Daffos¶‡, Pierre-Louis Taberna¶‡, Lionel Dubois†,
Olivier Crosnier¶§, Patrice Simon¶‡, Daniel Lee†, Gaël De Paëpe† and Florence Duclairoir†*
† Univ. Grenoble Alpes, CEA, CNRS, INAC, Grenoble, 38000, France.
‡ CIRIMAT, Université de Toulouse, CNRS, INPT, UPS, 31062 Toulouse, France.
§ Institut des matériaux Jean Rouxel (IMN), Université de Nantes, CNRS, Nantes, 44300,
France.
2
Graphene Oxide (GO) synthesis: GO synthesis was performed by following a modified
Hummers and Offeman’s method.
1-3Graphite powder (3.1 g) was dispersed in H
2
SO
4(91 ml)
under stirring into a 1 L beaker placed in an ice bath. NaNO
3(1.5 g) was then added and the
reaction media was stirred vigorously while maintaining the temperature under 2
oC. After 2 h,
KMnO
4(9 g) was added portion-wise to keep the mixture temperature below 4
oC. The reaction
media was kept under stirring at such controlled temperature for a further 1 h, before it was let to
reach room temperature. Then water (100 mL) was added slowly over a period of 20 minutes
maintaining the temperature under 95
oC. The beaker was then placed into an oil bath and stirred
at 95
oC. After 1.5 h, water (300 mL) was added, making sure the temperature did not rise above
85
oC. Stirring was continued for 1.5 h and then the reaction mixture was let to reach room
temperature. H
2O
2(30 mL) was added and the mixture was stirred for 1 h. Finally, water (450 mL)
was added and the mixture was stirred overnight.
The mixture was then filtered through a P4 fritted Buchner filter (10-15 μm). The solid graphene
oxide cake was re-dispersed in 600 mL of water, and the dispersion was homogenized under
stirring for 1 h and sonication for a further hour. The mixture was then acidified with 100 ml of
HCl and left under stirring overnight. Finally, the GO dispersion was filtered and centrifuged
repeatedly until the supernatant reached pH 5. GO solution with a concentration of 5 mg.ml
-1was
obtained by carefully measuring the weight of 10 ml of lyophilized GO.
Characterization techniques: The thermogravimetric analysis (TGA) of all samples were
performed with Setaram TGA 92 at a heating ramp rate of 5
oC.min
-1from 30
oC to 800
oC under
N
2atmosphere. The crystallographic structures of the materials were determined by a wide-angle
X-ray diffraction (XRD) system on a Panalytical X'pert PRO X-
ray diffractometer using a Co Kα
radiation source (λ=1.79 Å). X-ray photoelectron spectroscopy (XPS) analyses were performed
3
using a PHI Versa Probe II spectromet
er with a monochromatized Al Kα X-ray source (1486.6
eV) focalized to a spot of 100 µm and with an electron take-off angle of θ = 45°. Survey spectra
of the photo-emitted electrons were recorded with a pass energy of 117 eV and the high-resolution
spectra with a pass energy of 23.5 eV. The deconvolution of C 1s and N 1s core-level spectra was
performed by fitting the individual components at values obtained from earlier reports by using
Casa XPS software. Spectra were fitted into Gaussian-Lorentzian (30) shaped curves with full
width at half maximum values kept under 1.5 in all cases. The morphology of the materials was
characterized using a Zeiss Ultra 55 electron microscope at an accelerating voltage of 5 kV.
Porosity characteristics were calculated from N
2sorption isotherms measured at 77 K with
Micromeritics ASAP 3020 porosimeter. Prior to the analysis samples were degassed under vacuum
at 100 °C for 24 h. The adsorption isotherms were obtained and the specific surface area and the
pore size distributions (PSD) were calculated by assuming a graphene-based structural framework
and using a 2D non-local density functional theory (NLDFT) treatment of the fluid density in the
pores, which are considered as energetically heterogeneous.
4Electrical conductivity values were
obtained from four-probe measurements using a Lucas Signatone QuadPro Resistivity system.
Samples were prepared as thin films of ~ 100 µm by pressing under 10 T of pressure.
Solid-state nuclear magnetic resonance (ssNMR) spectroscopy was performed using a Bruker
AVIII 400 MHz spectrometer equipped with 4 mm ambient-temperature and 3.2 mm
low-temperature magic angle sample spinning (MAS) probes. {
1H-}
13C and {
1H-}
15N
cross-polarization (CP)MAS experiments
5were recorded using 100 kHz nutation for
1H π/2 pulses and
SPINAL-64
6heteronuclear decoupling, a ramped (50-100%) power to match a Hartmann-Hahn
CP condition when using 50 kHz for
13C or
15N nutation during 2 ms CP spin-locking and using a
spin-echo of two rotor periods total duration (50 kHz for
13C or
15N π-pulses) before free-induction
4
decay (FID) acquisition. A minimum of 8192 and 4096 transients were recorded for the {
1H-}
13C
and {
1H-}
15N CPMAS experiments, respectively, using a recycle delay of 0.5 s between transients
and 250 Hz exponential apodization before Fourier transformation of the FID. The 2D z-filtered
TEDOR
7,815N–
13C dipolar correlation spectrum was recorded with a starting {
1H-}
13C CP step of
2 ms, 1.3 ms total TEDOR mixing (to ensure correlation peaks are only from bonded
15N–
13C
pairs), 6400 transients for each of 16 complex (States-TPPI) t
1increments of 123.35 µs, using a
recycle delay of 0.5 s between transients and 250 Hz exponential apodization in both dimensions
before double Fourier transform.
Electrochemical analysis: The synthesized materials were first tested in a three-electrode
supercapacitor configuration with porous carbon (YP50) as counter, silver wire as reference
electrodes, and a 25 μm thick cellulose sheet as a separator. Large porous carbon electrodes with
excess weight were used to counter the charges and ensure distinct responses from the working
electrodes. A custom-built Swagelok type cell was used to assemble the cell components. The
working electrodes were fabricated as a slurry by mixing active materials, polyvinylidene fluoride
(PVDF), and acetylene black carbon in a ratio of 80:10:10 using N-methyl-2-pyrrolidone and were
coated onto 0.5 cm
2stainless steel disks. The as-prepared electrodes were dried at 65
oC in air for
3 h prior to drying under vacuum at 120
oC overnight. The dried electrodes were noted to weigh 1
-1.5 mg, resulting in loading densities of 2-3 mg.cm
-2. 1M tetralkylammonium tetrafluoroborate
(TAABF
4) salt solutions in anhydrous acetonitrile with varying cations; ethyl (TEABF
4), propyl
(TPABF
4), butyl (TBABF
4) and hexyl (THABF
4) were used as electrolytes. The performances of
the SCs were evaluated using cyclic voltammetry (CV) at various scan rates. A multichannel
VMP3 potentiostat/galvanostat with EC-Lab software (Biologic) was used for all electrochemical
techniques. CV measurements were performed between - 1 to 1 V vs. Ag. at scan rates of 0.001-1
5
V.s
-1. The gravimetric capacitances (C) were derived
from CV curves using the equation C = (ʃ
I(v).dv) /(m(dv/dt).V). ʃ I(v).dv is the total area under the curve in the potential window, dv/dt is
the scan rate, m is the mass of the active material in the working electrode and V is the total
potential window. Two-electrode CVs were performed using equal weights of active materials in
both electrodes and tested in a 0-2.8 V range at scan rates of 0.001-1 V.s
-1.
Material
TGA
analyses
XPS - Elemental
Composition
XRD analyses
Gas Sorption
analyses
Wt. loss
(%)
C %
O % N % d (Å) - G d (Å) – CL SSA (m
2.g
-1)
GO
43
74.7
25.3
-
-
7.6
-
RGO
14
91.2
4.5
4.3
3.7
-
330
6 RP 1
34
88.3
5.6
6.3
3.9
7.8
138
6 RP 02
24
87.4
6.3
6.2
3.9
7.6
201
6 GH 005
26
89.3
5.7
5.0
3.9
7.9
206
6 GH 005
AD
27
89.1
5.8
5.1
3.9
7.8
148
Table S1. Thermal gravimetric weight loss values, elemental composition values from X-ray
photoelectron spectroscopy, d-spacing obtained from X-ray diffraction spectra, and specific
surface area values obtained from N
2gas sorption analyses for the synthesized materials.
6
Table S2. The imaginary part of the capacitance goes through a maximum at f
0and is identified
from the imaginary capacitance vs.
frequency plot. Time constant (τ
0) values of the synthesized
materials were extracted from the f
0values under both positive and negative polarizations vs. Ag.
Material
f
0under
+1 V vs. Ag
(Hz)
Positive
Time
Constant
(s)
f
0under
-1 V vs. Ag
(Hz)
Negative
Time
Constant
(s)
RGO
0.187
5.4
0.187
5.4
6 RP 1
0.078
12.8
0.058
17.3
6 RP 02
0.187
5.4
0.187
5.4
6 GH 005
0.140
7.1
0.140
7.1
7
Material
Electrolyte /
Voltage (V)
Scan rate or
Current
density
Specific
Capacitance
(F.g
-1)
Specific
Capacitance
(F.cm
-3)
Ref
Activated
Carbon
1 M EMIBF
4(3.5 V)
1 A.g
-1207
104
9CDC
EMITFSI
(3.0 V)
0.3 A.g
-1160
85
10MHCN
1 M EMIBF
4(2.5 V)
0.5 A.g
-1103
80
11CCNC
1 M EMIBF
4(4.0 V)
1 A.g
-1156
206
12EM-CCG
1 M EMIBF
4(3.5 V)
0.1 A.g
-1209
261
13Graphene/SW
NT film
1 M EMIBF
4(4.0 V)
0.5 A.g
-1199
211
14HGF
1 M EMIBF
4(3.5 V)
1 A.g
-1298
212
15HPGM
1 M TEABF
4(2.5 V)
0.1 A.g
-1108
171
16Porous carbon
1.5 TEABF
4(2.54 V)
0.002 V.s
-1156
145
17Compressed-aMEGO
1 M EMIMBF
4(3.5 V)
0.1 V.s
-1147
110
186 GH 0.05 AD
1 M TEABF
4(2.8 V)
0.01 V.s
-1190
210
This
work
0.1 V.s
-1159
175
1 V.s
-181
90
8
Figure S1. FTIR spectra of the precursor (GO), pillared graphene materials (RPs/GHs) and
reduced graphene oxide (RGO) indicate reduction of C=O functionalities and appearance of the
N-H and C-N bonds for RP/GH samples are observed.
4000 3000 2000 1000 6 GH 005 6 RP 02 6 RP 1 RGO GO C-N N-H Wavenumber (cm-1) T ran sm it tan ce ( a. u ) O-H / N-H C=C C=O
9
Figure S2. (a) RGO displays ordered graphene sheets whereas the sheets in (b) 6 RP appear rugose,
probably due to the functionalization by diamines.
5-10 layers
6 RP RGO
2-3 layers
10
Figure S3. The Atomic Force Microscopy (AFM) analyses of (a) GO, (b) RGO and (c) 6 RP show
clear differences in height profiles. The cross-linking of graphene sheets leads to growth of particle
sizes in the Z direction and the elevated height profile of 6 RP in AFM compared to RGO confirms
the pillaring of sheets.
GO X Range: 2.24 µm Y R an g e: 2. 24 µ m Z Range: 6.67 nm RGO X Range: 5.12 µm Y R an g e: 4. 32 µ m Z Range: 11.99 nm 6 RP X Range: 1.70 µm Y R an g e: 1. 70 µ m Z Range: 40.72 nm (a) (b) (c)
11
Figure S4. Solid-state magic angle spinning (MAS) NMR spectra recorded at 9.4 T (
1H Larmor
frequency of 400 MHz), 300 K, and using a MAS frequency of 12 kHz. (a) {
1H-}
13C CP spectra
(natural isotopic abundance) of graphene oxide (GO), unreduced pillared material (6-P-0.05), and
pillared graphene hydrogel (6-GH-0.05). (b) {
1H-}
15N CP spectra of unreduced pillared material
(6-P-0.05) and pillared graphene hydrogel (6-GH-0.05) synthesized with
15N-labelled
1,6-diaminohexane.
(b) (a) GO 6 P-0.05 6 GH-0,05 15 N-6 P-0.05 15 N-6 GH-0.0512
Figure S5. Variation of d-spacing values with equivalents in (a) 6-RP and (b) 6-GH. Fitting to
Langmuir’s chemisorption isotherm shows a good match. Saturation of d-spacing values at higher
equivalents suggests grafting instead of physical sorption on the surface.
Figure S6. (a) N
2sorption isotherms recorded at 77 K and (b) pore size distributions calculated
using 2D non-local density functional theory for the synthesized materials.
(b)(a)
(b) (a)
13
Figure S7. Scanning electron microscopy images of (a) RGO, (b) 6-RP-1, (c) 6-RP-0.2, and (d)
6-GH-0.05.
(a)
(b)
1 μm 1 μm(c)
(d)
1 μm 1 μm14
Figure S8. Normalized three-electrode cyclic voltammograms of (a) RGO, (b) RP-1, and (c)
6-RP-0.2, obtained at a scan rate of 0.02 V.s
-1in the voltage range of -1 V to 1 V vs. Ag in 1 M
solutions of TAABF
4salts in acetonitrile (AN).
(b)
(a)
15
Figure S9. Electrochemical impedance measurements and CVs performed on the synthesized
materials in a three-electrode configuration using 1 M TEABF
4/AN as electrolyte. (a) Normalized
Nyquist plots obtained at 1 V vs. Ag. A zoom of the high and mid-frequency regions in Nyquist
plots is shown in the insets. (b) Imaginary capacitance vs real impedance plots at 1 V vs. Ag.
16
Figure S10. Imaginary capacitance vs. frequency plots for the synthesized materials in 1 M
TEABF
4/AN electrolyte at 1 V (a) and -1 V (b) vs. Ag. Real capacitance vs. frequency plots at 1
V (c) and -1 V (d) vs. Ag.
-1 V
1 V
(d)
(c)
1 V
-1 V
(a)
(b)
17
Figure S11. (a) X-Ray diffraction patterns, (b) N
2gas sorption isotherms, and (c) pore size
distributions of 6-GH-0.05 and 6-GH-0.05-AD.
(b)
(a)
18
Figure S12. Scanning electron microscopy images of (a,c) freeze dried 6-GH-0.05 and (c,d) air
dried 6-GH-0.05-AD under different magnifications.
1 μm 1 μm
(a)
(b)
200 μm 200 μm
19
Figure S13. (a) Normalized Nyquist plots, (b) Ima C vs. Real Z, (c) Ima C vs. frequency and (d)
Real C vs. frequency plots obtained at -1 V vs. Ag for 6 0.05 and its dense counterpart 6
GH-0.05 AD.
τ
0values of 6 GH-1, 6 GH-0.05 and 6 GH -0.05 AD quantify the overall differences in
ion transport for the materials. R
ivalues for 6 GH-1, 6 GH-0.05 and 6 GH -0.05 AD were found
to be 57, 13 and 15 mOhm.g respectively.
10-2 10-1 100 101 102 103 104 105 0 100 200 6 GH 0.05 AD 6 GH 0.05
Re
a
l C (
F
/g
)
Frequency (Hz)
0.000 0.05 0.10 0.15 50 100 6 GH 0.05 AD 6 GH 0.05 Im a C ( F/ g) Real Z (Ohm.g) 0.0 0.2 0.4 0.0 0.2 0.4Im
a
Z
(
O
h
m
.g
)
Real Z (Ohm.g)
0.00 0.06 0.00 0.06 6 GH 0.05 AD 6 GH 0.05 10-2 10-1 100 101 102 103 104 105 0 50 100 6 GH 0.05 AD 6 GH 0.05Im
a
C
(
F/
g)
Frequency (Hz)(c)
20
Figure S14. Cycling 6-GH-0.05-AD at a high rate of 1 V.s
-1in 0 - 2.8 V using 1 M TEABF
4/AN
electrolyte for 40000 cycles.
0
10000
20000
30000
40000
6 GH 0.05 AD
Cycling @ 1 V/s
N
o
rm
al
iz
ed
C
ap
aci
tan
ce (
A
.U
)
Cycle Number
21
Figure S15. (a) Cyclic Voltammetry (CV) curves of the 6 GH 0.05 AD electrode at 5
thand 1000
thcycles in 1 M TEABF
4/AN at a scan rate of 50 mV/s in a two-electrode configuration. Minor losses
in the currents are observed over the cycling. (b) The Fourier Transform Infrared Spectra of the 6
GH 0.05 AD electrode shows the presence of similar peaks before and after cycling. An additional
peak corresponding to the BF
4anions (~1100 cm
-1) could also be seen in the cycled electrode. (c)
15N Nuclear Magnetic Resonance analysis confirms that the N atoms in the 6 GH 0.05 AD
electrode remain unaltered upon cycling.
0 1 2 -2 0 2 Voltage (V) Electrode - Before Electrode - After C ur re nt ( A. g -1 ) 4000 3000 2000 1000 Electrode Before Electrode After C-N N-H Wavenumber (cm-1) T ran sm it tan ce ( a. u ) O-H / N-H C=C B-F
(b)
22
Figure S16. The (a) C 1s, (b) N 1s and (c) O 1s high resolution X-ray photoelectron spectra of the
6 GH 0.05 AD electrode suggest similar surface chemical composition of the material before and
after cycling.
294 291 288 285 282
Electrode - Before Electrode - After
Binding Energy (eV)
In ten si ty (a. u ) 408 405 402 399 396 Electrode - Before Electrode - After
Binding Energy (eV)
In ten si ty (a. u ) 543 540 537 534 531 528 525 Electrode - Before Electrode - After
Binding Energy (eV)
In ten si ty (a. u )