in
2011
with
funding
from
Boston
Library
Consortium
Member
Libraries
0-03-Massachusetts
Institute
of
Technology
Department
of
Economics
Working
Paper
Series
Current
Account
Deficits
in
the Euro
Area.
The
End
of
the
Feldstein
Horioka
Puzzle?
Olivier
Blanchard
Francesco Giavazzi
Working
Paper
03-05
September
17,
2002
RoomE52-251
50
Memorial
Drive
Cambridge,
MA
02142
This
paper
can be downloaded
without
charge
from
the SocialScience Research Network
Paper
Collection atMASSACHUSETTSINSTITUTE OFTECHNOLOGY
End
of
the
Feldstein
Horioka
Puzzle?
Olivier
Blanchard
and
Francesco
Giavazzi*September
17,2002
In 2000-2001, the current account deficit of Portugal reached
10%
ofGDP,
up
from2-3%
atthestartofthe 1990s. Forecasts areforthesedeficitsto continue in the
8-9%
range for the indefinite future. Greece is not farbehind. Its current account deficit in 2000-2001
was
equal to6-7%
ofGDP,
up
from1-2%
in the early 1990s,and
again, the forecasts are for deficits toremain high, in the
5-6%
range.This is not the first time that
some
of the smallmember
countries ofthe
European Union
run large current account deficits. In the early 1980s,Portugal for
example
ran deficits in excess of10%
ofGDP.
But
thesedeficitshad
a very different flavor: Portugal thenwas
still reeling from its 1975revolution, from the loss ofits colonies,
and
from the second oil shock; thegovernment was
running alargebudget
deficit, inexcess of16%
ofGDP. The
"MITand
NBER,
andBocconi,NBER
andCEPR,
respectively.We
thank the Brook-ingsPanel and our discussants for their very useful comments.We
thank the staffs of the the central banks ofGreeceand Portugal, and in particular Isaac Sabethai, Pedro Portugal, and Luisa Farinha for their help.We
thank Pierpaolo Benigno, Rudi Dorn-busch, Gian Maria Milesi-Ferretti, Philip Lane, Franco Modigliani, Thomas Philippon,and Jaume Ventura fordiscussions and comments, and Battista Severgnini for excellent researchassistance.
Current Account Deficits
current account deficits werewidely perceived as unsustainable,
and
indeed they turned out to be:Between
1980and
1987, theescudowas
devalued by60%, and
thecurrentaccount deficiteliminated. In contrast, Portugaltodayisnotsufferingfrom largeadverse shocks; theofficial budgetdeficithas been reduced since the early 1990s (although with
some
signsof relapse in 2002, as current estimatesimply that Portugalmay
exceed the limitsimposed
by the Stability Pact),and
financial marketsshow no
sign of worry.The
fact that Portugaland
Greece are eachmembers
ofboth theEuro-pean
Union
and
of theEuro
area, and, in each case, the poorestmembers,
suggests a natural explanation for these current account deficits.
They
areexactly
what
theory suggestscanand
shouldhappen
when
countriesbecome
more
closely linked ingoods
and
financial markets.To
the extent that they are the countries with higher rates ofreturn, poor countries should see an increase in investment.And
to the extent that they are the countries with higher growth prospects, they should also see a decrease in saving. Thus,on
both counts, poor countries should run larger current account deficits.Symmetrically, richercountries should run larger current accountsurpluses.
The
purposeofour paper istoseewhetherthishypothesisindeed fitsthefacts.
We
conclude that it does, with saving rather than investment as themain
channel throughwhich
integration affects current account balances.We
proceed infour steps.First,
we
use a workhorseopen
economy model
toshow
how, for poorercountries, goods
and
financialmarket
integration are likelyto lead both toa decrease in savingand an
increase in investment,and
so, to alarger current account deficit.We
also discusshow
other, less direct, implications of the process ofintegration, such as domesticfinancial liberalization, are likelytoreinforce the outcome.
Second,
we
look at the panel data evidence from theOECD
since 1975.We
document
thatthe recent evolutionofPortugaland
Greeceisindeed partsteadily increased since the early 1990s.
And
currentaccount positions havebecome
increasingly related to the levelofoutput per capita of the country.Thisevolution isvisiblewithin the
OECD
asa whole, butisstrongerwithinthe
European
Union,and
stronger still within theEuro
area.The
chan-nel appearsto be primarily through a decrease in saving
—
typically private saving—
ratherthan through an increase in investment.Third,
we
return to the cases ofPortugaland
Greece.We
concludethat the recent history of thetwo
countries is largely consistent with the find-ings of the panel data regressions.Lower
private saving—
due
to both in-ternaland
external financial market liberalization but alsoto futuregrowth prospects—
and, toalesserextent, higher investment, appeartobe themain
drivers of the largercurrent account deficits.
We
end
by takingup two
issues raised by our findings. First,we
relateour resultstothelarge
body
of research triggered by the "Feldstein-Horioka puzzle"—
the finding of a highcross-country correlation between savingand
investment.
We
show
that, consistent with our findings, this correlationhas substantially declined over time, especially within the
Euro
area.At
least for this last group ofcountries, the Feldstein-Horioka fact appears to be largely gone. Second,
we
discuss whether the current attitude of benign neglect vis a vis the current account inEuro
area countries is appropriate,or whether countries such as Portugal
and
Greece should worry and take measures to reduce their deficits.We
conclude that, to a first order, they should not.1
Current
Account
Balances
and Economic
Integration
A
country that wants toborrow
from the rest of the worldmust
take intoaccount two elements: the interest rate;
and
the price cuts it will need tomake
to generate sufficient export revenues to repay the debt in the future.Current Account Deficits
a flatter cost ofborrowing, clearly
makes
itmore
attractive to borrow.In-creased goods
market
integration, i.e. amore
elasticdemand
for thecoun-try's goods, decreases future required price cuts
and
so has a similar effect.Thus, in response to increased integration, borrower countries will
want
toborrow
more.And,
by asymmetric
argument, lender countrieswillwant
tolend more.
The
distribution of current account balances will widen.1The
purpose of the
model
below is to formalize this argument.The
model
isstraightforward; but it will be useful in organizing the empirical
work and
discussing
some
ofthe policyand
welfare issues later on.21
A
classicexampleoftheeffectsofeconomicand monetaryintegrationisthat ofPuerto Rico's integration with the rest of the United States in the early postwar period.An
equally classic analysis ofwhat happened—
an analysis made feasible by the fact that statisticsonflowscontinuedtobecollectedevenafterintegration—
canbefoundinIngram[1962]. Between the early 1950s andthesecond part ofdecade, asa result ofincreased financial integration between the island and the rest of the United States, net private capitalinflowsintoPuerto Ricofrom therestoftheU.S.jumpedfrom3 to11%ofPuerto Rico's
GDP
per year. Onehalfofthese inflowscameintheformof directinvestment,one halfin theformoflong-termborrowing by localbanks; bothofthesesources of external financinghad been virtually non-existent upto the mid-50s. Investment increased from 16 to20%
ofGDP. Thecurrent account deficit between Puerto Rico and the rest ofthe United States, widened even more, reaching, by 1958, a stable level of 12 per cent ofGDP
per year, and reflecting not only an increasein investment, but also adecrease in saving. Inalateressay,Ingram [1973] usedtheexperience ofPuerto Ricotosuggest that a European monetary union would free member states from the link between national savingandinvestment. Ourpaper can beseen ascheckingIngram'shypothesis.An
earlymodelof the evolutionofthe currentaccount alongtheselineswasdeveloped by Fischer and Frenkel [1974].An
overlappinggeneration version was later analyzedby Dornbusch [1983].Think
of a group ofn
countries trading goods and assetsamong
them-selves (forconvenience,
we
shallsometimes
refertothisgroupof countries as the "world" butwhat
we
have inmind
is the set of countries in the trading group).Each
country produces itsown
good, but households in each countryconsume
thesame
composite good.Households live for
two
periodsand
maximize: log(G)+
log(Q
+1)
where:
and
their intertemporal budget constraint isgiven by:Q
+
((1 +.r)/?)"1
C
(+1=
P
tY
t+
{(l+
x)R)-1
P
t+iY
w
P
isthepriceofthegood
produced by the country, in termsofconsump-tion.
R
isthe interest ratein termsof the compositeconsumption
good, theconsumption
interest rate forshort.The
parametera
is the elasticity ofsubstitutionamong
goods, and, tosatisfy the Marshall-Lerner condition, is
assumed
to be greater than one.The
parameterx
is awedge
between the worldconsumption
interest rateand
the rate at which a country can borrow(We
are considering here a borrower country).For thetime being,
we
take production as exogenous. Thus,movements
in the current account reflect only savingdecisions.
pe-Current Account Deficits
riod is given by:
Ct
=
2
{PtYt
+
W+*)
Pt+lYt+l)Define ca as the ratioofthecurrentaccount balanceto national income.
Then,
ca isgiven by:The
three terms in the expression in brackets on the right give thede-terminants ofthecurrent account balance:
•
Output
growth.The
first term is equal toone
plus the rate ofgrowthofdomestic output.
The
higher output is next period relative to this period, the largerthe current account deficit.•
The
interest rate.The
secondterm
givesthe effectofthe interestratefaced by the country.
The
higher theconsumption
interestrate, orthe higher the wedge, themore
expensive it is to borrow, the lower the current account deficit.•
The
rate ofchange in the terms oftrade.The
thirdterm
is equal to one plusthe rate ofchange ofthe price ofthedomesticgood
in termsofconsumption.
The
larger the fall in the price ofthe domesticgood
required next period to sell domestic
goods
and
repay the debt, themore
expensive it isto borrow, the lower the current accountdeficit.The
expression aboveprovides the right startingpoint toshow
the effectof integration on thecurrentaccount balance of acountrythat, like Portugal
and
Greece, is poorer than its trading partners, but catching up.Assume
Current Account Deficits
lookingat toworldvariables.
Assume
alsothatall other countries are fully integrated, thus facing thesame
interest rateR
(with no wedge).Under
these assumptions,sum
the first-order conditions for thecon-sumer's problem (l/Cf
=
R(\/Ct+\)) over countries.Use
the fact that aggregateconsumption
is equal toaggregate income, to get:/r
1=
yr/Yr
+1=
i/(i+
<7*)
where
Y*
is the average world level ofoutput,and
g* is the world rate of output growth.Noting that the
demand
for thegood
produced in a given country isgiven by:
Pi
=
(Yt/YtT
1/a
and
correspondingly forPt+i,we
can express the current account as:m
t=-(1
-——(——
)2 1
+
x
1+
g*So, ifoutputgrowthin thecountry
we
are consideringexceedstheoutput growth ofits trading partners,and
the borrowingwedge x
is not too large,the country will run a current accountdeficit.
Using thisexpression,
we
cannow
return tothe effectsof integration on the current account balance. For countries such as Greeceand
Portugal, economic integration hashad
threemain
dimensions: the SingleEuropean
Market, which mostly affected the product market; the integration of finan-This assumptioniseasilyrelaxed
—
atsomecostinthe algebra. Relaxingitintroducesanadditional effect,thedependenceofthe slope of thesupply offundson n,thenumber
oftrading partners: Thelarger n,the smaller theeffectofborrowing bythecountryonthe equilibrium consumption interest rate,sothe flatter thesupply offunds tothe country. Thisprovides anotherdimensionofintegration,namely asanincrease in n.
Current Account Deficits
cial marketswithin the
European
Union;and
finally,monetary
union, with the adoption of theEuro
in the late 1990s. All three channels have clearly•worked in the direction of potentially widening the current account deficits
of these countries:
• Since the early 1990s, the single
European
market has led to anin-creasein <j, the elasticity of
demand
facingdomesticgoods
within theEuropean
Union:Beyond
the elimination oftariffsand
a sharperenforcementofcompe-tition rulesacross the
European
Union, factorssuch asthe harmoniza-tion ofsafety requirements for products, the extension of distribution networks, have ledtogoods
beingcloser substitutes (either in product or geographic space),and
thus to a higher elasticity ofdemand
foreach good.4
As
a result, goodsmarket
integration hasreduced theadversetermsof tradeeffectacountry faceswhen
itneedsto generatea current account surplus to repay the debt: this hasmade
borrowingmore
attractive.Going
back to the expression above for the current account,assume
that the country
we
are looking at has a higher growth rate than itstrading partners, so it is running a current account deficit. Then, the higher a, the larger the size ofthe deficit.
• Financial integration has led to a decrease in the
wedge x
within theEuropean
Union.Beyond
the elimination ofcapitalcontrolsand
otherexplicitbarrierstofinancial flows, theharmonizationoffinancialmarket ruleshasreduced
4
In ourspecification, a was formallyintroduced asa taste parameter. Think instead ofour specification of utility asa reducedform reflecting the higher substitutability of products,for whateverreason.
regulatory uncertainty faced
by
foreign lenders,and
has improved the transparency ofinformation on potential borrowers:Thanks
to the "single passport" legislation (the 1993EU
InvestmentServices Directive which addressed the cross-border activities of all
types of financial firms), an
EU
bank
that wishes todo
business inanother
member
stateno
longer needs tosetup
a full subsidiaryand
besubjectto local regulation
and
supervision: Itcando
business there opening a branch, or, evenmore
simply, operating directly from itshome
base where all the key aspects ofitssolvency, liquidity,and
risk aresupervised by itshome
regulator. In parallel, theharmonizationof firms' reportingrequirements has improved information and decreased the risk faced by foreign lenders.Also, as emphasized by Gourinchas
and
Jeanne [2002], by increasingthe cost of expropriation of foreign lenders
and
investors, financial integration has also decreased the risk of expropriationand
thus therisk
premium
they required.•
Monetary
union has led to a further decrease in .t within theEuro
area.
Monetary
union has eliminated currency risk.While
foreign exchangerisk
among
EMS
countries certainlydiminished after the currencyre-alignments of the early 1990s
—
as these realignments eliminated themost
obvious cases of overvaluation—
the cost incurred bysome
in-vestorsand
financial institutions during theERM
crises of 1992-93 remained in thememory
ofmarket participants. This lingeringuncer-tainty
was
only really eliminated in the late 1990s, as adoption of theEuro became
a near certainty.Elimination ofcurrency risk increases the relative importanceof other elements of risk: Credit risk has
become
themost
importantCurrent AccountDeficits 10
implication that the relativequality ofunderlyingcredits, rather than
judgments
about thestabilityand
volatility ofthe currency, drivesse-curities prices. All of this obviously makes,the "national" dimension
of capital flows increasingly fuzzy.
Monetary
union has also led to largerand
deeper markets for specificfinancial instruments, such as the
market
forEuro
bonds;we
shall seeexamples ofthis
when we
return to the cases ofPortugaland
Greecelater.
So
farwe
havefocused only on saving, but it is straightforward tointro-duce investment
and
build on this simple structure.The
results can easilybe
summarized
in words:• Allow production to
depend
on capital,and
take a country which ispoorer in the sense of having less capital,
and
thus a higher marginal product of capital than the others.How
much
investment will take place willdepend on
both the costofborrowing,and on
theevolutionofthe terms of trade: the lower the relative price ofdomestic goods
in the future, the less attractive it is to invest in the production of domestic goods.
Then, very
much
for thesame
reasonseconomic
integration is likely to lead to a decrease in saving, it is likely to lead to an increase ininvestment. Rather obviously, to theextent that financial integration
leads to a lower cost of finance, investment will increase.
And
to the extent that goods market integration leads toan
increase in theelasticityof
demand
for domesticgoods, investment will also increase:The
higher the elasticity ofdemand,
the smaller the decrease in priceneeded to sell the additional output in the future,
and
so themore
attractive investment this period.
and
indirectly, to a larger current account deficit than was the casein our
model
above. Directly, as the increase in investment is onlypartly offset by an increase in saving. Indirectly, to the extent that higher investment leads to higher expected growth, (an increase in
g
relative to g*), higher real income in the future,and
so lower savingthis period.
• Poorercountries are poorer not only because they havelower capital,
but alsobecause they have lowertotal factor productivity. Again, the evidenceis that both goods
and
financial market integration are likely to lead, in particular through higher competition, to an increase in total factor productivity.5To
the extent that this is the case, this is likely to improve growth prospects in poorer countries,and
lead to a further decrease in saving.• Financial integration often comes, at least in part, with domestic
fi-nancial liberalization.
New
instruments, forexample more
flexiblemortgages,
may
be introduced.To
the extent that this is the case,and that domestic financial liberalization leads to lower saving, the
effect
on
integration on the current account will be reinforced.To
summarize:Both
financialand
goods market integration are likelytolead, in the poorercountries, to both adecrease insaving
and
an increaseininvestment,
and
so to adeterioriation ofthe current balance.How
much
of the adjustment takes place through lower saving,how much
through higher investmentdepends,among
otherfactors,on
therelative roles of capitaland
TFP
inexplainingdifferences in incomeper capita across countries,and
therelative rolesof financial integration
and
financial liberalization.Seefor example the findings ofarecent McKinsey report on France, Germany, and
Current Account Deficits 12
2
The
Widening
of
Current
Account
Balances.
Panel
Data
Evidence
Having
laiddown
a simple frame,we
now
return to the data, not only forPortugal
and
Greece butfortheOECD
in general,and
theEuropean Union
and
theEuro
area in particular.To
organize the discussion,we
typically present results for four groups ofcountries:•
"OECD
minus", i.eallOECD
countriesexceptMexico,Turkey,Korea, CentralEuropean
countries(The
Czech Republic, Slovakia, Hungary,and
Poland),and
Luxembourg
—
22 countries in all.The
reasons forremoving those countries vary.
The
mechanisms
behind theevolu-tion of current account deficits in Mexico, Turkey,
and
Korea, threemuch
poorer countries, are likely to be different from those in thericher
OECD
countries.Data
for CentralEuropean
countriesonly ex-ist from 1990 on, so the countries cannot be usedwhen
constructing a balanced panel (we shall briefly report the results from unbalanced panel regressions below).And
theeconomy
ofLuxembourg
is highlyidiosyncratic; in particular,
Luxembourg
reportsconsistentcurrentac-count surpluses ofthe order of
30%
ofGDP.
•
"European
Union
-', or
EU
for short, the group ofEuropean Union
countries, again excluding
Luxembourg
—
so 14 countries in all.The
rationale for looking at this subgroup of
OECD
countries is obvious.Ifintegrationisthe basic force behind the wideningofcurrent account balances, one
would
expect theeffectof the SingleMarket
tobemuch
stronger for
EU
countries than forOECD
countries in general. • "Euro area", orEuro
for short, the countriesnow
in theEuro
area,minus
Luxembourg,
so 11 countries in all. (Greece, which joined inisequally obvious.
With
the fixingof parities in 1999,and
theshift tothe
Euro
atthe end of the 1990s,onewould
again expect thedegreeof integrationto be stronger forEuro
countriesthan forEU
or a fortioriOECD
countries in general.• "Euro minus", the set ofcountries in the
Euro
area,minus
Portugal and Greece, 9 countries inall.The
reason forlookingat thissubgroupis simply to see
whether
the resultsfor theEuro
area aredue to these two countries or hold even in the rest oftheEuro
area.To
start. Figure 1 reports the standard deviations of the cross-countrydistribution ofthe ratio of current account balances to
GDP
foreach year.For current account balances
—
and, later, savingand
investment—
we
use data from theEuropean
Commission
database, calledAMECO
(which stands for"Annual
Macroeconomic
Database ofDG
Ecfin").These
arebased on national
income
accounts and, post 1995, on theESA95
EU
ac-counting system.
The
numbers
are not always equal to those published by theOECD,
which appear sometimes basedon
other sources (forexample
the
OECD
current account data for Greece are basedon
Bank
of Greece data, which are constructed usingbank
settlementdata rather than tradedata).
The
differences can benon
negligible: In 2000, the current accountdeficitofGreece
was
4.5%
accordingtotheEU,
7%
accordingtotheOECD.
But
the differences are mostly level differences,and
the conclusions below are roughly unaffected by which serieswe
use.6A
largerissueiswhether weshouldlookat thecurrentaccount balanceorthechange inthe net foreignassetpositionofthecountry—
which,inprinciple, includes revaluations ofassetsandliabilities. Becauseof themeasurementissuesassociatedwithavailableseries forchangesinnetforeign assets,weprefertouse theseriesforthecurrentaccountbalance. For thesetofcountrieswelook at, the general evolutionswedescribebelowarerobust toEuro [» en Union
19"J0 19^0 19^0 20uO
Figure1a. StandardDeviations.OECD.EUandEURO, 1975-2000
EuroareaminusinandPn
19*70 19
-80
Figure la reports results for each of the first three groups described above.
The
timeseries have threecharacteristics:•
The
results are similar across the three groups; indeed, there is noevidence of stronger widening of balances for either the
Euro
area or theEU
than for theOECD
as a whole.•
There
is a sharp but temporary increase in the standard deviation inthe early 1980s.
•
There
is a steady increase in the standard deviation since the late1980s, leading to a
more
than doublingofthestandard deviation over the last 15 years.A
further look at thedata suggests a sharpdifference between the shortlived increase of the early 1980s
and
the steady increase later on.The
in-creaseoftheearly 1980s isentirelydueto largedeficits injusttwo
countries.The
first is Portugal.We
briefly discussed the episode in the introduction, a period of very large unsustainable deficits,due
to the aftermath of therevolution, the loss ofcolonies, the second oil shock,
and
aloss ofcontrol offiscal policy.
The
second is Ireland, where the combination of the oil shockand
a fiscal expansion (with fiscal deficits exceeding12%
ofGDP)
also ledto very large and unsustainable current account deficits.
The
point thatnearly all ofthe action in the early 1980s
comes
from thesetwo
countries isshown
in Figure lb, which plots the standard deviation forEuro
countries,with
and
without Portugaland
Ireland.When
thetwo
countries are left out, the peak of the early 1980s is fully gone,and
the standard deviationrises
more
or less steadily from the early 1980s on, with a sharper increasein the 1990s.
whether oneuses currentaccount balances orchangesin net foreignasset positions. For
Current Account Deficits 15
The
next step is to try to explainwhich
countries have been runninglargerdeficits,
and
which countries havebeen
running larger surpluses.Ba-sic growth theory,
and
theopen
economy
model
presented in the previoussection, suggest exploring the relation between thelevel ofoutput per capita
and
the current account balance. Countries that are poorer havemore
po-tential for catch-up, either through capital accumulation, or technological progress (for empirical evidence
on
convergence within theOECD,
see forexample
Barroand
Sala-i-Martin [1992]).Economic
integrationmakes
iteasier for these countries to borrow,
and
thus to run larger current accountdeficits.
We
take a first pass at the data in Figure 2.The
figure is a set ofscatterplots ofthe time average of the ratio ofthe current account deficit
to
GDP
against the time average ofoutput per capita, fortwo
subperiods, 1985-1994and
1995-2001,fordifferentgroup
ofcountries.Output
per capitaisconstructed as
PPP
GDP
per capita in 1985 dollars, using the data from Hestonand
Summers
up
to 1992,and
extrapolated using realGDP
growthrates thereafter.
The
choiceof1985 as a startingdate isto avoidtheepisode of the early 1980swe
saw
earlier.The
firsttwo
panels give scatterplotsand
the regression line for
OECD
minus, the secondtwo
forEU, and
the thirdCunvnt
Account Deficits 16OECD
minus
1985-1994CA/GDP
=
-1.8+
0.09Y/N
(t=
1.5)R
2=
0.01 1994-2001CA/GDP
=
-6.8+
0.49Y/N
(t=
5.2)R
2=
0.13EU
1985-1994CA/GDP
=
-1.9+
0.12Y/N
(t=
2.0)R
2=
0.03 1994-2001CA/GDP
=
-11.8+
0.94Y/N
(t=
10.2)R
2=
0.48EURO
1985-1994CA/GDP
=
-2.8+
0.23Y/N
{t=
3.4)R
2=
0.10-13.5
+
1.10Y/N
(i=
11.0) J?2=
0.58 1994-2001CA/GDP
=
The
figureand
associated regressions havetwo
striking features:•
There
isa substantial strengthening of therelation betweenthecurrentaccount
and
output per capitafrom the first tothe second subsample.Except
for theEuro
area, the coefficient is typically insignificant for1985-1994; it
becomes
much
largerand
very significant in 1995-2001.•
The
increase isstrongerfortheEU
than fortheOECD
asawhole,and
stronger for the
Euro
areathan
for theEU
(although the differencebetween
EU
and
theEuro
areais neither statistically oreconomicallysignificant).
Both
features are verymuch
consistent with the idea that integrationis an important factor behind current account evolutions. Integration
was
higher to start with within the
EU
or theEuro
area,and
has continued at a higher pace.To
look at the relation further,we
run the followingspecification:
(CA/Y)
it
=
at+
bt(^2#) +
X
u
p
+
eltThe
specification is largely standard (for recent surveysand
extensions of the literature ofthe determinants of current accounts, see forexample
Debelle
and
Faruqee [1996] orChinn and
Prasad [2000]. ):The
ratio ofthe current account balance to output in year t for country i
depends
on acommon
time effect, on the level ofincome
per capitain year t for countryi relative to the average level of
income
per capita in year t for the group of countrieswe
are looking at,and
on other control variables included inthe vector
Xu-
The
onlynon
standard aspect ofthe specification,and
the one central to our exploration here, is thatwe
allow the effect of the levelof
income
percapita, to vary from year to year.In our basic specification,
we
usetwo
controls (in addition to the timeeffects).
The
first is thedependency
ratio, constructed as the ratio of pop-ulation to the labor force: Other things equal,we
expect a country with arelatively higher
dependency
ratio to save less.The
second is the rate of growth of output from year t—
1 to t, to capture cyclical effects ofmove-ments
in outputon
the current account.The
theorywe
saw
earliersuggeststhat integration
may
also affect the elasticity of the current account with respect to cyclicalmovements;
for this reason,we
also allow the effect of output growth to vary from year to year.(The
results are nearly identical ifwe
use themeasure
ofthe output gap constructed by theOECD,
amea-sure which aims at capturingcyclical
movements
in output).The
period of estimation runs from 1975 to 2001.The
starting yearisconstrained by the availability of comparable data on saving, whichwe
usewhen
we
analyzethe
components
ofthecurrent account separately below.The
simplestway
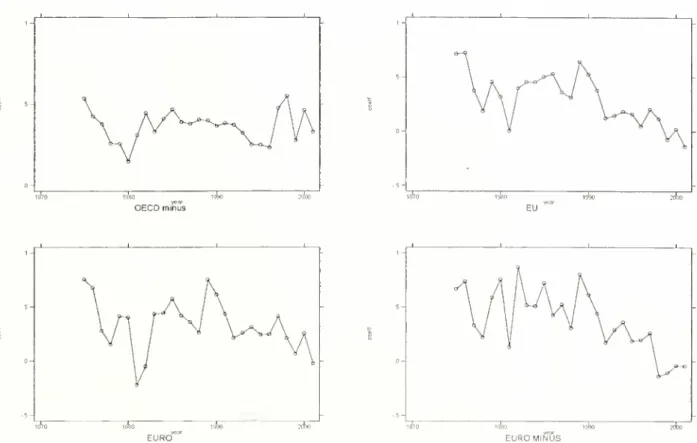
topresentourresultsisby plottingthesetofestimatedEURcf EUROMlfjUS
• Figure 3a
shows
the results forOECD
minus.The
coefficient is nearly always positive, but there isno
obvious trend. In other words, the widening of current account balances does not appear to reflect an increaseddependence
of the current account on the level ofincome.• Figure
3b
does thesame
for theEU.
There, the evolution of thees-timated coefficients resembles the evolution of the standard deviation
earlier.
The
high deficits of the early 1980s in both Portugaland
Ire-land,two
relatively poor countries leads to a temporary increase inthe coefficient.
And
one also sees the steady increase in the coeffi-cient from thelate 1980son.By
themid-1990s, thecoefficient is both statisticallyand
economically significant. For example, the estimatedcoefficient of0.2 in 2000 implies, that, other things equal, for a
coun-trywith an
income
per capita40%
below the averageEU
level (whichis roughly the case for Portugal
and
Greece), the ratio ofthe current accountbalance toGDP
should be 8 percentage points lowerthan theEU
average. (In 2000-2001, the current account for theEU
was
ex-actlybalanced.The
deficit for Portugal was, aswe
have seen, roughly10%
ofGDP).
• Figure 3c does the
same
forEURO.
The
coefficients look verymuch
the
same
asfortheEU;
thisis not a greatsurprise, given that the largeoverlap between the
two
groups of countries. Figure 3d finallyshows
theresults forthe
EURO
minus,tocheck the influenceofPortugaland
Greece.
The
increaseisactually largerin the 1990swhen
Portugaland
Greeceare leftout, with the coefficient reaching 0.35 in 2001.
In short, Figure 3 suggests that, for the
EU,
the widening of current account positions can be largely accounted for by an increaseddependence
on
output per capita.The
effectseems
weaker, if present at all, for theCurrent Account Deficits 19
How
robust are theseresults?We
haveexplored anumber
ofalternative specifications:•
Income
per capitamay
be apoor
proxy forwhat
we
are trying tocapture.
While
convergence ofincome per capita appears to hold forthe set of countries
we
are looking at,some
of the poorer countriesmay
have a bleak future.Some
rich countriesmay
be appealing toforeign investors, for reasons having to
do
both with expected returnand
with risk characteristics; think forexample
ofthe United States,and
its long string ofcurrent account deficits. (Thistheme
has been explored, boththeoreticaland
empirically,by
Ventura [2002]and
Lane
and
Milesi-Ferretti [2001b].)Thissuggests replacingoutput per capitain ourregressionsbythe ini-tial net asset position ofthe country,
and
again interact its coefficientwith time.7 Presumably, if a country has been borrowing steadily in
the past, so itsasset position is negative, it has characteristics which are attractive to foreign investors. Further financial
and
economicin-tegration are then likely to allow for
more
foreign inflows,and
thuslarger current account deficits.
Figure 4
shows
the setofestimatedcoefficientsfrom aregression usingforeign assets per capitain 1990 (rather thanincome percapita).
The
variable for net foreign assetscomes
fromLane and
Milesi-Ferretti [2001a]and
ismeasured
in millionsof dollars. (Regressionsusingeither foreign assets per capitain 1980, or foreign assets per capita for eachyear, give very similar results.) Becausethe level offoreign assets can be positive or negative,
we
cannot use thesame
normalization as forincome per capita;
we
use instead the difference between the level ofFor more on therelation between foreign asset positionsand incomeper capita, see
Current Account Deficits
20
foreign assets for country i in year t
and
the average level across the relevant group of countries in year t.The
main
conclusionswe
draw
from the four panels are two:
The
coefficients aretypically positive: Countries which haveborrowed
in the past tend to run current account deficits. This conclusion has
beenwell
documented
byothers.But
there isnoevidence of a strongerrelation
between
the financial asset positionand
the current account balance. FortheOECD
minus,thecoefficientsaretypically significant,but
show no
trend.And
fortheEU
and
theEURO,
thetrendisclearlythe other way, with a steady decrease in the coefficient over time. •
The
currentaccountreflectsnotonly thebehaviorofprivatesavingand
investment, but also of public saving. Unless Ricardian equivalence
holds, public savingislikelytoaffecttotal saving,
and
thus the current account.And
one ofthemain
evolutions of the 1990s has been, as aresult of Maastricht, a strong
improvement
in the fiscal position ofmost
European Union
countries.With
this motivation,we
haveexplored a specificationadding another control variable to the basic specification, the ratio of structuralpri-mary
balances (as constructed by theOECD)
toGDP
for each yearand
each country.The
results are easy to summarize. For all four groupsofcountries, thecoefficienton
the fiscal variableis tightlyesti-mated,
and
very significant. For theOECD
as a whole,an
increase inthe structuralprimary balanceof
1%
ofGDP
leadstoanimprovement
inthe current account of0.2%.
The
estimates are nearly identical forthe
EU
and
theEURO.
But
the time series ofestimated coefficientson output per capita is nearly identical tothat inFigure 3 (and so,
we
do
not reportthem
here). Inother words, the increasedwidening does not appear tocome
from diverging evolutions of public saving across• Accession countries, that is the countries from Central
and
EasternEurope
which are candidates to join theEU,
should provide anex-cellent test ofour hypothesis:
They
are poorer that the currentEU
members,
expect togrow
fast after joining theEU
and, inprepara-tion to entry, have undergone
some
internal liberalizationand
have started to removesome
barriers to economic integration.The
prob-lem with thesecountries isthe availability ofdata, which do not start until the early 1990s.When
we
includethem
in the regressionsre-ported above, re-run over
much
shorter samples, the results tend to confirm those presented above. This ishardly surprisingly, sincemost
accession countrieshave ran largecurrent accountdeficits inthe 1990s
(the average ratio of thecurrent account balance to
GDP
for the pe-riod 1993-2001was -3.6%
for the Czech Republic,-4.9%
for Hungary,-3.6%
for Poland,and
-9%
for the Slovak Republic).We
finally turn to whether the increased dependence ofcurrent account balances on output per capita reflectsan increaseddependence
ofsaving, or an increaseddependence
of investment.To
do
so,we
simply run the basic specification, replacing the ratio ofthe current account to
GDP
first by the ratio ofsaving toGDP,
and
then by the ratio ofinvestment toGDP.
The
four panelsofFigure5show
the resultsof the saving regression.We
draw
two conclusions:• For the
OECD
as a whole, there is notmuch
evidence of a significant effectofoutput per capitaon saving,and
noevidence of a trend.Sav-ingappearsunrelated tothe levelofincomepercapita.
The
coefficienttends to be negative (lower outputper capita leading to lower saving)
for
most
of the 1980s, close tozeroformost
ofthe 1990s, and the valuefor 2001 is roughly equal to the value for 1975.
EURCr*
ofa trend. After a sharp decline in the 1970s, the coefficient steadily increasesover time, bothinthe 1980s
and
the 1990s. Interestingly, thecoefficientchangessign:
At
thestartofthesample, savingisnegativelyrelatedto income per capita
—
asign opposite tothat predicted by the standardopen
economy
growth model. It turns positive in the late 1980s, turning larger in theEuro
area than in theEU.
Integration per se does not easily explain the change in sign, and this suggests the presence of otherfactors atwork, such asfinancial developmentorfinancial liberalization: Poorercountries haveintroduced
new
financialinstruments
and
institutions, which have led to a decrease in saving.This,
combined
with integration, has led to larger current accountdeficits.
The
four panels of Figure 6show
the results of thesame
exercise, thistime for investment.
They
suggest two conclusions.•
The
coefficient is typically negative:A
lower income per capita isassociated with higher investment, the sign predicted by thestandard model.
•
There
is however no evidenceofa trend, of amore
negative effect ofincome per capitaon investmentover time (There is a steady decrease in the coefficient starting in the mid-1990s, but this is too small
and
too recent to qualify as a trend). In short, the increased
dependence
ofcurrent account balances
on
income per capitareflects, for themost
part, an effect through saving than an effect through investment.
The
importance of the effect through saving suggests the relevance of trying to separate theeffectsof integrationand
internal financial liberaliza-tion.With
this in mind,we
have explored the effects of introducing as an additional control the ratio ofM3
toGDP,
a ratio which is often taken as a proxy for the stock ofdebt instruments available to firms and households.EUROMliJuS
and
thus asaproxy for financialdeepening(seeforexampleKing and
Levine[1993] for a use ofthis ratio as a
measure
offinancial development instan-dard growth regressions).
The
resultsshow
that current account balancesare strongly negatively related to the ratio of
M
3 toGDP,
suggesting thatinternal financial liberalization does play an independent role in determin-ing the cross-countrydistribution ofcurrent account balances.
The
effect isboth statistically and economically significant:
An
increase in the ratio ofM3
toGDP
of30 percentage points(aswas, forexample, the casein Greecein the 1990s) is estimated to lead to a decrease in the ratio of the current account to
GDP
ofabout 1.2 percentage points.But
introducingthisaddi-tional control doesnot significantlyaffect the coefficients
on
relativeincome
percapita.
Paneldata regressionsonly gosofar,
and
one often hasa better sense of the underlyingmechanisms
by lookingat individual countries. This iswhat
we
do
in the next section, wherewe
return to the experience of Portugaland
Greece.3
Back
to
Portugal
and
Greece
3. 1 Portugal
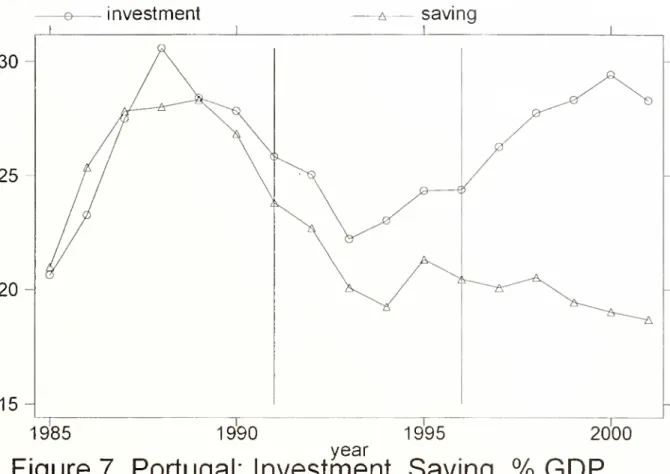
Figure 7
shows
the evolutionofPortuguese investmentand
saving, as ratiosto
GDP,
from 1985 to 2001. It clearlyshows
the steadily increasingdiver-gence between investment
and
saving,and
the resulting steadily increasing currentaccount deficit, starting in the 1980s.In trying to assess
how much
ofthechangein the current accountdeficit isdue
to a change in saving or to a change in investment, onemust
becareful in the choice of a base period.
The
early 1990swas
a period of low growth for cyclical reasons,and
so is not the right base period. Thus, inpresenting
numbers
in Table 1,we
divide time in three subperiods: 1985-1991 (1985 is the first year post-stabilization, following the largefiscaland
Current Account Deficits 2^
currentaccountdeficits
we
discussedearlier, 1991 isthelastyearofsustained growth), a periodwith an average growth rateof 5.1%; 1992-1995, a period oflow growthand
sounusually low investmentand
saving, a period with an average growth rate of 1.5%;and
1996-2001, a period of sustained growth, with an average growth rate of3.5%. Finally, toshow
recent evolutions,we
alsopresent
numbers
for2000and
2001, yearswith growthratesof3.3% and
1.9%
respectively. In reporting changes in the last column,we
report thedifference between the
numbers
for 2000-2001and
thenumbers
for1985-1991, theperiod
we
take as the base period.Table
1.Current
Account
Balance,
Investment,
and
Saving,
asratios
to
GDP,
percent.Portugal 1985-2001
1985-1991 1992-1995 1996-2001 2000-2001
A
Current account 0.6 -2.0 -7.0 -10.0 -10.6 Investment 25.3 22.8 26.6 28.1 -2.8 Saving 25.9 20.8 19.5 18.1 -7.8 ofwhich Public saving 4.6 2.3 2.6 2.4 -2.2 Private saving 21.3 18.5 16.9 15.7 -5.6 of which Household saving 9.2 8.3 5.7 5.4 -3.8 Corporate saving 12.1 10.2 11.2 10.3 -1.8A:
Difference between2001-2000
and
1985-1991. Source:European
Commission, Statistical
Annex
ofEuropean Economy,
Spring 2002.The
breakdown
of privatesavingcomes from
theDireccao General deEstudos
ePrevisao.
1985
1990
1995
year
Figure
7.
Portugal:
Investment,
Saving.
%
GDP
Current Account Deficits 25
saving, are adjusted for inflation.
More
specifically, basedon
information about the composition of debt by currency denomination,we
add
to theofficial
number
for public saving anamount
equal to inflation times the proportion of the public debtdenominated
in domestic currency times the debt.(The
adjustment matters verymuch,
as inflation hasdecreased froman
average14%
over 1985-199 to7%
over 1992-1996,and
to3.5%
since; the averageratioofpublicdebtdenominated
indomestic currencyhas remainedstable
around
50%).We
subtract a similaramount
from private saving,and
so leaveunchanged
the officialnumber
for the current account. Thisamounts
to the assumption that the public debt is held domestically; in theabsence ofseries on domestic
and
foreign holdings of public debt, there isno
obviously better feasible adjustment.8How
toallocatetheinflation adjustmentofprivatesavingbetween
house-hold versus corporate savingismuch
more
difficult.9 Itdepends
forexample
on whether
government
bonds
are heldby
householdsor financialintermedi-aries,
and
in the secondcase,on
the type ofliabilities issued by theseinter-mediaries. Further adjustments should also be
done
for nominal corporatebonds
and
other nominal liabilities, and, on the other side, for mortgagesand
otherhousehold nominal liabilities.We
couldnot obtain sufficientdata todo
these adjustments. Thus,we
use a simple rule:We
subtract thefull inflation adjustment on
government
debt from household saving: ThisEstimates from the Bank ofPortugal for the 1990s indicate that the proportion of
government debt held by non-residentholders remained low until the mid 1990s (when
the inflation adjustment matters most): 10% in 1990, 17% in 1996. Since then, the proportionhasincreasedsteadily, reaching
47%
in 2001.For a recent explorationofthe minefields associatedwith the construction of
econom-icallymeaningfulseries forhouseholdsavingintheUnitedStates,seeGaleandSabelhaus [1999].
implicitly assumes that public debt is held (directly, or indirectly through intermediaries with nominal liabilities) by households rather than
corpora-tions. Again, in the absence of relevant data, there is little choice than to
make
that assumption. Finally,we make
no
further adjustment to adjustfor other nominal liabilities.
Figure 7
and
thenumbers
in Table 1 suggest four conclusions:•
The
increase in the current account dates back to the late 1980s, but has accelerated in the second half of the 1990s. Using 1985-1991 as the base period, the current account deficit has increased by10.6%
ofGDP.
•
The
increase in the current account deficit isdue
for less than one third to an increase in investment.The
ratio of investment toGDP
has increased by 2.8 percentage points relative to 1985-1991.The
increaseis
much
larger ifwe
compare
the ratioto itsvaluein theearly1990s (an increase of 5.3%), but
much
of that increase is cyclical, reflecting the period of low growth ofthe early 1990s.•
The
increase in the current account deficit is due formore
than twothirds to a decrease in saving.
The
ratio of saving toGDP
hasde-creased by about
7.8%
ofGDP
relative to its 1985-1991 value. •The
decrease in saving reflects primarily a decrease in private saving.Public saving has decreased
by
2.2% ofGDP,
relative to 1985-1991;private saving has decreased by 5.6%. (Inflation accounting is
impor-tant here. Absent the inflation correction, public saving
would
show
a riseof
3.1%
and
the shift in private saving would lookmuch
larger,-10.1%)
the government debt held domestically was held either by households or by financial institutionswithnominal liabilitiesontheliability side.
Current Account Deficits
27
•
The
decrease in private saving reflects primarily a decrease in house-hold saving.The
ratioofhousehold saving hasdecreased by 3.8%, theratio ofcorporate savingby 1.8% (absent inflation correction, house-hold saving
would
show
a decrease of 8.3%.)We
now
look atsome
aspects ofthe story behindthese numbers.Take
the decrease inhousehold
saving
first.From
1995 to theend
of 2001, household debt has increased
from
40%
to93%
ofGDP.
Most
ofthis increase has taken the form ofeither mortgages or
consumer
loansfrom banks.At
theend
of 2001, mortgages represented39%
of totalbank
loans tothe non-financial private sector,and
76%
oftotal loans to households.Why
has there been such an increase in household debt?We
could notfindsubstantivechangesinthe types ofmortgages or loansofferedby banks.
The
decrease in interest ratesmust
be a central part ofthe story: Short-term nominal interest rates have decreased verymuch,
from16%
in 1992,to
around
4%
in 2001 (for theEuro
area as a whole, thenumbers
are11%
and
4%). Shortterm
real interest rates (measured as nominal interest ratesminus
realized inflation, using theGDP
deflator) have decreased from6%
in 1992 to roughly zero in 2001 (this is
more
than for theEuro
area as a whole,where
the rate has decreased7%
toaround 3%;
due in part to the Balassa-Samuelson effect, inflation is higher in Portugal than the averagefor the
Euro
area).Why
the low interest rates? Apart from the declinedue
tofactorscom-mon
to theOECD,
much
of it is clearly traceable to financial integration,and
the reduction ofcountry riskdue tomembership
in theEMU
first,thenadoption ofthe Euro.
The
single currency has reduced country risk by low-eringthe probability that Portugal might face a liquiditycrisisand
thusbe
forced to stop servicing its external debt. Looking at the balance sheets of banks shows that Portuguese banks have financed this increased credit
econ-omy, participation in the
Euro
has offered domesticbanks
easier accessto interbank loans from banks in other Euro-area countries.The
main
instru-ment
for raisingfunds abroad has been the issuance of international bonds through subsidiaries of Portuguese banks having their head office abroad: the yearly flow ofnew
internationalbond
issues through these subsidiariesincreased from one half of 1 million euro in 1998 to 5 billion in 2000.
The
maturity of these
bonds
(whose legal status is generally that of "subordi-nated debt") is between 3and
5 years,and
the currency ofdenomination isthe euro.
Looking
at the capital accountmakes
clear that foreign borrowing bydomestic banks has indeed played a central role in the
way
Portugal has financed its current accountdeficit.Looking
at stocks, the net foreign debt position ofPortuguese banks has increased from 9 billioneuro in 1999 to 24billion in 2001.
Looking
at flows, in 2000, the increase in grossindebtedness ofresident Portuguesebankswas
equal to17.4%
ofGDP,
the increasein net indebtednesswas
equal to 10.7%—
so larger than the currentaccountdeficit in thatyear (we are not singlingout banks arbitrarily here: all other grossportfolio
and
investmentflows are small in comparison.)Turn
now
toinvestment
Given the growth in
mortgage
loans, one would have expected thein-crease in investment to reflect disproportionately an increase in housing investment. Curiously, this is not the case. For
most
of the 1990s, hous-ing prices have increased at a rate only slightly higher than inflation.And
residentialinvestment hasremained a nearly constant fraction oftotal fixedinvestment, 21-23%.
We
haveno
explanation for that fact.Another
apparently puzzlingdevelopment,in viewof thetheorysketchedin Section 1, isthe poor performanceofforeign direct investment.
Net
FDI, whichhad
been an important source ofcapital inflows following Portugal's entryintotheEU
in 1985,turned negativein 1995and
hasremainednegativeCurrent Account Deficits
29
since then. Here, lookingat grossflows helps solve the puzzle:
• Negative net
FDI
since 1995 istheoutcome
ofarapid increase inbothinflows
and
outflows, butmore
soin outflows than inflows:• In the late 1980s, following
EU
accession,FDI
into Portugalhad
in-creased rapidly, reaching
4%
ofGDP
in 1990.But
then, the inflowsslowed down,
coming
to a near standstill in 1995. Since 1995, theinflows have increased again. In 2000, they stood at twice their 1990
level (in dollars), the previous peak.
• Outflows, however,
which had
been roughly unaffectedby
EU
acces-sion, have increasedeven faster, reaching, in 2000,5%
ofGDP.
Most
ofPortuguesedirect investmentabroad takes the form ofacquisitions,
and
much
of it,40%
ofall outflows, goes to Brazil—
direct investmentin other
EU
countries is only15%
ofall outflows.Our
interpretation ofthis fact is that it is,somewhat
paradoxically,the result of financial integration within the
Euro
area,and
of therole information plays in direct investmentflows.
Our
guess, basedon the largevolume
of issuesofEuro bonds by
Portuguese firms, is thatEuropean
direct investment in a country such as Brazil is carried outmainly through Portugal, which presumably has a comparative ad-vantage in understanding business in that country. This comparative advantage isnot new.
What
is new, following the Euro, is the abilityof Portuguese firms to raise funds in a Euro-wide capital market to finance their foreign acquisitions.
We
see theimage
thatcomes
out ofour descriptionofPortugueseevolu-tions as consistent with that
from
panel data regressions. It isone in whichintegration, especially financial integration (and integration rather than do-mestic financial liberalization) hasled to lowersaving,
and
toa lesserextent to higher investment, both leading to largercurrent account deficits.There
is however an alternative view ofthe current account deficit inPortugal, one based on loss ofcompetitiveness
and
overvaluation. It points to the decline in exports,due
to their unfavorable specialization: In 1995, onefourth oftotalexportswereaccountedforbyclothingand
footwear,some
of the products
most
exposed to competition from developing countries. Itsuggests that the rate at which Portugal joined the Euro, together with nominal rigidities, led to
an
overvalued exchange rate,and
in turn acurrent account deficit.Separating out the role of overvaluation
and
themechanisms
we
have focused on in this paper is far from obvious, both conceptuallyand
empir-ically.
But
we
see the overall evidence in favor of overvaluation as weak.First, lookingat it from the trade balanceside,
most
ofthe current accountdeficit is the reflection ofan unusually high growth rateofimports, rather than an unusually low growth rate of exports. Second, one would expect overvaluation,
and
so a lowdemand
for domestic goods, to be associated with unusually lowGDP
growth; this has not been the case. Third, the index of Portuguese unit labor costs, relative to 22 industrial countries (ascomputed
by theEU, European Economy,
Spring 2002, 1991=100),was
109.4 in 1995, 103.8 in 1998,
and
is 108 in 2002.(The
U.S. index from thesame
source, auseful comparison, increased in those yearsfrom 100 to 130).This suggests that overvaluation is at
most
a minor factor in explaining Portuguese current account deficits.3.2 Greece
Figure 8
shows
the evolution ofGreek
investmentand
saving, as ratios toGDP,
from 1981 to 2001. It shows that the divergence between investmentand
saving ismore
recent than in Portugal, dating back only to themid
1990s.
-©—
investment
30
25
20
15
1980
1985
1990
year
1995
2000
choice of a base period. Just as Portugal, Greece
went
through a recession in the mid-1990s, and using that period as the basewould
be misleading. Thus, in presenting numbers,we
divide time in three periods: 1981-1991 (1991 is the last year of sustained growth), with an average growth rate of 2.5%; 1992-1995, a period of slow growth, with an average growth rate of 0.8%,and
1996-2001, a period of sustained growth, with an average growthrate of3.5%.
To
show
recent evolutions,we
also presentnumbers
for 2000and
2001.When
reportingchanges,we
compare
thenumbers
for 2000-2001for those for 1981-1991.
Greeceisone ofthe countriesfor whichthe
numbers
reported by theEU
and
bytheOECD
differthe most.There
arebasicallytwo
time series forthe Greek current account balance.One
is the series reported by theBank
ofGreece,
and
usedby theOECD,
and
isbasedon informationon
internationaltransactionscollectedby commercialbanks.
The
other, usedin the national accountsand
by theEU,
isderivedfrom customsinformation.Both
sourceshave
become
less reliableover time: thefirstbecausethe removal ofcurrencyrestrictions has reduced the information available tocommercial banks; the
latter because of the gradual elimination of
custom
controls on intra-EUtrade.
We
report thetwo
sets ofnumbers
in the firsttwo
lines of Table2, but, for consistency with the
numbers
for the other variables, base therest ofour analysis (and Figure 8) on the
EU
numbers.While
the levels of the deficit according tothetwo sources arevery different, thechangein thedeficit isessentially the same: a widercurrent account deficitofaround
3%
ofGDP
(3.5% accordingto theEU, 2.5%
according to theOECD.)
The
numbers
in the table are adjusted for inflation in thesame way
asfor Portugal.11 Again, the adjustment mattersa lot:
The
inflation rate has"Estimates fromtheBankofGreece indicatethat, untilthemid-1990s, theproportion ofgovernment debt heldbynon-resident holderswaslow. It hasrecently increased, from
Current Account Deficits 32
decreased
from
18%
for 1981-1991, to12.5%
for 1992-1995,and
5%
since1996 (it stands around
3%
today); Gross public debt increased from50%
in1985 to
100%
ofGDP
in 1992,and
it has remained above100%
since.Table
2.Current
Account
Balance,
Investment,
and
Saving,
asratios
to
GDP,
percent.Greece 1981-2001
1981-91 1992-95 1996-2001 2000-01
A
Current account (EU-Nat
Def) -0.9 -0.2 -3.3 -4.4 -3.5 Current account(OECD-
BoG)
-4.0 -1.4 -4.6 -6.5 -2.5 Investment 22.9 19.7 21.3 23.0 0.1 Saving 22.0 19.5 18.2 18.6 -3.4 ofwhich Public saving 1.4 2.2 3.8 5.3 4.3 Private saving 21.0 17.3 14.4 13.3 -7.7 ofwhich 1995 1997 2000 Household saving 6.8 7.6 6.7 Corporate saving 10.7 7.0 6.4A
: Difference between2001-2000
and
1981-1991. Sources.European
Commission, Statistical
Annex
of"European
Economy"
, spring 2002.The
breakdown
of private saving between householdand
corporate saving wasgiven to us by the
Bank
of Greece.Figure 8
and
thenumbers
in Table 2 suggest four conclusions:•
The
increase in the current accountdeficitdoes notreflect an increasein investment.
The
ratio ofinvestmentin 2000-2001 isthesame
as inand later the
Euro
area, wasaccompanied
by an investmentboom
isonly the result of an inappropriate comparison with the recession of the early 1990s
and
the sharp fall in capital formation thathappened
then.
•
By
implication, all the increase in the current account deficit can be traced to a decrease in saving.The
current account deficit hasin-creased by 3.5%. Saving has decreased by
3.4%
•
The
decrease in saving ismore
than fully accounted for by an evenlarger decrease in private saving. Private saving has decreased by 7.7%, while public savinghas increased by 4.3%. This isverydifferent
from Portugal. There, as
we
saw
in Table 1, both privateand
public-saving have decreased. In Greece the swing in (inflation adjusted)
private saving has been twice as large as in Portugal but has been
partly offset by the increase in (inflation adjusted) public saving. •
The
decomposition between corporateand
household saving can onlybe
made
from 1995 on.Based
on this information, it appears thatmuch
of the decrease in private savingcomes
from a decrease inre-tained earnings, rather than a decrease in household saving, (again, the inflation correction is important here, as the inflation decreased from 9%, in 1995 to about
3%
in 2000,and
thedebt-to-GDP
ratioremained around 100%.
Absent
the inflation correction, the ratio of household saving toGDP
shows
a decline ofabout6%
from 1995 to2000).
We
now
look atsome
aspects ofthe story behind these numbers. There has indeed been a clear shift of firms from internal finance toshare issues.
The
flow ofcapital raised in thestock market went from zeroin 1995-1996 to