HAL Id: hal-00871289
https://hal.archives-ouvertes.fr/hal-00871289
Submitted on 9 Oct 2014
HAL is a multi-disciplinary open access
archive for the deposit and dissemination of
sci-entific research documents, whether they are
pub-lished or not. The documents may come from
teaching and research institutions in France or
abroad, or from public or private research centers.
L’archive ouverte pluridisciplinaire HAL, est
destinée au dépôt et à la diffusion de documents
scientifiques de niveau recherche, publiés ou non,
émanant des établissements d’enseignement et de
recherche français ou étrangers, des laboratoires
publics ou privés.
modeling approach comparing four species.
Jon E Brommer, Jussi S Alho, Clotilde Biard, Joanne R Chapman, Anne
Charmantier, Amelie Dreiss, Ian R Hartley, Mårten B Hjernquist, Bart
Kempenaers, Jan Komdeur, et al.
To cite this version:
Jon E Brommer, Jussi S Alho, Clotilde Biard, Joanne R Chapman, Anne Charmantier, et al..
Passer-ine extrapair mating dynamics: a bayesian modeling approach comparing four species.. American
Naturalist, University of Chicago Press, 2010, 176 (2), pp.178-87. �10.1086/653660�. �hal-00871289�
vol. 176, no. 2 the american naturalist august 2010
Passerine Extrapair Mating Dynamics: A Bayesian Modeling
Approach Comparing Four Species
Jon E. Brommer,
1,*Jussi S. Alho,
1Clotilde Biard,
2Joanne R. Chapman,
3Anne Charmantier,
4Amelie Dreiss,
2,†Ian R. Hartley,
5Ma˚rten B. Hjernquist,
6Bart Kempenaers,
7Jan Komdeur,
8Toni Laaksonen,
9,‡Paula K. Lehtonen,
10Thomas Lubjuhn,
11Samantha C. Patrick,
3,§Bala´zs Rosivall,
12Joost M. Tinbergen,
8Marco van der Velde,
8Kees van Oers,
13Tomasz Wilk,
14and Wolfgang Winkel
151. Department of Biosciences, University of Helsinki, P.O. Box 65 (Viikinkaari 1), FIN-00014 Helsinki, Finland; 2. Laboratoire de Parasitologie E´volutive, Centre National de la Recherche Scientifique (CNRS), Unite´ Mixte de Recherche (UMR) 7103, Universite´ Pierre et Marie Curie (Paris 6), Baˆtiment A, case 237, 7, quai St. Bernard, 75252 Paris Cedex 05, France; 3. Edward Grey Institute,
Department of Zoology, University of Oxford, Oxford OX1 3PS, United Kingdom; 4. Centre d’E´cologie Fonctionnelle et E´volutive (CEFE)–CNRS, UMR 5175, 1919 Route de Mende, 34293 Montpellier Cedex 5, France; 5. Lancaster Environment Centre, Lancaster University, Lancaster LA1 4YQ, United Kingdom; 6. Division of Animal Ecology, Department of Ecology and Evolution, Evolutionary Biology Centre, Uppsala University, Norbyva¨gen 18D, SE-75236 Uppsala, Sweden; 7. Department of Behavioural Ecology and Evolutionary Genetics, Max Planck Institute for Ornithology, Eberhard-Gwinner-Straße, 82305 Seewiesen, Germany; 8. Animal Ecology Group, Centre for Ecological and Evolutionary Studies, University of Groningen, P.O. Box 14, 9750 AA Haren, The Netherlands; 9. Section of Ecology, Department of Biology, University of Turku, FIN-20014 Turku, Finland; 10. Section of Genetics, Department of Biology, University of Turku, FIN-20014 Turku, Finland; 11. Institute for Evolutionary Biology and Ecology, University of Bonn, An der Immenburg 1, D-53121 Bonn, Germany; 12. Behavioural Ecology Group, Department of Systematic Zoology and Ecology, Eo¨tvo¨s Lora´nd University, Pa´zma´ny Pe´ter se´ta´ny 1/c, H-1117 Budapest, Hungary; 13. Department of Animal Ecology, Netherlands Institute of Ecology (NIOO-KNAW), P.O. Box 40, NL-6666 ZG Heteren, The Netherlands; 14. Institute of Environmental Sciences, Jagiellonian University, Gronostajowa 7, 30-387 Krakow, Poland; 15. Institute of Avian Research, Vogelwarte Helgoland, An der Vogelwarte 21, 26386 Wilhelmshaven, Germany
Submitted October 28, 2009; Accepted March 11, 2010; Electronically published June 8, 2010 Online enhancements: appendixes. Dryad data: http://hdl.handle.net/10255/dryad.1416. abstract: In many socially monogamous animals, females engage
in extrapair copulation (EPC), causing some broods to contain both within-pair and extrapair young (EPY). The proportion of all young that are EPY varies across populations and species. Because an EPC that does not result in EPY leaves no forensic trace, this variation in the proportion of EPY reflects both variation in the tendency to engage in EPC and variation in the extrapair fertilization (EPF) process across populations and species. We analyzed data on the distribution of EPY in broods of four passerines (blue tit, great tit, collared flycatcher, and pied flycatcher), with 18,564 genotyped nestlings from 2,346 broods in two to nine populations per species. Our Bayesian modeling ap-proach estimated the underlying probability function of EPC (assumed to be a Poisson function) and conditional binomial EPF probability.
* Corresponding author; e-mail: [email protected].
† Present address: Department of Ecology and Evolution, Biophore, University
of Lausanne, CH-1015 Lausanne, Switzerland.
‡ Present address: Finnish Museum of Natural History, University of Helsinki,
P.O. Box 17, FI-00014 Helsinki, Finland.
§ Present address: Marine Biology and Ecology Research Centre, University
of Plymouth, Plymouth PL4 8AA, United Kingdom.
Am. Nat. 2010. Vol. 176, pp. 178–187.䉷 2010 by The University of Chicago. 0003-0147/2010/17602-51692$15.00. All rights reserved.
DOI: 10.1086/653660
We used an information theoretical approach to show that the expected distribution of EPC per female varies across populations but that EPF probabilities vary on the above-species level (tits vs. flycatchers). Hence, for these four passerines, our model suggests that the probability of an EPC mainly is determined by ecological (population-specific) con-ditions, whereas EPF probabilities reflect processes that are fixed above the species level.
Keywords: mating systems, bird, promiscuity, extrapair paternity, sex-ual selection, mate choice.
.
Introduction
One striking paradigm shift in the study of avian mating dynamics has been the realization that monogamy in bird species is not the rule (Lack 1968) but the exception (e.g., Griffith et al. 2002). Many broods consist not only of off-spring sired by the social father (the male providing care) but also of extrapair young (EPY) sired by a male who has engaged in one or more extrapair copulations (EPCs) with the focal female but provides no care for her offspring. Variation in the frequency of EPY is dramatic, varying from species without any EPY to species where, on average, almost
80% of offspring are EPY (Griffith et al. 2002). The current consensus explanation of this variation recognizes a hier-archy of processes affecting the probability of producing EPY (Westneat and Sherman 1997; Arnold and Owens 2002; Bennett and Owens 2002; Griffith et al. 2002; Westneat and Stewart 2003). Differences across species are probably due to differences in the division of parental care and in the cost scenario (for both parents) that unfolds when an EPY is produced (Mulder et al. 1994; Birkhead and Møller 1996; Gowaty 1996; Møller 2000; Møller and Cuervo 2000). An EPY entails costs to the social father when he provides care for an unrelated offspring, and he may therefore reduce his care or stop caring for the brood altogether, which will have repercussions for the female. Life history (especially lon-gevity) probably plays an important role in mediating such costs, because the social male is more likely to desert a brood in case of uncertainty in paternity in long-lived species than in short-lived species (e.g., Mauck et al. 1999). Indeed, lon-gevity is a strong correlate of the proportion of EPY and carries a clear phylogenetic signal (Wink and Dyrcz 1999). In contrast, variation in the proportion of EPY within a species (across and within populations) is thought to stem mainly from two non–mutually exclusive factors. First, pop-ulations and individuals within poppop-ulations may differ in ecological factors (for example, population density) that could affect an individual female or male’s propensity to produce EPY (Westneat and Sherman 1997; Møller and Ninni 1998). Second, there may be variation between pop-ulations in the (genetic) benefits to be gained through pro-ducing EPY (e.g., Petrie and Kempenaers 1998; Petrie et al. 1998; Griffith 2000).
In studying the variation in the proportion of EPY across populations and species, two challenges are apparent. First, a substantial number (at least 200) of offspring must be genotyped per population for strong inferences regarding differences in the proportion of EPY across populations to be possible (Griffith et al. 2002). Second, most studies have made the strong, and largely unsubstantiated, assumption that the measured proportion of all young that are EPY in a population is related to the causal underlying process, the tendency to engage in EPCs. However, an EPC that did not (for whatever reason) result in the production of an EPY remains invisible to the investigator. Hence, it is useful to distinguish between the probability that an EPC has oc-curred and—given that an EPC has ococ-curred—the proba-bility that this EPC has indeed resulted in fertilization of at least one egg (termed here “extrapair fertilization” [EPF]; Brommer et al. 2007). There is a possible discrepancy when researchers quantify the proportion of EPY to test hypoth-eses that, ultimately, concern the distribution of EPCs (Dunn and Lifjeld 1994; Brommer et al. 2007; Griffith 2007). The extent of this discrepancy is currently unknown, but experimental studies suggest that the occurrence of EPCs
in nature may be far greater than the observed frequency of EPY implies (Hunter et al. 1992; Michl et al. 2002; Fossøy et al. 2006).
Brommer et al. (2007) introduced a statistical modeling approach that recognizes that both the distribution of EPCs and the success rate of EPF (conditional on an EPC) may differ across species or populations. A high occurrence of EPCs with a low probability of success and a low oc-currence of EPCs with a high probability of success could produce the same observed average frequency of EPY. Nev-ertheless, details on the distribution of EPY over broods can be used to separately estimate the EPC and EPF prob-abilities, assuming (1) that EPCs follow a specific proba-bility distribution (assumed to be Poisson), and (2) that more EPCs result in a higher within-brood EPF probability (Brommer et al. 2007). Under these assumptions, model estimates of EPC and EPF probabilities can be generated. In general, a strong dichotomy in the distribution of EPY (a high proportion of broods without EPY but many EPY in broods with them) is indicative of a low EPC probability with a high EPF probability. Conversely, a low proportion of broods without EPY, in combination with a relatively low occurrence of EPY in the remaining broods, is indic-ative of a high EPC probability with a low EPF probability (see Brommer et al. 2007 for details).
In this article, we employ the model of Brommer et al. (2007) to gain insight into the EPC and EPF processes that underlie the variation in EPY across four common European passerine species. We analyze a large, combined data set of the distribution of EPY in the blue tit Cyanistes caeruleus, the great tit Parus major, the collared flycatcher Ficedula albicollis, and the pied flycatcher Ficedula hypo-leuca. For each species, we consider data on two to nine populations, and we include, in total, more than 18,000 genotyped nestlings. Our Bayesian model estimates the underlying probability distributions of EPCs and EPFs. We explore whether EPC and EPF probabilities vary mainly on the species or on the population level (or both). At present, we have no insight into these different compo-nents of extrapair mating dynamics or into what degree variation in the EPC and EPF processes contributes to the observed variation in the proportion of EPY across pop-ulations and species. We discuss our findings in relation to the hierarchical view (sensu Griffith et al. 2002) of species- versus population-level processes and indicate fu-ture challenges for generalization of our findings.
Material and Methods
The Model
The modeling approach taken here is a Bayesian version of a model described by Brommer et al. (2007), where the
180 The American Naturalist
distribution of EPCs and EPFs are estimated from the observed distribution of EPY. Here, we briefly recapitulate the model’s structure.
We assume a Poisson distribution with m as the mean number of EPCs per female in the population, such that the probability of having E EPCs (E p 0, 1, 2, etc.) is
E m
Pr (E) p . (1)
E! exp (m)
Conditional on having an EPC, the probability of obtain-ing e EPYs in a brood of size b is binomially distributed as b! b⫺e e Pr (eFb) p # (1⫺ f ) # f , (2) e!(b⫺ e)! with E # s f p , (3) E # s⫹ (1 ⫺ s)
where s is the within-brood probability of fertilization of an egg by an extrapair sperm after one EPC. Equation (3) assumes that both the extrapair male and the within-pair male produce a fixed amount of sperm (although not nec-essarily the same amount) and spermatozoa that are equally viable and vigorous. As a consequence, the within-pair sperm is increasingly “diluted” with extrawithin-pair sperm as more EPCs occur, such that f (the within-brood prob-ability of a fertilization of an egg with an extrapair sperm over all EPCs that a female has engaged in) increases as-ymptotically to 1 with the number of times the female has an EPC (eq. [2]). Hence, we here—for simplicity—assume that all sperm form a common pool available to the female for fertilizing all her eggs, where the probability that a particular sperm is used to fertilize one of her eggs is equal for each sperm (“fair raffle”). Sperm is assumed to be available in much larger quantities than eggs, such that fertilization of one egg with one sperm does not alter the probability function of drawing an EPC sperm (making eq. [2] a binomial process rather than a hypergeometrical one). Our “dilution” function assumes that the social male does not markedly alter his copulation behavior after one or more EPCs have occurred. We thus ignore certain as-pects of sperm competition, including last-male prece-dence (see, e.g., Birkhead 1998). We nevertheless regard equations (1)–(3) as a statistically adequate and parsi-monious description of mating dynamics, because (1) these allow us to formulate a null model with the mini-mum number of parameters; (2) Brommer et al. (2007) showed that the two-parameter model outlined above (where only m and s are estimated) adequately fits the
observed EPY distribution in five out of seven species; and (3) the processes involved in translating EPCs into the production of EPY are not well understood (Birkhead 1998), and a clear biological motivation for a specific link function that is also generally applicable is therefore lacking.
By genotyping the offspring and the social parents of a brood, the number of within-pair young (WPY) and EPY are inferred (see below for specifics). Here, we consider the sum of WPY and EPY as the brood size b and thereby ignore any offspring that died before sampling or could not be genotyped for technical reasons. We thus assume that the distribution of WPY and EPY in the offspring of unknown genetic parentage does not differ from the known distribution of WPY and EPY with known genetic parentage (e.g., no differential mortality of WPY vs. EPY). The present understanding of differential mortality of WPY and EPY during early development is poor. This assumption is partly supported by analyses comparing hatchability and the proportion of WPY and EPY across avian species (Morrow et al. 2002), but detailed analyses (e.g., Magrath et al. 2009) have revealed that EPY may hatch earlier within a brood than WPY, which is likely to have repercussions for early mortality.
On the basis of the above probability functions, we con-structed a Bayesian model, implemented in OpenBUGS (http://www.openbugs.info/w/; Thomas et al. 2006). The source code is provided in appendix A in the online edition of the American Naturalist.1
Detecting Extrapair Young in Different Populations and Species
The species and populations studied and the coordinates of the study sites are presented in table 1. Note that the blue tit populations Muro and Pirio on the island of Cor-sica (France) and two separate woodland plots in Foreˆt d’Orient (France) were considered distinct populations de-spite close geographic proximity, because these localities differed in habitat composition and general level of EPY (Charmantier et al. 2004). For details of the study sites, methodology of sample collection, and methods of pater-nity exclusion of previously published material, we refer to the original publications (table 1). In addition to pub-lished studies, we used partly or completely unpubpub-lished material for four populations. Details on methods are pro-vided in appendix B in the online edition of the American Naturalist.
1 Code that appears in the American Naturalist has not been peer-reviewed,
Table 1: Description of the data analyzed
Population Speciesa Locality Country Coordinates References
1 BT Calixbergen Belgium 51⬚15⬘N, 4⬚28⬘E Kempenaers et al. 1997
2 BT Foreˆt d’Orient I France 48⬚17⬘N, 4⬚18⬘E C. Biard, unpublished data
3 BT Foreˆt d’Orient II France 48⬚17⬘N, 4⬚17⬘E Dreiss et al. 2006
4 BT Muro France (Corsica) 42⬚33⬘N, 8⬚55⬘E Charmantier et al. 2004
5 BT Pirio France (Corsica) 42⬚22⬘N, 8⬚45⬘E Charmantier et al. 2004
6 BT Rouvie`re France 43⬚40⬘N, 3⬚40⬘E Charmantier and Perret 2004
7 BT Kolbeterberg Austria 48⬚13⬘N, 16⬚20⬘E Foerster et al. 2006
8 BT Lancashire United Kingdom 54⬚00⬘N, 2⬚47⬘W Leech et al. 2001
9 BT Vosbergen Netherlands 53⬚08⬘N, 6⬚35⬘E Brommer et al. 2007
10 GT Bahrdorf Germany 52⬚22⬘N, 11⬚01⬘E Lubjuhn et al. 2007
11 GT Westerheide Netherlands 52⬚00⬘N, 5⬚50⬘E van Oers et al. 2008
12 GT Wytham Woods United Kingdom 51⬚46⬘N, 1⬚19⬘W J. R. Chapman and S. C. Patrick, unpublished data
13 GT Lauwersmeer Netherlands 53⬚23⬘N, 6⬚14⬘E J. Komdeur, J. M. Tinbergen, and M.
van der Velde, unpublished data
14 CF Pilis Mountains Hungary 47⬚43⬘N, 19⬚01⬘E Rosivall et al. 2009
15 CF Niepolomice Poland 50⬚06⬘N, 20⬚25⬘E Wilk et al. 2008
16 CF Gotland Sweden 57⬚30⬘N, 18⬚30⬘E Sheldon and Ellegren 1999; M. B.
Hjernquist, unpublished data
17 PF Lingen/Emsland Germany 52⬚27⬘N, 7⬚15⬘E Lubjuhn et al. 2000
18 PF Ruissalo Finland 60⬚25⬘N, 22⬚09⬘E Lehtonen et al. 2009
Note: Locality is the local name of the site of sampling. When available, the publication in which the methods of collecting and analyzing the source data are presented is given; otherwise, the author names are given with the specification “unpublished data.” Details of unpublished data are provided in appendix B in the online edition of the American Naturalist.
a BT p blue tit; GT p great tit; CF p collared flycatcher; PF p pied flycatcher.
Data Structure
We considered 18,564 genotyped offspring in 2,346 broods (one randomly selected brood per female). Sample sizes varied substantially across species: tits were represented by more populations and with higher sample sizes per pop-ulation than flycatchers (table 2). Many poppop-ulations were sampled in multiple years. We did not attempt to address annual variation in our parameters, because different stud-ies were conducted in different years and in different geo-graphical locations. Further, because of our simulation results (app. C in the online edition of the American Nat-uralist), we wanted to maximize sample size and thus grouped all the years. Estimates of model parameters there-fore present an overall average for each population across the years studied.
Statistical Procedures
Uninformative priors were assumed for the parameters m (gamma distribution [0.001, 0.001]), and s (uniform dis-tribution [0, 1]). We ran three independent chains, with 30,000 iterations each, discarding the first 10,000 from each as burn-in. Proper mixing of the chains and con-vergence were assessed visually and by the Gelman-Rubin convergence statistic provided by OpenBUGS. We calcu-lated the means of the posteriors of parameters m and s
and their 95% highest posterior density interval (hereafter “credible interval”).
The capacity of the model to estimate the parameters of interest was evaluated by fitting the Bayesian model to simulated data. The model provided precise estimates, al-though a fairly large sample size (1100 broods) was
re-quired. The simulation and fitting procedures are outlined and discussed in appendix C.
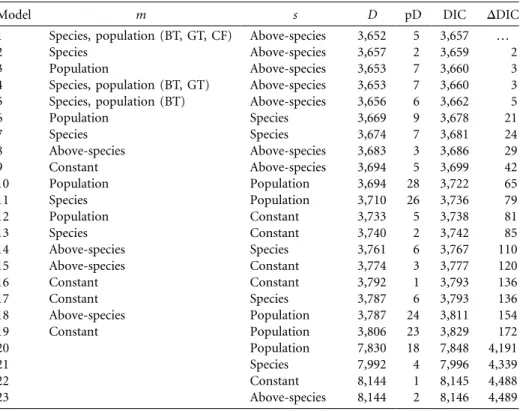
We explored whether the observed data could be par-simoniously modeled by a constrained set of parameters. We distinguished, for both parameters, the levels “popu-lation,” “species,” and “above species” (tits vs. flycatchers). We conducted a model selection analysis to find out whether most variation in, say, EPF probability (parameter s) was across populations or whether there were differences between species or between tits and flycatchers (above-species level). In order to compare across these models, we calculated the Deviance Information Criterion (DIC), a measure similar to other information criteria (e.g., Akaike Information Criterion, Bayesian Information Cri-terion) but especially suitable for Bayesian hierarchical models (Gelman et al. 2003). OpenBUGS does not au-tomatically provide the DIC for models involving discrete stochastic parent nodes (Poisson distribution in this case), so we calculated it ourselves. A model’s DIC is the sum of the deviance D of the model and the effective number
182 The American Naturalist
Table 2: Sample sizes and characteristics of the different data sets included in this study
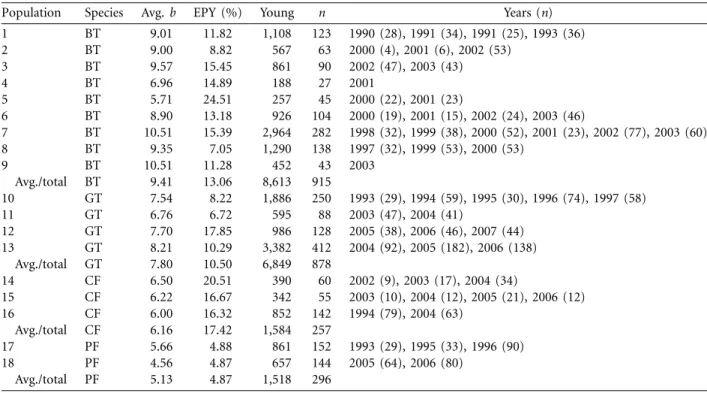
Population Species Avg. b EPY (%) Young n Years (n)
1 BT 9.01 11.82 1,108 123 1990 (28), 1991 (34), 1991 (25), 1993 (36) 2 BT 9.00 8.82 567 63 2000 (4), 2001 (6), 2002 (53) 3 BT 9.57 15.45 861 90 2002 (47), 2003 (43) 4 BT 6.96 14.89 188 27 2001 5 BT 5.71 24.51 257 45 2000 (22), 2001 (23) 6 BT 8.90 13.18 926 104 2000 (19), 2001 (15), 2002 (24), 2003 (46) 7 BT 10.51 15.39 2,964 282 1998 (32), 1999 (38), 2000 (52), 2001 (23), 2002 (77), 2003 (60) 8 BT 9.35 7.05 1,290 138 1997 (32), 1999 (53), 2000 (53) 9 BT 10.51 11.28 452 43 2003 Avg./total BT 9.41 13.06 8,613 915 10 GT 7.54 8.22 1,886 250 1993 (29), 1994 (59), 1995 (30), 1996 (74), 1997 (58) 11 GT 6.76 6.72 595 88 2003 (47), 2004 (41) 12 GT 7.70 17.85 986 128 2005 (38), 2006 (46), 2007 (44) 13 GT 8.21 10.29 3,382 412 2004 (92), 2005 (182), 2006 (138) Avg./total GT 7.80 10.50 6,849 878 14 CF 6.50 20.51 390 60 2002 (9), 2003 (17), 2004 (34) 15 CF 6.22 16.67 342 55 2003 (10), 2004 (12), 2005 (21), 2006 (12) 16 CF 6.00 16.32 852 142 1994 (79), 2004 (63) Avg./total CF 6.16 17.42 1,584 257 17 PF 5.66 4.88 861 152 1993 (29), 1995 (33), 1996 (90) 18 PF 4.56 4.87 657 144 2005 (64), 2006 (80) Avg./total PF 5.13 4.87 1,518 296
Note: Population numbers and species abbreviations as in table 1. “Avg. b” refers to the average brood size considered in the model (sum of within-and extrapair young). The percentage of all nestlings that were extrapair young (EPY) is presented, together with the total number of young genotyped and the number of broods n. In addition, for each year and each population the number of broods sampled is provided. Averages (b and % EPY) and totals (young and n) for species are presented for each species.
of parameters pD, where the latter is the difference be-tween the deviance of a model with parameters fixed at their posterior means and the deviance D of the uncon-strained model (Gelman et al. 2003). A lower DIC indicates a better model fit. As a rule of thumb, a difference of at least 10 in DIC between a candidate model and the model with the lowest DIC indicates a clear deterioration in model fit, whereas candidate models that differ in DIC by less than 2 from the model with the lowest DIC deserve consideration (Spiegelhalter et al. 2002).
In addition to the analysis of the combined data set, we estimated population-specific parameters and goodness of fit (reported in app. D in the online edition of the American Naturalist).
Results
Model Selection
Our model estimated parameters that describe the varia-tion in the observed distribuvaria-tion of extrapair young (EPY) in terms of probabilities that capture extrapair copulation (EPC) and extrapair fertilization (EPF) processes. We con-trasted these processes on different levels, including the above-species level (tits vs. flycatchers) in addition to spe-cies (four spespe-cies) and population levels (table 3), using
the DIC. The main difference in EPF probability was on the above-species level (contrasting the two tit species and the two flycatcher species). Evidence for this dichotomy was strong, since the top five models (models 1–5 in table 3, with a DIC less than 10 points higher than that of the best model; see DDIC in table 3) all had variation in EPF probability (s) constrained to the above-species level. Fur-ther, a model’s DIC rapidly increased when EPF proba-bility (s) was assumed to vary on the species or lower level. In contrast to EPF probability, the variation in EPC probability (m) was found to be on both the species and the population level. Constraining the variation in EPC probability to the above-species level (tits vs. flycatchers) did not produce a satisfactory model fit (model 8, with a DIC score 29 points higher than model 1’s). Estimates of m and s under the most parsimonious model are presented in figure 1 and highlight the across-population variance in EPC probability. In general, m tended to be well below two expected EPCs per brood. The most notable high es-timates were obtained for the blue tit population in Pirio (population 5), and the great tit population in Whytham (population 12). These two populations also had relatively high occurrences of EPY in broods (table 2).
We assumed a particular link between the number of EPCs and the within-brood EPFs. In order to explore the
Table 3: Model selection of the distribution of extrapair young as a function of the distribution
of extrapair copulations (m) and extrapair fertilization (s)
Model m s D pD DIC DDIC
1 Species, population (BT, GT, CF) Above-species 3,652 5 3,657 …
2 Species Above-species 3,657 2 3,659 2
3 Population Above-species 3,653 7 3,660 3
4 Species, population (BT, GT) Above-species 3,653 7 3,660 3
5 Species, population (BT) Above-species 3,656 6 3,662 5
6 Population Species 3,669 9 3,678 21 7 Species Species 3,674 7 3,681 24 8 Above-species Above-species 3,683 3 3,686 29 9 Constant Above-species 3,694 5 3,699 42 10 Population Population 3,694 28 3,722 65 11 Species Population 3,710 26 3,736 79 12 Population Constant 3,733 5 3,738 81 13 Species Constant 3,740 2 3,742 85 14 Above-species Species 3,761 6 3,767 110 15 Above-species Constant 3,774 3 3,777 120 16 Constant Constant 3,792 1 3,793 136 17 Constant Species 3,787 6 3,793 136 18 Above-species Population 3,787 24 3,811 154 19 Constant Population 3,806 23 3,829 172 20 Population 7,830 18 7,848 4,191 21 Species 7,992 4 7,996 4,339 22 Constant 8,144 1 8,145 4,488 23 Above-species 8,144 2 8,146 4,489
Note: Parameters m and s were allowed to vary on the level of the tits versus flycatchers (above-species level), the species level, and the population level or were assumed to be constant. The model’s Deviance Information Criterion (DIC) was calculated as the sum of the model’s deviance D and the effective number of parameters (pD). A lower DIC score indicates a better model fit. Results are ranked according to DIC, with model 1 indicating the most parsimonious model; DDIC indicates the difference in DIC from that of model 1. We also included variation across population-specific estimates of m in a limited number of species (models 1, 4, and 5), indicated by the acronym in parentheses (BT p blue tit; GT p great tit; CF p collared flycatcher). Models 20–23 do not include parameter m and effectively model the probability of extrapair young as a single binomial process with probability s (see Brommer et al. 2007).DDIC≥ 10indicates a serious deterioration in model fit (Spiegelhalter et al. 2002).
robustness of our conclusions, we also relaxed the as-sumption of such a link and assumed that the probability of producing an EPY is binomially distributed on the level of the brood (a commonly used null model; see Brommer et al. 2007). Hence, we varied only the within-brood bi-nomial EPF probability (models 20–23 in table 3). This clearly produced a much poorer fit (DDIC≥ 4,191 com-pared with the most parsimonious model) than allowing for variation in both m and s. This result is consistent with previous findings of Brommer et al. (2007).
Discussion
We have analyzed a large data set of the distribution of extrapair young (EPY) in four passerine species, including several populations per species. We have applied a single statistical Bayesian modeling approach to the entire data set, with the explicit aim of comparing extrapair mating dynamics across populations and species while taking into
account uncertainty in the estimates. Our model finds support for the notion that species and populations differ in their extrapair mating dynamics in terms of their dis-tribution of extrapair copulations (EPCs) but that the probability of extrapair fertilization (EPF) after an EPC varies on the above-species level (tits vs. flycatchers). Our model estimates a relatively high average number of EPCs (but with a low probability of EPF) for blue and great tits. Model estimates for the collared flycatcher indicate a mod-erately high number of EPCs with a high probability of EPF per EPC, but those for the pied flycatcher show a low expected number of EPCs with a high EPF probability per EPC (fig. 1B, 1C). Our model, therefore, clearly demon-strates that a given frequency of EPY can result from rather different EPC/EPF pathways. Populations and species may differ in the relative importance of these two pathways even if they have similar frequencies of EPY.
Our model infers how unobserved (and difficult-to-observe) processes such as EPC and EPF probabilities
184 The American Naturalist
Figure 1:Model-estimated parameters describing the mating dynamics, based on the most parsimonious model (model 1 in table 3). A, Estimated number of extrapair copulations (EPCs) per brood (m) and its 95% credible interval for each population (see table 1); acronyms indicate species (BT p blue tit; GT p great tit; CF pcollared flycatcher; PF p pied flycatcher). B, Parameter m and its 95% credible interval averaged over populations for each species. C, Extrapair fertilization probability of producing an extrapair offspring after one EPC (parameter s) and its 95% credible interval for the two tit species and the two flycatcher species.
might combine to generate an observed frequency distri-bution of EPY over broods. We believe these two processes to be the main processes underlying the production of EPY, but other models have also been put forward (re-viewed in Brommer et al. 2007). Our inferences (like all inferences) depend on certain assumptions. One assump-tion is that the more EPCs a female has, the higher the within-brood probability of EPF. We have implemented this by assuming that all matings are equal, with an egg being fertilized out of a common pool of within-pair and extrapair sperm (eqq. [2], [3]). The advantage of this ap-proach for linking EPC and EPF is that it makes no specific assumptions, requiring only one parameter (s). The dis-advantage is that it ignores aspects of extrapair mating dynamics that are known to occur. For example, through careful timing of an EPC relative to the time window of egg fertilization, a female can increase the probability that one EPC will produce an EPY (Double and Cockburn
2000). In addition, the social male may increase his mating intensity after an EPC, in which case the within-brood EPF probability may increase less strongly after each EPC (although mate guarding may be a relatively ineffective deterrent of EPY; e.g., Kempenaers et al. 1995). Our link function (eq. [2]) assumes that after one EPC, within-brood EPF equals s, after which the within-within-brood EPF probability increases with marginal returns as a function of the number of EPCs. Females store sperm to fertilize their eggs, potentially creating a latency between an EPC and an EPF that is captured better by a sigmoidal function or a threshold model where several EPCs are required to overcome the numerical dominance of the stored sperm of the social male. Thus, our assumed link function (eq. [2]) may lead to an underestimation of the number of EPCs. A worthwhile future extension of our model, there-fore, is to assume a more general link function whose parameters are to be estimated and to compare the model fit to models based on our assumed link function. As is true for all modeling exercises, a reasonable model fit can-not be taken as evidence that the assumptions are valid (in this case, that the estimated EPC and EPF probabilities fully characterize the production of EPY). This is because other processes that we did not consider here may produce an equivalent outcome. Hence, our model estimates should be interpreted with caution, and researchers ap-plying our model to their data should be aware that es-timates are valid only to the extent that the model’s as-sumptions are reasonable for their study system. A future empirical challenge is to critically test the assumptions by measuring how the number of EPCs maps onto the within-brood EPFs, and we indicate below some possibilities for doing so within the context of our approach.
Explaining Variation in EPY
Typically, one assumes that most of the variation in the frequency of extrapair young (EPY) across species and populations is due to variation in the tendency to engage in EPC. That is, EPC is assumed to occur commonly when-ever the frequency of EPY is high. Howwhen-ever, this assump-tion need not hold if there are clear differences between species or populations in an extrapair male’s probability of successfully fertilizing a female’s egg. A high percentage of EPY in a population or species may be due to a higher probability of EPF after an EPC rather than to more EPCs per se. Griffith (2007) argued that in order to understand EPC behavior, we need to know how consistent the var-iation in EPC behavior is across populations and species and to what degree such variation is reflected in the fre-quency of EPY (see also Dunn and Lifjeld 1994). Our modeling approach suggests that the mating dynamics dif-fers mainly between tits and flycatchers (i.e., the
above-species level) in terms of EPF probability after an EPC has occurred. In contrast, the frequency of EPCs varies sig-nificantly across species and across populations within spe-cies. What does this finding imply for our understanding of variation in the frequency of EPY?
A number of factors have been proposed to explain variation in the frequency of EPY, each of which is thought to apply to a specific hierarchical level, ranging from pop-ulation to species and higher phylogenetic levels (Westneat and Sherman 1997; Griffith et al. 2002). Because we found that EPF (rather than EPC) probabilities are specific to the two tit species versus the two flycatcher species (i.e., the above-species level), any comparison of the observed fre-quency of EPY across these clades is strongly determined by differences in EPF processes. This is illustrated in our data set by the observation that the species with the highest proportion of EPY (the collared flycatcher) does not have the highest average number of EPCs but rather achieves its high EPY frequency through a high probability of EPF. Hence, comparisons of the frequencies of EPY across spe-cies may have only limited value for understanding EPC processes.
Our findings imply that details of the fertilization pro-cess are important to explain phylogenetic differences in EPY rates. Fertilization success may depend on both be-havior (e.g., timing of copulations) and physiology, through postcopulatory processes such as sperm compe-tition and cryptic female choice (e.g., sperm swimming speed, sperm viability, and sperm-egg interactions), whereas EPCs are mediated by behavior. Comparative analyses show that physiological traits are, in general, rel-atively fixed across the phylogeny, whereas behaviors tend to lack a strong phylogenetic pattern (Blomberg et al. 2003). On the other hand, behaviors, such as the timing of copulation, are also likely to be involved in determining fertilization success. At present, there is little understand-ing of the relative importance of pre- and postcopulatory processes involved in sperm competition (Birkhead 1998). The similarity in EPF probabilities in the two flycatcher species and in the two tit species need not stem from phylogeny but may have evolved independently within the tit and flycatcher species considered here. Indeed, the ecol-ogy and life history of the two tit species and the two flycatcher species are very similar with respect to the eco-logical diversity found in birds in general, and this simi-larity in ecology may have driven simisimi-larity in EPF rate (see Westoby et al. 1995). Clearly, additional comparisons with more species are needed to confirm the conclusions from our modeling exercise. Information on more species and on different genera and families are needed to test whether estimated EPF probabilities indeed vary mainly above the species level. Such a comparison would require the actual distribution (rather than just descriptive
statis-tics) of EPY for a wide variety of species, ideally in a number of different populations per species, but this in-formation is currently rarely published. We therefore en-courage future researchers to report this information. At least the estimates of EPF and EPC probabilities and their credible intervals (as generated by our model in app. A) should be reported, such that a meta-analysis of published information can be conducted in the future.
We interpret our model’s outcome as an indication that in the four species considered here, ecological conditions may be the main force determining variation in the dis-tribution of EPCs. This is because we find that the expected number of EPCs varies significantly across populations in the four passerines modeled. Examples of ecological pro-cesses that have been invoked to explain variation in the proportion of all young that are EPY across species and populations are population density (distance to nearest neighbor), synchrony of breeding, and other population-specific details that influence mating dynamics (e.g., West-neat and Sherman 1997; Stutchbury 1998; WestWest-neat and Stewart 2003). In addition, the genetic benefits of female choice may differ across populations (Petrie and Kem-penaers 1998). Thus, our model suggests that for the lim-ited set of species considered, variation in these ecological properties across populations may generate variation in the proportion of EPY primarily through their effect on EPC. As a putative empirical verification of the substantial differences in the distribution of EPCs across populations that our model estimates, one could temporarily disable the social male from fertilizing his mate in order to es-timate the minimum EPC frequency across populations (e.g., Michl et al. 2002). In addition, such a manipulation could also be employed to address the variation in EPC across species. Contrasting (of the four species considered here) blue tits with collared flycatchers would be most instructive, because our model suggests that collared fly-catchers have fewer EPCs despite the fact that they have more EPY. Finally, we wish to emphasize that our modeling approach does not allow us to differentiate between a sce-nario of active female choice and a more passive scesce-nario, where EPCs are determined by availability of and/or com-petition for mates. We assume that the distribution of EPCs follows a Poisson distribution, but both scenarios can cause such a distribution. Clearly, more detailed studies are needed in order to explore which population-specific factors cause variation in EPC probabilities. Field measures of aspects such as population density and synchrony in timing can be included in our modeling approach in order to test their effect on parameter m.
Conclusions
We have outlined a Bayesian modeling approach that al-lows separation of the distribution of EPCs from the
prob-186 The American Naturalist
ability of EPF in explaining the observed distribution of EPY in a population. In principle, this approach allows us to overcome the criticism that the distribution of EPY need not reflect the distribution of EPCs (Griffith 2007). Pro-vided that data on the distribution of EPY are available for a number of populations for different species, our model further allows for a coherent exploration of vari-ation in EPC and EPF on various levels. In the limited set of species investigated here, our model suggests that EPF probabilities vary little across species but that ecological processes affect EPCs. These two processes together de-termine the distribution of EPY over broods. Increased focus on these different levels in future studies, possibly incorporated in our modeling approach, is expected to provide more precise insights in the factors that drive var-iation in EPY frequency.
Acknowledgments
We thank all those who played a role in collecting and analyzing the material and B. O’Hara for helpful statistical discussions. Author contributions were as follows: organ-ization and writing, J.E.B.; statistical analysis, J.S.A.; ge-netic analysis and data compilation, remaining authors. Author order reflects the major contributions of J.E.B. and J.S.A.; the remaining authors are in alphabetical order. Two anonymous reviewers are thanked for their detailed com-ments. The extrapair procreation (EPP) work on the Lau-wersmeer great tit population was financially supported by the University of Groningen and Netherlands Organ-isation for Scientific Research (NWO) Vici grant 86503003 awarded to J.K. The EPP work on the Kolbeterberg blue tit population was supported by the Konrad Lorenz In-stitute for Comparative Ethology (Vienna) and the Max Planck Society. J.E.B. was employed as an Academy Re-searcher (1131390).
Literature Cited
Arnold, K. E., and I. P. F. Owens. 2002. Extra-pair paternity and egg dumping in birds: life history, parental care and the risk of retal-iation. Proceedings of the Royal Society B: Biological Sciences 269: 1263–1269.
Bennett, P. M., and I. P. F. Owens. 2002. Evolutionary ecology of birds: life history, mating systems and extinction. Oxford Univer-sity Press, Oxford.
Birkhead T. R. 1998. Sperm competition in birds: mechanism and function. Pages 579–622 in T. R. Birkhead and A. P. Møller, eds. Sperm competition and sexual selection. Academic Press, London. Birkhead, T. R., and A. P. Møller. 1996. Monogamy and sperm com-petition in birds. Pages 323–344 in J. M. Black, ed. Partnerships in birds: the study of monogamy. Oxford University Press, Oxford. Blomberg, S. P., T. Garland Jr., and A. R. Ives. 2003. Testing for phylogenetic signal in comparative data: behavioral traits are more labile. Evolution 57:717–745.
Brommer, J. E., P. Korsten, K. M. Bouwman, M. L. Berg, and J.
Komdeur. 2007. Is extrapair mating random? on the probability distribution of extrapair young in avian broods. Behavioral Ecology 18:895–904.
Charmantier, A., and P. Perret. 2004. Manipulation of nest-box den-sity affects extra-pair paternity in a population of blue tits (Parus caeruleus). Behavioral Ecology and Sociobiology 56:360–365. Charmantier, A., J. Blondel, P. Perret, and M. M. Lambrechts. 2004.
Do extra-pair paternities provide genetic benefits for female blue tits Parus caeruleus? Journal of Avian Biology 35:524–532. Double, M., and A. Cockburn. 2000. Pre-dawn infidelity: females
control extra-pair mating in superb fairy-wrens. Proceedings of the Royal Society B: Biological Sciences 267:465–470.
Dreiss, A., M. Richard, F. Moyen, J. White, A. P. Møller, and E. Danchin. 2006. Sex ratio and male sexual characters in a popu-lation of blue tits, Parus caeruleus. Behavioral Ecology 17:13–19. Dunn, P., and J. T. Lifjeld. 1994. Can extra-pair copulations be used
to predict extra-pair paternity in birds? Animal Behaviour 47:983– 985.
Foerster, K., M. Valcu, A. Johnsen, and B. Kempenaers. 2006. A spatial genetic structure and effects of relatedness on mate choice in a wild bird population. Molecular Ecology 15:4555–4567. Fossøy, F., A. Johnsen, and J. T. Lifjeld. 2006. Evidence of obligate
female promiscuity in a socially monogamous passerine. Behav-ioral Ecology and Sociobiology 60:255–259.
Gelman, A., J. B. Carlin, H. S. Stern, and R. B. Rubin. 2003. Bayesian data analysis. 2nd ed. Chapman & Hall/CRC, New York. Gowaty, P. A. 1996. Battle of the sexes and origins of monogamy.
Pages 21–52 in J. M. Black, ed. Partnerships in birds: the study of monogamy. Oxford University Press, Oxford.
Griffith, S. C. 2000. High fidelity on islands: a comparative study of extrapair paternity in passerine birds. Behavioral Ecology 11:265– 273.
———. 2007. The evolution of infidelity in socially monogamous passerines: neglected components of direct and indirect selection. American Naturalist 169:274–281.
Griffith, S. C., I. P. F. Owens, and K. A. Thuman. 2002. Extra pair paternity in birds: a review of interspecific variation and adaptive function. Molecular Ecology 11:2195–2212.
Hunter, F. M., T. Burke, and S. E. Watts. 1992. Frequent copulation as a method of paternity assurance in the northern fulmar. Animal Behaviour 44:149–156.
Kempenaers, B., G. R. Verheyen, and A. A. Dhondt. 1995. Mate guarding and copulation behaviour in monogamous and polyg-amous blue tits: do males follow a best-of-a-bad-job strategy? Be-havioral Ecology and Sociobiology 36:33–42.
———. 1997. Extra-pair paternity in the blue tit (Parus caeruleus): female choice, male characteristics and offspring quality. Behav-ioral Ecology 8:481–492.
Lack, D. 1968. Ecological adaptations for breeding in birds. Methuen, London.
Leech, D. I., I. R. Hartley, I. R. K. Stewart, S. C. Griffith, and T. Burke. 2001. No effect of parental quality or extrapair paternity on brood sex ratio in the blue tit (Parus caeruleus). Behavioral Ecology 12:674–680.
Lehtonen, P. K., C. R. Primmer, and T. Laaksonen. 2009. Different traits affect gain of extrapair paternity and loss of paternity in the pied flycatcher, Ficedula hypoleuca. Animal Behaviour 77:1103–1110. Lubjuhn, T., W. Winkel, J. T. Epplen, and J. Bru¨n. 2000. Reproductive success of monogamous and polygynous pied flycatchers (Ficedula hypoleuca). Behavioral Ecology and Sociobiology 48:12–17.
Lubjuhn, T., T. Gerken, J. Bru¨n, and T. Schmoll. 2007. Yearling male great tits, Parus major, suffer more strongly from cuckoldry than older males. Zoology 110:387–397.
Magrath, M. J. L., O. Vedder, M. van der Velde, and J. Komdeur. 2009. Maternal effects contribute to the superior performance of extra-pair offspring. Current Biology 19:792–797.
Mauck, R. A., E. A. Marschall, and P. G. Parker. 1999. Adult survival and imperfect assessment of parentage: effects on male parenting decisions. American Naturalist 154:99–109.
Michl, G., J. To¨ro¨k, S. C. Griffith, and B. C. Sheldon. 2002. Exper-imental analysis of sperm competition mechanisms in a wild bird population. Proceedings of the National Academy of Sciences of the USA 99:5466–5470.
Møller, A. P. 2000. Male parental care, female reproductive success and extra-pair paternity. Behavioral Ecology 11:161–168. Møller, A. P., and J. J. Cuervo. 2000. The evolution of paternity and
paternal care. Behavioral Ecology 11:472–485.
Møller, A. P., and P. Ninni. 1998. Sperm competition and sexual selection: a meta-analysis of paternity studies of birds. Behavioral Ecology and Sociobiology 43:345–358.
Morrow, E. H., G. Arnqvist, and T. E. Pitcher. 2002. The evolution of infertility: does hatching rate in birds coevolve with female polyandry? Journal of Evolutionary Biology 15:702–709. Mulder, R. A., P. O. Dunn, R. A. Cockburn, K. A. Lazenby-Cohen,
and M. J. Howell. 1994. Helpers liberate female fairy-wrens from constraints on extra-pair mate choice. Proceedings of the Royal Society B: Biological Sciences 255:223–229.
Petrie, M., and B. Kempenaers. 1998. Extra-pair paternity in birds: explaining variation between species and populations. Trends in Ecology & Evolution 13:52–58.
Petrie, M., C. Doums, and A. P. Møller. 1998. The degree of extra-pair paternity increases with genetic variability. Proceedings of the National Academy of Sciences of the USA 95:9390–9395. Rosivall, B., E. Szo¨llo˝si, D. Hasselquist, and J. To¨ro¨k. 2009. Effects
of extra-pair paternity and sex on nestling growth and condition in the collared flycatcher, Ficedula albicollis. Animal Behaviour 77: 611–617.
Sheldon, B. C., and H. Ellegren. 1999. Sexual selection resulting from extrapair paternity in collared flycatchers. Animal Behaviour 57: 285–298.
Spiegelhalter, D. J., N. G. Best, B. P. Carlin, and A. van der Linde. 2002. Bayesian measures of model complexity and fit. Journal of the Royal Statistical Society B 64:583–639.
Stutchbury, B. J. M. 1998. Breeding density best explains variation in extra-pair mating systems among avian species. Behavioral Ecol-ogy and SociobiolEcol-ogy 43:221–222.
Thomas, A., R. B. O’Hara, U. Ligges, and S. Sturtz. 2006. Making BUGS open. R News 6:12–17.
van Oers, K., P. J. Drent, N. J. Dingemanse, and B. Kempenaers. 2008. Personality is associated with extra-pair paternity in great tits (Parus major). Animal Behaviour 76:555–563.
Westneat, D. F., and P. W. Sherman. 1997. Density and extra-pair fertilizations in birds: a comparative analysis. Behavioral Ecology and Sociobiology 41:205–215.
Westneat, D. F., and I. R. K. Stewart. 2003. Exta-pair paternity in birds: causes, correlates, and conflict. Annual Review of Ecology and Systematics 34:365–396.
Westoby, M., M. R. Leishman, and J. M. Lord. 1995. On misinterpreting the “phylogenetic correction.” Journal of Ecology 83:531–534. Wilk, T., M. Cichon´, and K. Wolff. 2008. Lack of evidence for
im-proved immune response of extra-pair nestlings in collared fly-catcher Ficedula albicollis. Journal of Avian Biology 39:546–552. Wink, M., and A. Dyrcz. 1999. Mating systems in birds: a review of
molecular studies. Acta Ornithologica 34:91–109.
Associate Editor: Janette Boughman Editor: Donald L. DeAngelis