HAL Id: ird-03044198
https://hal.ird.fr/ird-03044198
Submitted on 7 Dec 2020
HAL is a multi-disciplinary open access
archive for the deposit and dissemination of
sci-entific research documents, whether they are
pub-lished or not. The documents may come from
teaching and research institutions in France or
abroad, or from public or private research centers.
L’archive ouverte pluridisciplinaire HAL, est
destinée au dépôt et à la diffusion de documents
scientifiques de niveau recherche, publiés ou non,
émanant des établissements d’enseignement et de
recherche français ou étrangers, des laboratoires
publics ou privés.
Spatial and temporal genetic structure of the planktonic
Sagitta setosa (Chaetognatha) in European seas as
revealed by mitochondrial and nuclear DNA markers
K Peijnenburg, C Fauvelot, J Breeuwer, S Menken
To cite this version:
K Peijnenburg, C Fauvelot, J Breeuwer, S Menken.
Spatial and temporal genetic structure of
the planktonic Sagitta setosa (Chaetognatha) in European seas as revealed by mitochondrial and
nuclear DNA markers.
Molecular Ecology, Wiley, 2006, 15, pp.3319 - 3338.
�10.1111/j.1365-294x.2006.03002.x�. �ird-03044198�
Molecular Ecology (2006) 15, 3319–3338 doi: 10.1111/j.1365-294X.2006.03002.x
© 2006 The Authors
Journal compilation © 2006 Blackwell Publishing Ltd
Blackwell Publishing Ltd
Spatial and temporal genetic structure of the planktonic
Sagitta setosa
(Chaetognatha) in European seas as revealed
by mitochondrial and nuclear DNA markers
K . T . C . A . P E I J N E N B U R G ,† C . F A U V E L O T , J . A . J . B R E E U W E R and S . B . J . M E N K E N
Institute for Biodiversity and Ecosystem Dynamics, Faculty of Science, Universiteit van Amsterdam, PO Box 94062, 1090 GB Amsterdam, The Netherlands
Abstract
Little is known about the spatial and temporal scales at which planktonic organisms are genetically structured. A previous study of mitochondrial DNA (mtDNA) in the holoplank-tonic chaetognath Sagitta setosa revealed strong phylogeographic structuring suggesting that Northeast (NE) Atlantic, Mediterranean and Black Sea populations are genetically disjunct. The present study used a higher sampling intensity and a combination of mitochondrial and four microsatellite markers to reveal population structuring between and within basins. Between basins, both marker sets indicated significant differentiation confirming earlier results that gene flow is probably absent between the respective
S. setosa populations. At the within-basin scale, we found no evidence of spatial or temporal structuring within the NE Atlantic. In the Mediterranean basin, both marker sets indicated significant structuring, but only the mtDNA data indicated a sharp genetic division between Adriatic and all other Mediterranean populations. Data were inconclusive about population structuring in the Black Sea. The levels of differentiation indicated by the two marker sets differed substantially, with far less pronounced structure detected by microsatellite than mtDNA data. This study also uncovered the presence of highly divergent mitochondrial lineages that were discordant with morphology, geography and nuclear DNA. We thus propose the hypothesis that highly divergent mitochondrial lineages may be present within interbreeding S. setosa populations.
Keywords: chaetognaths, deep clades, European seas, marine holoplankton, microsatellites, mitochondrial DNA, population structure
Received 7 January 2006; revision received 21 April 2006; accepted 21 April 2006
Introduction
Genetic studies of open ocean species have begun to challenge the long-standing view of low species diversity and broad-scale homogeneity in the pelagic realm (Norris 2000). On the one hand, genetic studies have indicated that sibling species are far more common in marine biota than previously thought (Knowlton 1993, 2000). On the other
hand, broad-scale surveys of genetic variation within marine species have shown that many are more structured than would be expected based on their large population size and high potential for dispersal (Avise 2000; Grosberg & Cunningham 2001; Hellberg et al. 2002). Genetic studies of marine holoplankton, the organisms that drift with the currents during their entire life, are particularly rare considering their abundance in the world’s oceans, ecological importance and wide taxonomic representation (but see for examples of foraminifers: De Vargas et al. 1999, 2002; Darling et al. 2000; dinoflagellates: John et al. 2003; copepods: Bucklin et al. 1996, 2000; Goetze 2003, 2005; euphausiids: Bucklin et al. 1997; Zane et al. 1998, 2000; cnidarians: Schroth et al. 2002; chaetognaths: Thuesen et al. 1993; Peijnenburg et al. 2004). Yet, if we are to better understand how
Correspondence: Katja T. C. A. Peijnenburg. Present address: Marine Biodiversity, Ecology and Evolution, UCD School of Biology and Environmental Science, Science and Education Research Centre (West), University College Dublin, Belfield, Dublin 4, Republic of Ireland. Fax: +353 1 716 1152; E-mail: katja.peijnenburg@ucd.ie
3320 K . T . C . A . P E I J N E N B U R G E T A L .
© 2006 The Authors Journal compilation © 2006 Blackwell Publishing Ltd
speciation takes place at open sea, particularly in holo-plankton, it is necessary to examine the spatial and temporal scales at which populations of these organisms are genetically structured.
A previous study of mitochondrial DNA (mtDNA) variation in the holoplanktonic chaetognath Sagitta setosa revealed surprisingly strong phylogeographic structuring suggesting that populations in the Northeast (NE) Atlantic, Mediterranean and Black Sea are genetically disjunct (Peijnenburg et al. 2004). Based on the geological and palaeo-climatic history of the European basins and estimates of net nucleotide divergence, the authors hypothesized that S. setosa populations became disjunct resulting from cyclical changes in temperature and sea levels during the Pleistocene. The present study expands from our previous work and investigates more in depth, and with a hierarchical approach, the spatial and temporal structure of S. setosa populations. Sagitta setosa, like all chaetognaths, is a protandrous hermaphrodite and reproduction is with internal fertilization occurring while eggs are in the ovary. Mating has rarely been observed in pelagic chaetognaths and self-fertilization is commonly observed under laboratory conditions. However, the consensus is that cross-fertilization is proba-bly more usual in nature (Pearre 1991). Fertilized eggs are released in the sea and remain in the open water column. S. setosa occurs over continental shelf areas only. In the NE Atlantic its distribution is continuous with a southern limit at about ∼45°N where the shelf suddenly becomes narrow. Its distribution pattern in the Mediterranean Sea is more fragmented, with coastal populations in the western basin, North African waters, Ionian Sea and Adriatic Sea. The spe-cies is also abundant in the upper layers of the entire Black Sea (Furnestin 1979; Peijnenburg et al. 2004).
Considering this species’ holoplanktonic lifestyle, little genetic structure within basins might be expected. However, previous work on the genetics of plankton populations suggested that distribution ranges are often not limited by the ability to disperse, but rather by the inability to maintain viable populations in areas where environmental conditions are not optimal (De Vargas et al. 1999, 2002; Norris 2000; Stewart et al. 2001; Goetze 2003, 2005; Sáez et al. 2003; Peijnenburg et al. 2004). Thus, distinct hydrographic and ecological conditions may be sufficient to reduce gene flow within seemingly continuous popula-tions. In the North Sea, there is a single anticlockwise circulation pattern, with oceanic waters entering from the north of Scotland and through the Channel. In the Skagerrak, the North Sea water mixes with less saline water from the Baltic and is transported north along the Norwegian coast (Fig. 1A, B, Prandle 1984; Otto et al. 1990). Similarly, in the Black Sea, the main current has an anticlockwise circular motion. However, in the narrowest part of this basin, part of the waters moving from the west go north, and this sea is thus divided into two parts, each with its own gyral
circulation (Fig. 1C, Zenkevitch 1963). The Mediterranean basin has sometimes been referred to as a ‘sea of seas’ because of its division into different subbasins, each with its own distinct characteristics, including partially enclosed gyral current systems (Fig. 1C; Pinardi & Masetti 2000) resulting in distinct planktonic faunas (Furnestin 1979). Hence, we would expect a higher degree of genetic struc-turing of S. setosa populations within the Mediterranean than within the NE Atlantic or Black Sea basins. Earlier results from mitochondrial cytochrome oxidase II (COII) sequences have indeed suggested that this may be the case (Peijnenburg et al. 2004). However, a larger sampling intensity of individuals is needed to reveal such small-scale structuring.
The present study used a more intensive sampling of S. setosa from three European seas and employed both mitochondrial and microsatellite DNA markers. Further-more, for the NE Atlantic, additional sampling localities were included to obtain a fine-scale spatial coverage of the continental shelf, which was repeated 2 years later. We used restriction fragment length polymorphism (RFLP) analysis to efficiently screen a large number of individuals for variation within the mitochondrial COII region and we developed four nuclear-encoded microsatellite loci. First, at the between-basin scale, we tested whether phylogeo-graphic patterns were congruent between marker sets, as well as with earlier work based on a more limited sampling of S. setosa. Second, we examined patterns of genetic vari-ation at within-basin scales: in the NE Atlantic we tested for small-scale spatial and temporal genetic structuring, whereas in the Mediterranean and Black Sea we tested the prediction that distinct hydrographic features limit gene flow. Finally, we compared the patterns of differentiation within basins to test the hypothesis of more genetic hetero-geneity and population structuring in the Mediterranean than the NE Atlantic.
Materials and methods
Sampling and DNA extraction
We examined Sagitta setosa collected over a period of 4 years (1999–2002) from three European seas. Analyses were based on 39 samples as well as 17 samples pooled per region and year (Table 1; Fig. 1). A thorough sampling scheme was employed for the NE Atlantic with a fine-scale spatial coverage of the continental shelf region in 1999 and 2000, and an approximate repetition of this sampling scheme in 2001 (Table 1; Fig. 1A, B). To avoid sampling the same population multiple times, samples were collected over a short period and against the general circulation pattern. Additionally, for some locations (99skag1, 01skag2, 01sb1 and 01sb3) we collected multiple samples: (i) from separate hauls (denoted A and B); or (ii) as juveniles, when
G E N E T I C S T R U C T U R E O F P L A N K T O N I N E U R O P E A N S E A S 3321
© 2006 The Authors
Journal compilation © 2006 Blackwell Publishing Ltd
both juveniles and adults were present (denoted juv, see sample codes Table 1; Fig. 1A, B). Samples from the Mediterranean were collected from the Ligurian Sea (1999 and 2001), Tyrrhenian Sea (2002), Gulf of Gabès (2002) and Adriatic Sea (2000; Table 1; Fig. 1C). Black Sea samples were collected in 2000 (00black1 and 00black2) and 2002 (02black1). Further sampling, preservation and DNA extraction protocols were described in Peijnenburg et al. (2004).
Mitochondrial DNA
A section of the mitochondrial COII gene was screened for polymorphism using three restriction enzymes: BstEII (G∼GTNACC, Live Technologies), ItaI (GC∼NGC,
Roche Diagnostics) and HapII (C∼CGG, Live Technologies). A 551-bp COII fragment was amplified using the primers and conditions described in Peijnenburg et al. (2004). Restric-tion digesRestric-tions were carried out in 20-µL total volumes containing 1 U of a single enzyme, 4 µL of the PCR (poly-merase chain reaction) product and enzyme specific buffers according to manufacturer’s recommendations. Resulting fragments were run on 1.5% agarose gels with TBE buffer, stained with ethidium bromide and viewed under ultra violet light. Fragment sizes were estimated against a 100-bp sizing ladder.
Composite PCR–RFLP haplotypes for each individual were defined based on restriction-site data and coded into binary (1,0) format. In order to resolve restriction-site data for new haplotypes and to reveal the presence of deep
Fig. 1 Sampling locations of Sagitta setosa in the Northeast Atlantic from 1999 and 2000 (A), 2001 (B) and in the Mediterranean and Black Sea from 1999 to 2002 (C). Samples that were pooled per region and year are encircled (see also Table 1). Dominating surface currents (grey arrows) and approximate scales are indicated.
3322 K . T . C . A . P E I J N E N B U R G E T A L .
© 2006 The Authors Journal compilation © 2006 Blackwell Publishing Ltd
mitochondrial lineages, each PCR–RFLP haplotype, from different basins where possible, was sequenced (methods described in Peijnenburg et al. 2004 and Papadopoulos et al. 2005). These data were added to an existing data set of 86 unique sequences published in Peijnenburg et al. (2004), totalling 148 unique COII sequences (GenBank accession numbers AY585565–AY585650 and DQ486064–DQ486126). The Tamura–Nei model (1993) with site-specific rates was
selected using modeltest (Posada & Crandall 1998) and used in distance calculations between sequence haplotypes. From this distance matrix, we constructed a neighbour-joining (NJ) tree in paup* 4.0b 10 (Swofford 1998) and assessed clade support by NJ bootstrap analysis with 1000 replicates.
After excluding all individuals belonging to deep mito-chondrial clades (see Results), the number of nucleotide
Table 1 Sample codes, sampling information and number of individuals per sample (n). Sample codes refer to the year of sampling, geographic region, sample number, separate hauls (A or B, if applicable) and juveniles (juv, if applicable). Pooled sample codes are in capital letters and denote the region and year of sampling (for sampling locations see Fig. 1)
Sample code Region Latitude Longitude
Sampling
date n
Pooled sample code NE Atlantic
99skag1A Skagerrak 58°10.1′N 08°44.6′E 05.09.99 59 SKAG99
99skag1B Skagerrak 58°10.1′N 08°44.5′E 05.09.99 49 SKAG99
99skag3 Skagerrak 57°42.1′N 09°46.0′E 06.09.99 55 SKAG99
99gb1 German Bight 55°23.4′N 07°09.3′E 08.09.99 41 GB99
99gb2 German Bight 55°01.4′N 06°24.9′E 08.09.99 48 GB99
99gb3 German Bight 54°05.9′N 08°13.3′E 09.09.99 41 GB99
99gb4 German Bight 54°06.0′N 06°58.6′E 09.09.99 47 GB99
99sb1 Southern Bight 52°59.2′N 02°01.8′E 14.09.99 57 SB99
99sb2 Southern Bight 53°06.7′N 01°48.0′E 14.09.99 48 SB99
99sb3 Southern Bight 51°44.4′N 01°54.2′E 15.09.99 50 SB99
00celt1 Celtic Sea 51°49.9′N 05°46.0′W 29.09.00 48 CELT00
00atl1 Atlantic inflow 58°41.2′N 04°01.5′W 16.10.00 57 ATL00
01skag1 Skagerrak 58°00.0′N 08°29.9′E 24.08.01 59 SKAG01
01skag2 Skagerrak 58°00.0′N 10°24.1′E 25.08.01 57 SKAG01
01skag2juv Skagerrak 58°00.0′N 10°24.1′E 25.08.01 25 SKAG01
01atl1 Atlantic inflow 57°00.0′N 00°29.9′W 27.08.01 50 ATL01
01gb1 German Bight 56°00.0′N 07°29.9′E 29.08.01 55 GB01
01gb2 German Bight 55°00.0′N 07°30.0′E 01.09.01 60 GB01
01gb3 German Bight 54°24.0′N 07°30.0′E 01.09.01 60 GB01
01gb4 German Bight 53°58.5′N 07°30.0′E 01.09.01 57 GB01
01sb1A Southern Bight 53°12.0′N 02°30.0′E 03.09.01 24 SB01
01sb1B Southern Bight 53°12.0′N 02°30.0′E 03.09.01 19 SB01
01sb1Bjuv Southern Bight 53°12.0′N 02°30.0′E 03.09.01 19 SB01
01sb2 Southern Bight 52°35.9′N 02°30.1′E 03.09.01 57 SB01
01sb3 Southern Bight 51°30.0′N 01°59.5′E 04.09.01 59 SB01
01sb3juv Southern Bight 51°30.0′N 01°59.5′E 04.09.01 21 SB01
01chan1 Channel 50°20.0′N 00°30.0′W 04.09.01 50 CHAN01
Mediterranean Sea
99lig1 Ligurian Sea 43°30′N 07°12′E 19.08.99 44 LIG99
99lig2 Ligurian Sea 43°30′N 07°12′E 20.08.99 52 LIG99
01lig1 Ligurian Sea 43°30′N 07°12′E 22.08.01 35 LIG01
01lig2 Ligurian Sea 43°30′N 07°12′E 22.08.01 53 LIG01
02tyr1 Tyrrhenian Sea 40°36′N 14°30′E 22.08.02 41 TYR02
02tyr2 Tyrrhenian Sea 40°36′N 14°30′E 22.08.02 26 TYR02
02gab1 Gulf of Gabès 33°42′N 10°24′E 19.06.02 69 GAB02
00adr1 Adriatic Sea 45°24′N 13°30′E 19.07.00 62 ADR00
00adr2 Adriatic Sea 42°18′N 18°42′E 12.07.00 18 ADR00
Black Sea
00black1 Black Sea 44°32′N 36°37′E 14.04.00 20 BLACK00
00black2 Black Sea 43°22′N 38°24′E 17.04.00 17 BLACK00
G E N E T I C S T R U C T U R E O F P L A N K T O N I N E U R O P E A N S E A S 3323
© 2006 The Authors
Journal compilation © 2006 Blackwell Publishing Ltd
substitutions per site (d; Nei & Tajima 1981; Nei & Miller 1990) weighted by the employed enzyme classes (Nei & Tajima 1983) between PCR–RFLP haplotypes was calcu-lated using the program d in reap (McElroy et al. 1992). reap was also used to estimate haplotype diversity (h; Nei 1987) and nucleotide diversity (π; Nei & Tajima 1981) within samples as well as nucleotide divergence (Nei & Tajima 1981) between samples (program da).
To test for population structuring, we estimated differ-entiation between samples as FST incorporating distance between haplotypes (as estimated by d in reap) and tested for divergence from the null distribution of no differenti-ation by 10 000 permutdifferenti-ations, as implemented in arlequin version 2.000 (Schneider et al. 2000). For comparison, we also tested for differentiation between samples using exact tests of haplotype frequencies (not incorporating distance between haplotypes) using a Markov chain procedure (100 000 steps). For these, and all further analyses involv-ing multiple simultaneous tests, we adjusted significance levels by applying a sequential Bonferroni correction with an initial α of 0.05 (Rice 1989).
Hierarchical analyses of molecular variance (amova; Excoffier et al. 1992) were performed using arlequin to examine the partitioning of the total variance between various groups of samples. First, using the complete RFLP data set, we examined the partitioning of mitochondrial variation among the three basins, among samples within each basin and within samples. Second, we conducted single-level amovas (one group of samples) to look at the partitioning of variation within basins, and among unpooled and pooled samples. Third, we carried out multilevel amovas (several groups of samples) to examine the pro-portion of within-basin genetic variance distributed among regions (for NE Atlantic and Mediterranean Sea only) and among years (for the NE Atlantic only). Significance of Φ-statistics (and associated variance components) was tested using 10 000 permutations of: (i) haplotypes among samples (for single-level amovas) and among groups (for multilevel amovas) for ΦST; (ii) haplotypes among
samples within groups for ΦSC; and (iii) samples among
groups for ΦCT (Schneider et al. 2000).
Microsatellite DNA
We used two protocols to obtain microsatellite markers for S. setosa, namely random amplified polymorphic DNA (RAPD) enrichment combined with repeat-specific PCR isolation of microsatellite arrays (PIMA method; Lunt et al. 1999) and enrichment with biotin-labelled repeat sequences (see Boneh et al. 2003). Fourteen primer pairs (seven from each protocol) were designed using the primer 3 program (Rozen & Skaletsky 1998) and tested for optimal annealing temperatures and PCR conditions. Of these, only four primer pairs resulted in reliable and interpretable fragment patterns (Table 2).
Four microsatellite loci were PCR amplified in 10 µL total volumes containing 1.2 µL genomic DNA, 1 µL 10× PCR buffer (HT Biotechnology), 4 µL dNTPs (2 mm each), 0.16 µL of each of two primers (10 µm), 0.4 unit of Taq polymerase (HT Biotechnology), 0.4 µL MgCl2 (25 mm) and 0.5 µL bovine serum albumin (BSA, 1 mg/mL) for loci Sset-1, Sset-2 and Sset-4, and 0.7 µL MgCl2 and 0.7 µL BSA
for locus Sset-3. Amplifications were carried out in a Biometra thermocycler (GmBH) with the following profile: 3 min at 94 °C, followed by 35 cycles of 25 s at 94 °C, 40 s at annealing temperature (Table 2), 25 s at 72 °C and a final extension step of 5 min at 72 °C. Amplified PCR products were diluted 10–15 times, electrophoresed and visualized on 6.5% denaturing polyacrylamide gels in a LI-COR DNA Sequencer 4200. To ensure accuracy and consistency of scoring across gels, PCR products of four individuals with known genotypes were run for every locus in the middle and at both sides of each gel, as well as commercially avail-able sizing standards (50–350 bp or 50–700 bp, LI-COR) for the two most variable loci. In addition, all samples with non-stepwise alleles (incongruent with the repeat motif, observed at Sset-1, Sset-3 and Sset-4) or nonamplifications (observed at Sset-3 and Sset-4) along with approximately
Table 2 Characteristics of four microsatellite loci developed for Sagitta setosa including primer sequences, PCR annealing temperatures (Ta), allele sizes, number of alleles (Na), repeat motifs and GenBank accession numbers of the original sequenced clones. Allelic information is based on a screening of 1724 individuals (see text). Labelled primers are indicated by †IRD700 or ‡IRD800
Locus Primer sequences (5′−3′) Ta (°C) Sizes (bp) Na Repeat motif GenBank
Sset-1 F: GGGCAAGGACGAGAAGTAAA‡ 58 85–121 18 (AAC)4 DQ463218
R: TCGGTCCTAATGATAAGAATGG
Sset-2 F: CATGTCGGTACATCGCTGTTT† 58 109–136 10 (AGG)7 DQ463219
R: GTGCTTCGGTTTCGCCTACT
Sset-3 F: CACTTTAGTGACACTCGTCTTGC† 57 84–279 54 (CAA)25 DQ463220
R: GTTGGCGAAACCGGATGT
Sset-4 F: TGCGTCTCTGTCTCAGAATCC† 58 118–434 89 (CTAT)19 DQ463221
3324 K . T . C . A . P E I J N E N B U R G E T A L .
© 2006 The Authors Journal compilation © 2006 Blackwell Publishing Ltd
20% of genotyped individuals were re-amplified and scored, a second time to confirm repeatability.
Each allele was given a unique three-digit code based on its length in base pairs, and nonamplifying individuals were coded as missing data. Microsatellite diversity within samples was estimated as the number of alleles per locus (Na), observed heterozygosity (HO) and unbiased gene diversity (expected heterozygosity, HE; Nei 1987) using fstat version 2.9.3.2 (Goudet 2001). Genotypes at all pairs of loci were tested for genotypic disequilibrium, and devi-ations from Hardy–Weinberg equilibrium (HWE) were estimated using Weir & Cockerham’s (1984) inbreeding coefficient ƒ (equivalent to Wright’s FIS) in genepop version 3.4 (Raymond & Rousset 1995). Locus conformance to HWE (any departure) was assessed using exact tests with significance determined by a Markov chain method, also in genepop.
The presence of null alleles was detected at loci Sset-3 and Sset-4 using the program micro-checker (Van Oosterhout et al. 2004). For samples where observed genotype frequencies deviated significantly from HWE expectations, null allele frequencies were estimated using Brookfield’s (1996) null allele estimator 2 (taking into account the presence of null allele homozygotes) and an alternative data set was generated in which each null allele was recoded as missing data (using micro-checker). Analyses to estimate differentiation between samples were carried out for both uncorrected data and data corrected for null alleles in genepop. To quantify the differentiation between samples, we used the infinite allele model (IAM; Kimura & Crow 1964) because our micro-satellite loci did not conform to the strict expectations of the stepwise-mutation model (Kimura & Ohta 1978). Thus, IAM-based estimates of FST (θ; following Weir & Cockerham 1984) were calculated between all sample pairs and visualized using metric multidimensional scaling analyses (MDS; Kruskal & Wish 1978) in xlsstat version 7.5 (available from http://xlstat.com). To test the null hypothesis of identical allele frequency distributions across samples, an unbiased estimate of the significance was calculated as described in Raymond & Rousset (1995).
We estimated the partitioning of total genetic variance based on allelic frequencies using amova as implemented in arlequin, with the same groupings as for mtDNA analyses.
Pairwise FST estimates over all loci were used as distance measure for microsatellite data (Weir & Cockerham 1984; Michalakis & Excoffier 1996).
Results
Mitochondrial DNA variability
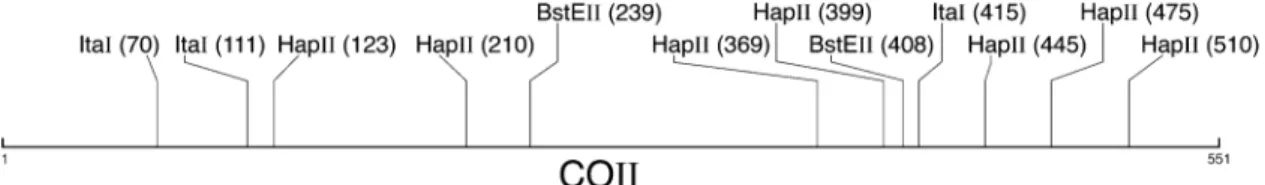
The COII fragment was successfully amplified and digested in 1739 individuals from three different basins. It is worth noting that a substantial proportion of the Black Sea samples (39%) did not amplify with our COII primers. This proportion was much smaller for NE Atlantic and Mediterranean samples (< 0.01% and 0.06%, respectively). Three restriction enzymes sampled 52 bp, representing 12 restriction sites that were spread along the 551-bp fragment (Fig. 2). All restriction sites were variable and resulted in 35 composite PCR–RFLP haplotypes (Table 3).
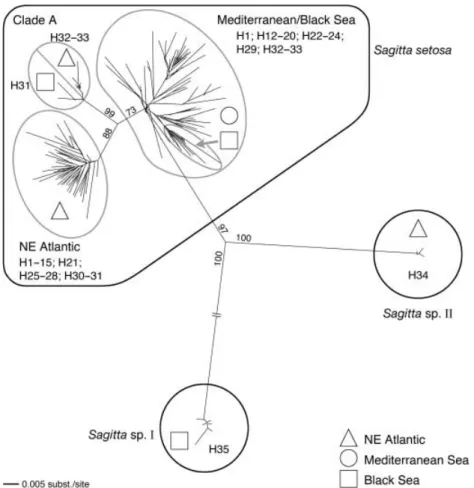
Sequence analysis of representatives of each PCR–RFLP haplotype produced a phylogenetic tree consisting of three highly divergent clades, denoted ‘S. setosa’, ‘Sagitta sp. I’ and ‘Sagitta sp. II’, with average maximum-likelihood distances of 14.49–25.92%, as opposed to within-clade divergences of 0.20–4.42% (Fig. 3). Sagitta sp. I is identified by haplotype H35 and is exclusive to the Black Sea (Sagitta sp. in Peijnenburg et al. 2004). Sagitta sp. II is identified by haplotype H34 and was found in the NE Atlantic at very low frequencies in different sampling locations (Table 3; Fig. 3). These highly divergent clades may represent different, probably cryptic, species and are therefore not included in population genetic analyses of S. setosa (but see Discussion).
A total of 1724 individuals were identified with haplo-types H1–H33 and were considered S. setosa (Table 3). Mean haplotype diversity (± SD) across all samples was 0.37 ± 0.11 and nucleotide diversity 0.92 ± 0.40%. Both measures of diversity (h and π, respectively) were highest in Mediterranean samples (0.50 ± 0.04 and 1.39 ± 0.17%), intermediate in Black Sea samples (0.40 ± 0.14 and 1.12 ± 0.66%) and lowest in NE Atlantic samples (0.30 ± 0.05 and 0.65 ± 0.12%). Estimates differed significantly for com-parisons between Mediterranean and NE Atlantic samples only (two-tailed Student’s t-test, P(h) = 0.0001 and P(π) = 0.0001). Haplotype frequencies were highly skewed for all
Fig. 2 Restriction map of a 551-bp fragment of the mitochondrial cytochrome oxidase II region (COII) of Sagitta setosa. Each restriction site is indicated by the enzyme by which it is recognized and the distance in base pairs (in parentheses) from the beginning of the forward primer.
GENETIC STRUCTURE OF PLANKTON IN EUROPEAN SEAS
3325
© 2006 The Authors
Journal compilation © 2006 Blackwell Publishing Ltd
Table 3 Percentage frequency of 35 composite mitochondrial PCR–RFLP DNA haplotypes (H1-H35) for 17 (pooled) samples of Sagitta setosa from the Northeast Atlantic, Mediterranean
and Black Sea. The cytochrome oxidase II region was surveyed by RFLP analysis with restriction enzymes BstEII, ItaI and HapII (ones and zeros indicate the presence and absence, respectively, of restriction sites that are ordered by distance from the start of the forward primer; see Fig. 2 for restriction map). Samples from which at least one representative was sequenced for a particular haplotype (and included in the phylogenetic analysis; see Fig. 3) are underlined (see Material and methods). Haplotype diversity (h) and nucleotide diversity (π) for each sample are given at the bottom of the table (excluding highly divergent haplotypes H34 and H35; see text and legend Fig. 3)
Hap. no.
Bst
EII ItaI HapII
Northeast Atlantic Mediterranean Sea Black Sea
SKAG 99 GB 99 SB 99 CELT 00 ATL 00 SKAG 01 ATL 01 GB 01 SB 01 CHAN 01 LIG 99 LIG 01 TYR 02 GAB 02 ADR 00 BLACK 00 BLACK 02 n 163 177 155 48 57 141 50 232 199 50 96 88 67 69 80 37 30 H1 00 011 0101001 79.8 81.4 86.5 79.2 80.7 85.1 86.0 87.1 87.4 82.0 1.0 — — — — — — H2 00 011 0101000 2.5 1.7 3.9 2.1 1.8 — 2.0 1.7 0.5 4.0 — — — — — — — H3 00 011 0100001 6.1 5.1 1.9 8.3 1.8 3.5 — 1.7 3.0 2.0 — — — — — — — H4 00 011 0001001 3.7 1.1 2.6 2.1 — 0.7 6.0 0.9 3.0 — — — — — — — — H5 00 011 0111001 — — 1.3 — — — — 0.4 — — — — — — — — — H6 00 011 1101001 — 0.6 — 2.1 — — — 0.4 1.0 — — — — — — — — H7 00 011 0100000 — 1.1 — — — — — — — — — — — — — — — H8 00 011 0000000 — — — — — 0.7 — — — — — — — — — — — H9 00 011 0101011 — 0.6 0.6 — — 1.4 — 0.9 — 2.0 — — — — — — — H10 00 011 0101101 — — — — — 0.7 — — — — — — — — — — — H11 00 011 1100001 — — — — — — — 0.4 — — — — — — — — — H12 00 001 0101001 1.2 1.7 — 2.1 3.5 2.8 2.0 1.3 1.5 — 63.5 70.5 70.1 68.1 17.5 67.6 60.0 H13 00 001 0101000 — — — — 1.8 — — — — — 17.7 15.9 22.4 24.6 67.5 — — H14 00 001 0100001 — 0.6 — — — — — — — — 5.2 3.4 1.5 — — 2.7 16.7 H15 00 001 0001001 — — — — — — — — 0.5 — 1.0 1.1 1.5 — — 2.7 — H16 00 001 0111001 — — — — — — — — — — 2.1 — 1.5 — — 8.1 — H17 00 001 0001000 — — — — — — — — — — 2.1 1.1 — 1.4 3.8 — — H18 00 001 0100000 — — — — — — — — — — 2.1 3.4 — 1.4 2.5 — 3.3 H19 00 001 1101000 — — — — — — — — — — — — — — 1.3 — —
3326
K. T. C. A. PEIJNENBURG
ET AL.
© 2006 The Authors
Journal compilation © 2006 Blackwell Publishing Ltd
H20 00 001 0111000 — — — — — — — — — — — — — — 3.8 — — H21 00 111 0101001 0.6 0.6 — — — 0.7 2.0 0.4 0.5 2.0 — — — — — — — H22 00 101 0101001 — — — — — — — — — — 1.0 — — 1.4 — — — H23 00 101 0101000 — — — — — — — — — — — — — — 1.3 — — H24 00 101 0111001 — — — — — — — — — — — 1.1 — — — — — H25 00 010 0101001 0.6 — — — — — — — 0.5 — — — — — — — — H26 00 010 0101011 — — — — — — — 0.4 — — — — — — — — — H27 10 011 0101000 — — 0.6 — — — — 0.4 — — — — — — — — — H28 10 011 0001001 0.6 — — — — — — — — — — — — — — — — H29 10 101 0101001 — — — — — — — — — — — — 1.5 — — — — H30 01 011 0101001 — 1.1 0.6 — — — — — — — — — — — — — — H31 10 011 0101001 3.7 4.0 1.3 4.2 5.3 4.3 — 3.0 1.5 8.0 — — — — — — 6.7 H32 10 001 0101001 0.6 0.6 — — 3.5 — 2.0 — 0.5 — 4.2 1.1 — 1.4 1.3 — — H33 10 001 0101000 — — 0.6 — — — — — — — — 2.3 1.5 1.4 1.3 — — H34 00 101 0011000 0.6 — — — 1.8 — — 0.9 — — — — — — — — — H35 00 101 0000000 — — — — — — — — — — — — — — — 18.9 13.3 Excl. H34 and H35: n 162 177 155 48 56 141 50 230 199 50 96 88 67 69 80 30 26 h 0.35 0.33 0.25 0.37 0.32 0.27 0.26 0.23 0.23 0.32 0.56 0.48 0.46 0.48 0.52 0.30 0.50 π 0.76 0.77 0.56 0.75 0.83 0.61 0.58 0.48 0.50 0.63 1.61 1.48 1.19 1.27 1.40 0.65 1.59
n, number of individuals screened; h, haplotype diversity; π, nucleotide diversity in percentages. For sample codes see Table 1. Hap.
no.
Bst
EII ItaI HapII
Northeast Atlantic Mediterranean Sea Black Sea
SKAG 99 GB 99 SB 99 CELT 00 ATL 00 SKAG 01 ATL 01 GB 01 SB 01 CHAN 01 LIG 99 LIG 01 TYR 02 GAB 02 ADR 00 BLACK 00 BLACK 02 Table 3Continued
G E N E T I C S T R U C T U R E O F P L A N K T O N I N E U R O P E A N S E A S 3327
© 2006 The Authors
Journal compilation © 2006 Blackwell Publishing Ltd
samples (Table 3). Frequency distributions for NE Atlantic samples were most skewed with a single common haplotype at very high frequencies (79.2–87.4%) and 23 haplotypes at very low frequencies (0.4–8.3%). Frequency distributions of Mediterranean samples were least skewed with two relatively common haplotypes (H12: 17.5–70.5% and H13: 15.9–67.5%) and 14 rare haplotypes (1.0–5.2%).
Microsatellite variability
The same individuals that were used in mtDNA analyses were screened for microsatellite variability. It is notable that individuals belonging to deep mitochondrial clades (Sagitta sp. I and Sagitta sp. II) and those that failed to amplify with the mitochondrial primers (mostly Black Sea samples) successfully amplified with all microsatellite primer pairs and produced common allelic patterns. This suggests that bad DNA quality is not a likely cause of the mitochondrial amplification failures. Nevertheless, microsatellite analyses of population structure only included the 1724 individuals that were identified by mitochondrial haplotypes H1–H33 (considered S. setosa).
The four microsatellite loci varied widely in number of alleles (2–42, mean = 16.5) and expected heterozygosities
(0.015–0.956, mean = 0.660) across samples (Table 4). Non-stepwise alleles were observed at low frequencies at Sset-1 (0.64%), Sset-3 (1.61%) and Sset-4 (2.65%). Tests of genotypic disequilibrium within samples between the four loci indicated no significant association of alleles (all P > 0.33), confirming that all loci can be treated as independent markers. Levels of genetic variability over all loci were similar across samples between the three basins, with no evidence against the null hypothesis of equal mean values of observed heterozygosities (two-tailed Student’s t-test, P = 0.126–0.437).
Heterozygote deficiencies were observed at Sset-3 and Sset-4 for all samples (FIS values ranged from 0.155 to 0.554 for Sset-3 and 0.100–0.435 for Sset-4) and were significant except for BLACK00 at Sset-3, and CELT00 and ATL01 at Sset-4 (Table 4). By contrast, all samples conformed to HWE expectations at Sset-1 (FIS = −0.047–0.182) and Sset-2 (FIS = −0.105–0.187). Null alleles were the most likely cause of departures from HWE and estimated null allele frequen-cies (r) per sample were high (0.108–0.411 for Sset-3 and 0.160–0.311 for Sset-4; Table 4). Results for the unpooled data set of 39 samples were similar but are not shown here because of space limitations. Allele frequencies at each locus for each sample from original and adjusted data sets are available upon request.
Fig. 3 Unrooted neighbour-joining tree of 148 cytochrome oxidase II sequence haplotypes (GenBank accession numbers AY585565– AY585650 and DQ486064–DQ486126) sampled in morphologically identified samples of
Sagitta setosa from the Northeast Atlantic,
Mediterranean and Black Sea. Supported groupings are encircled and bootstrap support is indicated on major branches. PCR–RFLP haplotypes (H1–H35, see Table 3) present within a clade as well as their geographic origin are indicated (see legend). Two highly divergent clades, denoted Sagitta sp. I (PCR– RFLP haplotype H35) and Sagitta sp. II (PCR–RFLP haplotype H34) may represent different (cryptic) species and were therefore not included in population genetic analyses (see text).
3328
K. T. C. A. PEIJNENBURG
ET AL.
© 2006 The Authors
Journal compilation © 2006 Blackwell Publishing Ltd
Table 4 Levels of genetic variability at four microsatellite loci for 17 (pooled) samples of Sagitta setosa. n, sample size; Na, number of alleles; HE, expected heterozygosity; HO, observed
heterozygosity; and r, null allele frequency as estimated by Brookfield’s (1996) estimator 2 using micro-checker. Significant deviations from Hardy–Weinberg equilibrium are in bold (null allele frequencies are only listed if a significant deviation was observed)
NE Atlantic Mediterranean Sea Black Sea
SKAG99 GB99 SB99 CELT00 ATL00 SKAG01 ATL01 GB01 SB01 CHAN01 LIG99 LIG01 TYR02 GAB02 ADR00 BLACK00 BLACK02
Locus Sset-1 n 162 177 155 48 56 141 50 230 199 50 96 88 66 68 78 30 26 Na 8 6 4 5 2 4 2 6 6 2 5 3 4 2 4 4 3 HE 0.113 0.083 0.069 0.102 0.035 0.076 0.020 0.085 0.074 0.040 0.111 0.045 0.060 0.015 0.038 0.159 0.147 HO 0.093 0.085 0.058 0.104 0.036 0.078 0.020 0.078 0.065 0.040 0.104 0.045 0.061 0.015 0.038 0.167 0.154 Sset-2 n 162 177 155 48 56 141 50 230 199 50 96 88 67 69 80 30 26 Na 8 6 8 6 7 7 6 7 8 6 7 8 6 7 10 9 6 HE 0.673 0.677 0.668 0.674 0.713 0.665 0.584 0.683 0.666 0.663 0.652 0.667 0.710 0.714 0.668 0.803 0.765 HO 0.660 0.718 0.548 0.688 0.714 0.674 0.520 0.696 0.693 0.540 0.677 0.693 0.612 0.667 0.738 0.867 0.692 Sset-3 n 150 163 140 45 55 131 49 208 186 44 92 81 63 61 78 30 26 Na 35 26 31 22 23 30 25 32 28 23 26 29 24 24 24 21 16 HE 0.943 0.941 0.941 0.938 0.944 0.940 0.948 0.939 0.941 0.910 0.947 0.947 0.947 0.943 0.944 0.905 0.916 HO 0.467 0.442 0.486 0.444 0.509 0.519 0.429 0.500 0.425 0.455 0.424 0.506 0.540 0.426 0.641 0.767 0.692 r 0.346 0.363 0.364 0.338 0.248 0.317 0.293 0.356 0.354 0.394 0.325 0.335 0.294 0.411 0.195 — 0.108 Sset-4 n 157 172 148 48 53 139 49 220 195 48 90 83 64 64 77 29 25 Na 31 35 32 27 23 35 25 40 42 26 30 29 26 22 26 21 22 HE 0.951 0.948 0.954 0.948 0.933 0.956 0.944 0.950 0.955 0.950 0.938 0.920 0.923 0.937 0.920 0.948 0.953 HO 0.739 0.610 0.628 0.854 0.679 0.633 0.796 0.677 0.677 0.667 0.644 0.554 0.563 0.531 0.597 0.655 0.640 r 0.160 0.218 0.236 — 0.215 0.188 — 0.209 0.175 0.207 0.246 0.275 0.255 0.311 0.227 0.199 0.215 Mean Na 20.5 18.3 18.8 15.0 13.8 19.0 14.5 21.3 21.0 14.3 17.0 17.3 15.0 13.8 16.0 13.8 11.8 HE 0.670 0.662 0.658 0.665 0.656 0.659 0.624 0.664 0.659 0.641 0.662 0.645 0.660 0.652 0.643 0.704 0.695 HO 0.490 0.464 0.430 0.523 0.485 0.476 0.441 0.488 0.465 0.425 0.462 0.450 0.444 0.410 0.504 0.614 0.545
G E N E T I C S T R U C T U R E O F P L A N K T O N I N E U R O P E A N S E A S 3329
© 2006 The Authors
Journal compilation © 2006 Blackwell Publishing Ltd
Population structure of S. setosa
Mitochondrial DNA. Phylogenetic analysis of COII sequences indicated strong phylogeographic structuring within the S. setosa clade (Fig. 3). This clade consisted of three subclades of which two were consistent with geography, and one was not. Of the two clades that were consistent with geography, one clade consisted entirely of NE Atlantic haplotypes and the other clade consisted of Mediterranean and Black Sea haplotypes. The Mediterranean/ Black Sea clade could be further subdivided and contained a monophyletic group representing all Black Sea haplotypes (see also Peijnenburg et al. 2004). The third clade, not consistent with geography, was denoted ‘Clade A’ and included NE Atlantic as well as Black Sea haplotypes. Clade A appeared intermediate between the NE Atlantic and Mediterranean/Black Sea clades, with average (± SD) maximum-likelihood divergences from these clades of 4.94 ± 0.54% and 5.14 ± 0.71%, respectively. One representative of Clade A was found in an earlier study (individual N3-3 in Peijnenburg et al. 2004) and was identified by RFLP haplotype H32. All other individuals belonging to this clade were identified by haplotypes H32 or H33 for NE Atlantic samples, and by H31 for Black Sea samples, and were sequenced to confirm this. Using this screening technique, 7 out of 1268 individuals from the NE Atlantic and 2 out of 56 individuals from the Black Sea were identified as Clade A. There was some bootstrap support for the grouping of NE Atlantic haplotypes H32 and H33 (59%) and Black Sea haplotypes H31 (69%) into two separate clades within Clade A (Fig. 3).
Congruent with sequence data, frequency distributions of RFLP haplotypes showed a distinct division of samples into two major groups: a NE Atlantic group with H1 as most common haplotype and a Mediterranean/Black Sea group with H12 or H13 as most common haplotype (Table 3). Not surprisingly, differentiation between the three basins was highly significant (global exact test, P < 0.001). FST estimates between basins were 0.71 (NE Atlantic–Mediterranean), 0.73 (NE Atlantic–Black Sea) and 0.15 (Mediterranean–Black Sea), and all differed signif-icantly from zero (permutation tests, all P < < 0.001). Net nucleotide divergence between basins amounted to 2.15% (NE Atlantic–Mediterranean), 1.75% (NE Atlantic–Black Sea) and 0.29% (Mediterranean–Black Sea).
Within the NE Atlantic, no evidence of geographic or temporal structuring of samples was observed (global exact test for unpooled and pooled data sets, P > 0.16). Within the Mediterranean basin, however, significant dif-ferentiation was observed (global exact test for unpooled and pooled data sets, P < 0.001). This was mainly the result of a reversal in relative frequencies of H12 and H13 in samples from the Adriatic Sea compared to other Medi-terranean samples (Table 3). FST values between the Adriatic
Sea and all other Mediterranean samples were very high (0.31–0.36) and highly significant (Table 5). Conversely, no differentiation was apparent among the Ligurian Sea, Tyrrhenian Sea and Gulf of Gabès samples. FST estimates between three samples from the Black Sea ranged from 0.02 to 0.10 and did not significantly differ from zero. When pooled per year, FST amounted to 0.09 and was marginally significant, suggesting that low sample sizes may have been the reason for nonsignificant differenti-ation within this basin [Table 5; global exact test, P (unpooled) = 0.14 and P (pooled) = 0.02].
Analysis of molecular variance (amova) indicated that a large proportion of the total mitochondrial variation resided among basins (69.81%, Table 6). Within the NE Atlantic, a small and nonsignificant part of the variance was distributed among regions (0.16%) or among years (0.19%). For both the NE Atlantic and Black Sea, the pro-portion of the variance distributed among pooled samples was higher than for unpooled samples, but not significant after Bonferroni corrections. Within the Mediterranean basin, however, large portions of the total mitochondrial variation were distributed among regions (20.0%) or among samples (15.47 and 17.10%), and all associated ΦST
values were highly significant (Table 6).
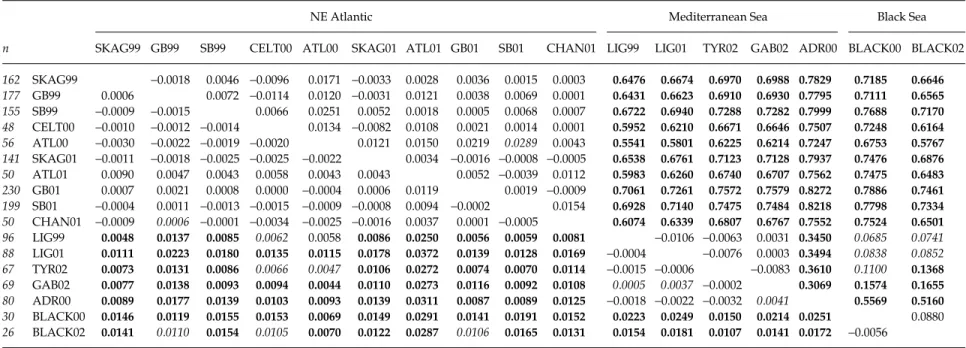
Microsatellite DNA. All four loci contributed to between-sample differentiation, although not equally (global single locus FST values were 0.006 for Sset-1, 0.015 for Sset-2, 0.012 for Sset-3 and 0.011 for Sset-4 using data uncorrected for null alleles). Significant heterogeneity between sample pairs was most often detected between samples from different basins: 90.6% and 100% of all significant com-parisons using uncorrected and data corrected for null alleles, respectively. Since levels of differentiation can be substantially overestimated when null alleles are present (O’Reilly et al. 2004), we present results for the corrected data set unless stated otherwise. Multilocus estimates of FST between basins were 0.012 (NE Atlantic– Mediterranean), 0.016 (NE Atlantic–Black Sea) and 0.020 (Mediterranean–Black Sea). When pairwise FST values were plotted using MDS between all unpooled and pooled samples (Fig. 4A and B, respectively), it is clear that pooling of samples increased the signal of differentiation between basins as opposed to the differentiation within basins. By pooling samples, and thus increasing sample sizes, the statistical power to reject homogeneity between basins also increased.
Pairwise multilocus FST between pooled samples and the probability of genetic heterogeneity are given in Table 5. Within the NE Atlantic, FST estimates were very low, with a maximum of 0.026 between 99skag1A and 01sb1B for the unpooled data set, and 0.012 between ATL01 and GB01 for the pooled data set. None of the pairwise exact tests within this basin were significant after Bonferroni corrections.
3330
K. T. C. A. PEIJNENBURG
ET AL.
© 2006 The Authors
Journal compilation © 2006 Blackwell Publishing Ltd
Table 5 Estimates of genetic differentiation (FST) between samples of Sagitta setosa (sample codes as in Table 1). Above diagonal: FST incorporating genetic distances between haplotypes
from RFLP analysis of the mitochondrial COII region. Below diagonal: multilocus FST (Weir & Cockerham 1984) based on variation at four microsatellite loci (loci Sset-3 and Sset-4 were
corrected for null alleles; see text). Significant deviations from genetic homogeneity (exact test: below diagonal; permutation test: above diagonal) are shown in italics when P < 0.01, and in bold type when remaining significant after sequential Bonferroni correction for multiple tests
n
NE Atlantic Mediterranean Sea Black Sea
SKAG99 GB99 SB99 CELT00 ATL00 SKAG01 ATL01 GB01 SB01 CHAN01 LIG99 LIG01 TYR02 GAB02 ADR00 BLACK00 BLACK02
162 SKAG99 −0.0018 0.0046 −0.0096 0.0171 −0.0033 0.0028 0.0036 0.0015 0.0003 0.6476 0.6674 0.6970 0.6988 0.7829 0.7185 0.6646 177 GB99 0.0006 0.0072 −0.0114 0.0120 −0.0031 0.0121 0.0038 0.0069 0.0001 0.6431 0.6623 0.6910 0.6930 0.7795 0.7111 0.6565 155 SB99 −0.0009 −0.0015 0.0066 0.0251 0.0052 0.0018 0.0005 0.0068 0.0007 0.6722 0.6940 0.7288 0.7282 0.7999 0.7688 0.7170 48 CELT00 −0.0010 −0.0012 −0.0014 0.0134 −0.0082 0.0108 0.0021 0.0014 0.0001 0.5952 0.6210 0.6671 0.6646 0.7507 0.7248 0.6164 56 ATL00 −0.0030 −0.0022 −0.0019 −0.0020 0.0121 0.0150 0.0219 0.0289 0.0043 0.5541 0.5801 0.6225 0.6214 0.7247 0.6753 0.5767 141 SKAG01 −0.0011 −0.0018 −0.0025 −0.0025 −0.0022 0.0034 −0.0016 −0.0008 −0.0005 0.6538 0.6761 0.7123 0.7128 0.7937 0.7476 0.6876 50 ATL01 0.0090 0.0047 0.0043 0.0058 0.0043 0.0043 0.0052 −0.0039 0.0112 0.5983 0.6260 0.6740 0.6707 0.7562 0.7475 0.6483 230 GB01 0.0007 0.0021 0.0008 0.0000 −0.0004 0.0006 0.0119 0.0019 −0.0009 0.7061 0.7261 0.7572 0.7579 0.8272 0.7886 0.7461 199 SB01 −0.0004 0.0011 −0.0013 −0.0015 −0.0009 −0.0008 0.0094 −0.0002 0.0154 0.6928 0.7140 0.7475 0.7484 0.8218 0.7798 0.7334 50 CHAN01 −0.0009 0.0006 −0.0001 −0.0034 −0.0025 −0.0016 0.0037 0.0001 −0.0005 0.6074 0.6339 0.6807 0.6767 0.7552 0.7524 0.6501 96 LIG99 0.0048 0.0137 0.0085 0.0062 0.0058 0.0086 0.0250 0.0056 0.0059 0.0081 −0.0106 −0.0063 0.0031 0.3450 0.0685 0.0741 88 LIG01 0.0111 0.0223 0.0180 0.0135 0.0115 0.0178 0.0372 0.0139 0.0128 0.0169 −0.0004 −0.0076 0.0003 0.3494 0.0838 0.0852 67 TYR02 0.0073 0.0131 0.0086 0.0066 0.0047 0.0106 0.0272 0.0074 0.0070 0.0114 −0.0015 −0.0006 −0.0083 0.3610 0.1100 0.1368 69 GAB02 0.0077 0.0138 0.0093 0.0094 0.0044 0.0110 0.0273 0.0116 0.0092 0.0108 0.0005 0.0037 −0.0002 0.3069 0.1574 0.1655 80 ADR00 0.0089 0.0177 0.0139 0.0103 0.0093 0.0139 0.0311 0.0087 0.0089 0.0125 −0.0018 −0.0022 −0.0032 0.0041 0.5569 0.5160 30 BLACK00 0.0146 0.0119 0.0155 0.0153 0.0069 0.0149 0.0291 0.0141 0.0191 0.0152 0.0223 0.0249 0.0150 0.0214 0.0251 0.0880 26 BLACK02 0.0141 0.0110 0.0154 0.0105 0.0070 0.0122 0.0287 0.0106 0.0165 0.0131 0.0154 0.0181 0.0107 0.0141 0.0172 −0.0056
G E N E T I C S T R U C T U R E O F P L A N K T O N I N E U R O P E A N S E A S 3331
© 2006 The Authors
Journal compilation © 2006 Blackwell Publishing Ltd
Global exact tests over all NE Atlantic samples were sig-nificant when samples were unpooled (P = 0.001) but in-significant when samples were pooled (P = 0.089) although FST estimates were negligible in both cases (−0.0006 and 0.0003, respectively). Similarly, the MDS plots show no association of samples according to different regions or years within the NE Atlantic, although ‘ATL01’ appears separate from other samples (Fig. 4). Possible reasons for this are the relatively low sample size of ‘ATL01’ (n = 50) because it was not pooled with other samples, and the fact that it was not corrected for null alleles at locus Sset-4.
Within the Mediterranean Sea, global exact tests were significant for both unpooled and pooled data sets (P = 0.0001 and 0.0021, respectively). However, none of the pairwise tests indicated significant genic differentiation (Table 5). Pairwise FST values were negative for all com-parisons except between the Gulf of Gabès (GAB02) and other Mediterranean samples, which were very low (0.0005– 0.0041) and only marginally significant (Table 5). Contrary to results from mtDNA data, the Adriatic Sea was not
significantly differentiated from other Mediterranean samples. Within the Black Sea, no evidence of sample differentiation was found (global exact test, P = 0.15 and 0.60 for unpooled and pooled data, respectively).
Consistent with these results, amovas based on allelic frequencies indicated that a tiny, but highly significant, fraction of the total nuclear variance was distributed among the three basins (0.93%) and that the vast majority was present within samples (99.03%, Table 6). For both the NE Atlantic and Black Sea, amovas did not detect any significant portion of the variance distributed among samples, regions or years within these basins. Within the Mediterranean basin, however, a small but significant por-tion was distributed among pooled samples (0.58%), which resulted from inclusion of the Gulf of Gabès sample only.
Discussion
Combined analysis of mitochondrial and nuclear data for 1724 Sagitta setosa individuals from three European
Table 6 Hierarchical analyses of mitochondrial DNA (mtDNA) and nuclear DNA (nDNA) molecular variance (amova) amongst three European basins (A), within the Northeast Atlantic (B), within the Mediterranean Sea (C) and within the Black Sea (D) showing the proportion of total variance distributed between various groups of samples. For within basin comparisons, the results of two single-level amovas (one group of samples) are given first for separate and pooled samples, respectively, and as the among-samples component only (ΦST). Associated with each hierarchical level are: degrees of freedom (d.f.), percentage of total variance explained (%), Φ-statistics incorporating Nei & Tajima’s (1981) distance among RFLP haplotypes for mtDNA and using allele frequencies (multilocus, corrected for null alleles) for nDNA. Estimates of statistical significance are given as probabilities of having, by chance alone, a more extreme variance component and Φ-statistic than the observed value (determined by 10 000 permutations): NS, not significant, *P < 0.05, **P < 0.01, ***P < 0.001; values in bold type remain significant after sequential Bonferroni corrections
Source of variation
mtDNA nDNA
d.f. % Φ-statistics d.f. % Φ-statistics
(A) Three basins
Among basins (39 samples, 3 groups) 2 69.81 ΦCT = 0.6981 *** 2 0.93 ΦCT = 0.0093 ***
Among samples within basins 36 2.03 ΦSC = 0.0673 *** 36 0.04 ΦSC = 0.0004 NS
Within samples 1685 28.16 ΦST = 0.7184 *** 3409 99.03 ΦST = 0.0097 ***
(B) Within NE Atlantic
Among samples (27 samples) 26 0.22 ΦST = 0.0022 NS 26 0.04 ΦST = 0.0004 NS
Among samples (10 pooled samples) 9 0.36 ΦST = 0.0036 * 9 −0.05 ΦST = −0.0006 NS
Among regions (6 groups) 5 0.16 ΦCT = 0.0016 NS 5 −0.04 ΦCT = −0.0004 NS
Among samples within regions 21 0.09 ΦSC = 0.0009 NS 21 0.07 ΦSC = 0.0007 NS
Within samples 1241 99.75 ΦST = 0.0025 NS 2509 99.96 ΦST = 0.0004 NS
Among years (3 groups) 2 0.19 ΦCT = 0.0019 NS 2 −0.02 ΦCT = −0.0002 NS
Among samples within years 24 0.11 ΦSC = 0.0011 NS 24 0.06 ΦSC = 0.0006 NS
Within samples 1241 99.71 ΦST = 0.0029 NS 2509 99.97 ΦST = 0.0003 NS
(C) Within Mediterranean Sea
Among samples (9 samples) 8 15.47 ΦST = 0.1547 *** 8 −0.06 ΦST = −0.0006 NS
Among samples (5 pooled samples) 4 17.10 ΦST = 0.1710 *** 4 0.58 ΦST = 0.0058 **
Among regions (4 groups) 3 20.00 ΦCT = 0.2000 * 3 −0.25 ΦCT = −0.0025 NS
Among samples within regions 5 −0.96 ΦSC = −0.0120 NS 5 0.14 ΦSC = 0.0014 NS
Within samples 391 80.96 ΦST = 0.1904 *** 791 100.11 ΦST = −0.0012 NS
(D) Within Black Sea
Among samples (3 samples) 2 5.39 ΦST = 0.0539 * 2 0.39 ΦST = 0.0039 NS
3332 K . T . C . A . P E I J N E N B U R G E T A L .
© 2006 The Authors Journal compilation © 2006 Blackwell Publishing Ltd Fig. 4 Multidimensional scaling plots of pairwise multilocus FST (Weir & Cockerham 1984) based on four microsatellites (of which Sset-3 and Sset-4 were corrected for null alleles, see text) among 39 samples (A) and 17 pooled samples (B) of Sagitta setosa from the Northeast Atlantic, Mediterranean Sea and Black Sea (see legend; see Table 1 for sample codes).
G E N E T I C S T R U C T U R E O F P L A N K T O N I N E U R O P E A N S E A S 3333
© 2006 The Authors
Journal compilation © 2006 Blackwell Publishing Ltd
seas revealed qualitatively congruent patterns of differ-entiation on large (between-basin) and smaller (within-basin) spatial scales. Both data sets indicated significant differ-entiation between populations from the NE Atlantic, Mediterranean and Black Sea. Congruent patterns were also observed within basins with no evidence of spatial or temporal structuring in the NE Atlantic, evidence of differentiation in the Mediterranean Sea (although patterns of substructuring were different as indicated by the two marker sets), and inconclusive results about structuring in the Black Sea. Quantitatively, however, the levels of differentiation were different, with far less pronounced structure detected by nuclear than mitochondrial markers. Alongside such information on S. setosa population structure, our study uncovered the presence of highly divergent mitochondrial lineages that were discordant with morphology, geography and nuclear DNA.
Between-basin genetic structure
Estimates of divergence based on COII PCR–RFLPs were high, with similar FST estimates between NE Atlantic and Mediterranean, and NE Atlantic and Black Sea populations, and the lowest estimate between Mediterranean and Black Sea populations. These results are congruent with sequence data from the same fragment, although estimates of net nucleotide divergence from RFLPs were lower compared to sequence data (a factor of 1.5–3.3; Peijnenburg et al. 2004). This may be explained by the fact that sequence data were corrected for saturation whereas RFLP data were not. Moreover, restriction enzymes sampled only a subset of the variation present within the COII fragment. This also explains why some RFLP haplotypes (e.g. H1 and H12–H15) were shared across basins while sequences of representatives of these haplotypes were grouped into monophyletic geographic clades (Fig. 3). Taken together, RFLP analysis provided an efficient method for screening large numbers of individuals for mtDNA variation and corroborate earlier conclusions that Atlantic, Mediterranean and Black Sea populations of S. setosa are probably disjunct. Furthermore, the pattern of population divergences is consistent with deep splits between Atlantic and Mediter-ranean populations and colonization of the Black Sea from the Mediterranean as proposed by Peijnenburg et al. (2004). Similar patterns were observed for mussels (Ladoukakis et al. 2002) and copepods (Papadopoulos et al. 2005).
Microsatellite data also indicated significant structuring among basins. However, FST estimates were much lower than RFLP-based estimates (a factor of 7.6–62.0). Contrary to mtDNA data, the lowest levels of differentiation were between NE Atlantic and Mediterranean, and NE Atlantic and Black Sea populations, and the highest estimate between Mediterranean and Black Sea populations. This discrepancy is most likely the result of higher levels of
homoplasy for microsatellites than mtDNA, although other explanations are also possible (see below). Micro-satellite data, however, provide independent support that phylogeographic breaks (sensu category I of Avise et al. 1987) exist between S. setosa populations from the three European seas.
Within-basin genetic structure
Genetic homogeneity among samples from different regions and years suggests that S. setosa constitutes a single interbreeding population within the NE Atlantic. This result is not surprising for a holoplanktonic species, considering that there is a single anticlockwise circulation in this region, and that the relevant time scales for mixing of waters from the entire shelf is of the order of years (Prandle 1984). Similar results were obtained for NE Atlantic populations of flatfish (Borsa et al. 1997; Hoarau et al. 2002, 2004) and squid (Shaw et al. 1999). Two other studies, however, examining mitochondrial variation in a goby (Gysels et al. 2004) and crab (Roman & Palumbi 2004), reported a barrier separating North Sea populations from more southern populations in the English Channel and Celtic Sea. An alternative explanation for the observed homogeneity of S. setosa is that populations have not yet reached an equilibrium between gene flow and genetic drift, so that significant structuring is not revealed by our genetic markers. Even though we cannot exclude this explanation, it is unlikely because of our extensive sampling of mitochondrial and nuclear diversity and the fact that we found significant structuring within the Mediterranean basin using the same markers.
Another pattern contained in our NE Atlantic data set was that of genetic patchiness, i.e. samples separated by 0–100 km were sometimes as genetically different as samples separated by 100–1000 km (Fig. 4). Some pairwise FST estimates were indeed quite high for a planktonic organ-ism (max. 0.037 for mtDNA and 0.026 for microsatellites) and some indicated marginally significant differentiation. However, such patterns were not consistent across markers nor across years, and are therefore not interpreted in terms of population structuring. One explanation for these ‘chaotic’ patterns may be that insufficient sample sizes resulted in overestimates of genetic differentiation, especially since levels of variability of our markers were very high and levels of differentiation within this basin were very low (Ruzzante 1998; Waples 1998; Kalinowski 2005). Support for this comes from the fact that our estimates of FST and significance of exact tests were generally reduced when NE Atlantic samples were pooled per region and year to increase sample size.
Significant heterogeneity within the Mediterranean basin was detected by both mtDNA and microsatellite markers, and for both unpooled and pooled data sets. This
3334 K . T . C . A . P E I J N E N B U R G E T A L .
© 2006 The Authors Journal compilation © 2006 Blackwell Publishing Ltd
result is consistent with our hypothesis that higher levels of genetic structuring were expected for the Mediterranean than the NE Atlantic because of the division into several subbasins and the presence of fragmented neritic habitats in the Mediterranean basin. Also consistent with this hypothesis is the higher level of mitochondrial diversity in Mediterranean than NE Atlantic samples, though this pattern was not apparent for microsatellites. Frequency distributions of RFLP haplotypes were also least skewed, and genealogical structure was deepest for Mediterranean samples. These results suggest that Mediterranean S. setosa populations are genetically structured because gene flow between sub-basins is limited, or alternatively, that popu-lations are presently connected by gene flow but diverged in the past (e.g. because of survival in different Pleistocene refugia). Mediterranean populations may also have had an effective population size larger than the NE Atlantic population, possibly resulting from less severe bottlenecks and/or selective sweeps. A combination of these possibilities is also conceivable.
Mitochondrial DNA data provided strong evidence that the Adriatic population of S. setosa is genetically differentiated from Ligurian, Tyrrhenian and Gulf of Gabès populations. Microsatellites, however, did not detect any differentiation between Adriatic and other Mediterranean samples, but instead suggested slight and marginally significant differ-entiation of the Gulf of Gabès sample. It should be stressed, though, that this differentiation was minimal, and based on allelic frequency differences at a single microsatellite locus (Sset-4) and a single sample from the Gulf of Gabès, and should therefore be interpreted cautiously. Differen-tiation between Adriatic and western Mediterranean populations is consistent with earlier results for S. setosa (Peijnenburg et al. 2004), several marine fish (Borsa et al. 1997; Bahri-Sfar et al. 2000; Stefanni & Thorley 2003) and a bivalve (Mariani et al. 2002).
There are several, mutually nonexclusive explanations for the discrepancy between mitochondrial and nuclear data in detecting the differentiation of the Adriatic Sea population, and for the higher estimates of population divergence detected by mtDNA in general. First, mito-chondrial markers are generally more sensitive in detect-ing differentiation because of a lower effective population size than nuclear markers (e.g. Buonaccorsi et al. 2001; Shaw et al. 2004). Second, sex-biased dispersal or survival is often cited to explain discrepancies between mtDNA and nDNA, but this seems implausible for a hermaphro-ditic species (but see Diaz-Almela et al. 2004 for a possible example). Third, selection may have differential effects on different genetic markers. Most examples, however, involve selection acting on certain allozyme loci (e.g. Lemaire et al. 2000; De Innocentiis et al. 2001; Arnaud-Haond et al. 2003). A dominant role for purifying selection in the evolution of mtDNA has also been suggested (Ballard & Whitlock
2004). We believe that selection on mtDNA may accelerate the coalescence of lineages, and thus increase levels of differentiation observed between populations. Further-more, the effect of (slight) selection pressures may be more important in large (pelagic) populations of marine organ-isms because the effect of drift is diminished. In particular, we reported indirect evidence of selection acting on the mitochondrial COII region in chaetognaths (Peijnenburg et al. 2004, 2005). Fourth, various technical problems may have reduced the signal of differentiation detected by our microsatellite markers. Microsatellites probably suffered from higher levels of homoplasy than mtDNA because of high mutation rates (especially when combined with allelic size constraints) and larger effective population size, inflat-ing the apparent similarity between populations (Nauta & Weissing 1996; Balloux et al. 2000; Estoup et al. 2002). Also, two out of four microsatellite loci were hypervariable (Sset-3 and Sset-4 had 54 and 89 alleles, respectively) and suffered from a high incidence of null alleles. Our results indicated that correcting for null alleles reduced the signal as well as the power to detect differentiation. Similarly, O’Reilly et al. (2004) comparing 14 microsatellite loci with varying levels of polymorphism in a marine fish, showed that estimates of differentiation and the probability to detect genetic differences among populations both dimin-ished when locus heterozygosities increased and data were corrected for null alleles. Finally, a potential problem with the microsatellite data set is related to sample size. Even though sample sizes of at least 50 are generally considered sufficient to produce precise estimates of FST with highly variable loci (Ruzzante 1998), this may not be the case when FST values are low (Kalinowski 2005). We found that the signal of differentiation between basins and within the Mediterranean basin increased when samples were pooled (Fig. 4; Table 6), suggesting that (much) larger samples may be necessary to detect differentiation of S. setosa populations in the Mediterranean Sea using highly variable nuclear markers. Summarizing, our data are inconclusive about whether Adriatic populations are presently connected by gene flow with other Mediter-ranean populations; however, mitochondrial data indicate that they have diverged in the past. Likewise, we cannot conclude whether populations within the Black Sea are genetically structured because sampling intensity was probably too low to detect subtle levels of differentiation with our highly variable markers.
Discordant mitochondrial lineages
Using RFLPs to screen for polymorphism within the COII fragment and subsequent sequencing of new haplotypes, we uncovered the presence of three groups of divergent mitochondrial lineages that were discordant with geography (Fig. 3). These groups were denoted Clade A, Sagitta sp.