Comprehensive modeling of thin film evaporation in
micropillar wicks
byGeoffrey Vaartstra
B.S. Mechanical Engineering Syracuse University, 2017Submitted to the Department of Mechanical Engineering in partial fulfillment of the requirements for the Degree of Master of Science in Mechanical Engineering
at the
MASSACHUSETTS INSTITUTE OF TECHNOLOGY June 2019
©2019 Massachusetts Institute of Technology 2019 All rights reserved.
A uthor ...
Certified by ...
Accented by ....
Signature redacted
Department of Mechanical Engineering May 8, 2019
Signature redacted
...
Evelyn N. Wang Gail E. Kendall Professor and Department Head of Mechanical Engineering Thesis Supervisor
Signature
redacted
MASSA H E I E OF TECHNOJUN 13 2019
(
... Nicolas Hadjiconstantinou Chairman, Department Committee on Graduate Theses0
Comprehensive modeling of thin film evaporation in
micropillar wicks
by
Geoffrey Vaartstra
Submitted to the Department of Mechanical Engineering on May 8*,2019 in Partial Fulfillment of the Requirements for the
Degree of Master of Science in Mechanical Engineering
Abstract
In the Information Age, society has become accustomed to continuous, rapid advances in electronics technology. As the power density of these devices increases, heat dissipation threatens to become the limiting factor for growth in the electronics industry. In order to sustain rapid growth, the development of advanced thermal management strategies to efficiently dissipate heat from electronics is imperative. Porous wicks are of great interest in thermal management because they are capable of passively supplying liquid for thin film evaporation, a promising method to reliably dissipate heat in high-performance electronics. While the maximum heat flux that can be reliably sustained (the dryout heat flux) has been well-characterized for many wick configurations, key design information is missing as many previous models cannot determine the distribution of evaporator surface temperature nor temperature at the evaporator's interface with electronic components. Temperature gradients are inherent to the passive capillary pumping mechanism since the shape of the liquid-vapor interface is a function of the local liquid pressure, causing spatial variation of permeability and the heat transfer coefficient (HTC). Accounting for the variation of the liquid-vapor interface to determine the resulting temperature gradients has been a significant modeling challenge.
In this thesis, we present a comprehensive modeling framework for thin film evaporation in micropillar wicks that can predict dryout heat flux and local temperature simultaneously. Our numerical approach captures the effect of varying interfacial curvature across the micropillar evaporator to determine the spatial distributions of temperature and heat flux. Heat transfer and capillary flow in the wick are coupled in a computationally efficient manner via incorporation of parametric studies to relate geometry and interface shape to local permeability and HTC. While most previous models only consider uniform thermal loads,
our model offers the flexibility to consider arbitrary (non-uniform) thermal loads, making it suitable to guide the design of porous wick evaporators for cooling realistic electronic devices.
We present case studies from our model that underscore its capability to guide design with respect to temperature and dryout heat flux. This model predicts notable variations of the HTC (-30%) across the micropillar wick, highlighting the significant effects of interfacial curvature that have not been considered previously. We demonstrate the model's capability to simulate non-uniform thermal loads and show that wick configuration with respect to the input thermal distribution has a significant effect on performance due to the distribution of the HTC and capillary pressure. Further, we are able to quantify the tradeoff associated with enhancing either dryout heat flux or the HTC by optimizing geometry. We offer insights into optimization and further analyze the effects of micropillar geometry on the HTC.
Finally, we integrate this model into a fast, compact thermal model (CTM) to make it suitable for thermal/electronics codesign of high-performance devices and demonstrate a thermal simulation of a realistic microprocessor using this CTM. We discuss further uses of our model and describe an experimental platform that could validate our predicted temperature distributions. Lastly, we propose a biporous, area-enhanced wick structure that could push thermal performance to new limits by overcoming the design challenge typically associated with porous wick evaporators.
Thesis Supervisor: Evelyn N. Wang
Acknowledgments
I would like to express my gratitude to my advisor Professor Evelyn Wang for her guidance and support during my first two years at MIT. Beyond the mentorship she has provided me in research and academics, I am grateful that she has been committed to caring about my overall well-being and happiness. She is a warm and approachable advisor who I have been fortunate to receive much wisdom from and share a few laughs with along the way. I am thankful that Professor Wang accepted me into her lab and very glad that she had a much clearer vision for my path than I did.
Evelyn also helped set me up for success by providing me with an outstanding mentor, Dr. Zhengmao Lu. Since I started as a graduate student, Zhengmao has patiently shared his knowledge with me and helped me develop confidence as a researcher. Walking to his desk for advice on a nearly daily basis during my first year undoubtedly accelerated my progress and made me learn the value of critical thinking over rushing headlong into problems. He also made me feel very welcome in the Device Research Lab and even advised me on how to improve my weightlifting form. I have been very fortunate to learn from Zhengmao and am grateful for his countless hours of mentorship that were essential to the work completed in this thesis. Although he did not contribute directly to this work, I would also like to thank Professor Shalabh Maroo for his mentorship and guidance when I was an undergraduate. He recognized my potential and gave me the opportunity to join his lab after my first year, patiently working to build my research skills from the ground up. I am very grateful for the weekly meetings (and many impromptu meetings) when I could stop by his office to discuss the challenges I was facing, no matter how big or small. What especially made Professor Maroo an exceptional advisor was his dedication to always look out for my best interest. He regularly advised me to spend less time doing research so that I could keep a good GPA without burning out, and when the time came to apply to graduate school, he encouraged me to dream big and sent numerous emails to Professor Wang to help me get her attention.
This work would also not have been possible without the support of all my labmates in the Device Research Lab. They have provided a friendly, supportive culture and have gladly shared their knowledge and experience with me. I was lucky to have joined the lab at the same time as Alina Lapotin, who has been here every step of the way to commiserate over the daily reminders that we still have a lot left to learn. This work was also made possible by generous funding support from the National Science Foundation under Grant No. 1730389.
Finally, I would like to acknowledge the love and support of my family, friends, and the special group of friends who have become my "family" in Cambridge. Their encouragement helped me to overcome difficult
moments and thrive in my academic and personal life. I am especially thankful to Ranbir Dhillon and Jasmyn Chacko for their tireless patience while helping me write personal statements and for their caring support whenever I have needed to confide in them.
Contents
I
Introduction ... 131. M otivation ... 13
1.2, Background ... 13
13 , Thesis objectives and outline ... 16
2. M odel form ulation ... 18
2,1, Interface shape ... 19
2,2, Param etric studies ... 20
2.2. 1. Heat transfer ... 20
2.2. 1. Fluid flow ... 23
23 . Device-level model ... 23
2.4, Sum m ary ... 24
3. Case studies ... 26
3.1. Heat transfer coefficient ... 26
3.2. Uniform thermal load ... 27
3.3, Arbitrary thermal load ... 28
3.4. Sum m ary ... 30
4. M odel validation ... 32
4.1. Heat transfer coeffi cient ... 32
4.1 Dryout heat flux ... 33
4.3 Sum m ary ... 34
5. Design and optim ization ... 35
5,1. Com prehensive design ... 35
5,2. Further analysis and insights ... 36
5,3. Sum m ary ... 40
6. Therm al m odeling of realistic m icroprocessors ... 41
6,1, Com pact thermal m odel ... 41
6.2, Integration of a m icropillar wick evaporator ... 42
6.3, Sum m ary ... 43
7. Conclusions and future work ... 44
7.1. Conclusions ... 44
7.3. Biporous, wicks for high-perform ance cooling ... 47
Bibliography ... 48
Appendix ... 51
Validation of assum ptions ... 51
List of Figures
Figure 1: Regime map for thermal management strategies. While flow boiling shows promising performance, this technology requires high pumping power and is plagued by inherent flow instabilities. Thin film evaporation devices have achieved high HTCs yet require design innovations to reach high maximum heat flux removal. Performance metrics reproduced from *Weibel et al. [II], **Zhu et al. [8], and
***C hu et al. [15]. ... 14 Figure 2: Merit number for various fluids that have been proposed for porous wick evaporators such as heat pipes and vapor chambers. It can be seen that water is an excellent candidate at ambient temperatures... 15 Figure 3: (a) Side view schematic of a micropillar wick operating during thin film evaporation. An input heat flux q!' is applied to the bottom of the substrate and is rejected by evaporation into pure vapor. Capillary pressure maintains a wetted surface by passively pumping liquid from the supply (x = 0) to the center of the device (x = L). (b) Schematic of a micropillar cell, which can be defined by its geometry
(d, 1, h) and the local mean curvature of the liquid-vapor interface (H (x)). (c) Top view of the micropillar
wick. Net flow is along the x coordinate only in the case where the liquid supply contacts only the sides of the w ick norm al to the x axis. ... 19
Figure 4: (a) Top view showing the lines of symmetry of the micropillar unit cell. Only the region enclosed by the dashed lines is treated as the domain. (b) Side view depicting the heat transfer parametric study where heat from q! is dissipated solely via evaporation. Symmetry (insulated) boundary conditions are applied to the lateral faces and pillar tops. The temperature of the evaporator (T) is evaluated as the average temperature at the surface (red line). (c) Side view depicting the flow parametric study. Mass flux due to an imposed pressure drop is reported in order to calculate the permeability from Darcy's Law. The interface is set as a symmetry boundary to impose no flux and no shear stress. ... 20 Figure 5: Physical picture of evaporation into pure vapor. The vapor flux from the interface is initially in equilibrium before a sufficient number of molecular collisions lead to equilibrium. This non-equilibrium region is referred to as the Knudsen layer and the gas kinetics in this region are described by the BTE. The subscript "1" denotes properties evaluated on the liquid side of the interface, "k" denotes properties evaluated at the Knudsen layer/far-field boundary, and "oo" denotes far-field flow properties. Quantities underlined in blue are known inputs to the linearized BTE solver while those underlined in red are determined by conservation of mass, momentum, and energy and by matching pressure boundary conditions (Pk = poo)... 2 1 Figure 6: Schematic depicting the concept of the condensation coefficient. A vapor molecule incident on the interface has the probability o- of condensing into the liquid face and is otherwise reflected...22 Figure 7: Evaporative heat flux as a function of superheat at the liquid-vapor interface as calculated by solving the linearized BTE for a = 0.052... . 23 Figure 8: Flow chart of the device-level model iterative approach. On the first iteration, uniform evaporative flux is assumed in the fluid domain, whereas subsequent iterations utilize the flux distribution. Ap(x) and q"(x) are passed back and forth between the fluid and heat transfer domains until a relative tolerance of 10' is met by the Euclidian norms of both Ap(x) and q"(x). ... 24 Figure 9: (First row) parametric sweeps of pitch and capillary pressure, with h = 25 ptm and (a) d = 10 pm and (b) d = 5 pm held constant. he increased with capillary pressure and was higher on average for smaller
pitches. (Second row) sweeps over height and capillary pressure, with 1 = 30 pm and (c) d = 10 pm and (d) d = 5 pm held constant. Taller pillars had a lower he that became increasingly invariant to interface shape. The last point of each curve represents the dryout condition for 0rec = 15° ... 27
Figure 10: Device simulation with d = 10 pm, 1 = 30 pm, h = 25 ptm, L = 5 mm, and q' = 82 W/cm2
in a vapor ambient at Tsat = 100 °C. (a) Distributions of evaporator (AT,) and source (ATs) superheat when the substrate thickness was 100 pm. ATe was -3 °C higher at the inlet than the center of the device. (b) Capillary pressure and he at position x/L relative to the liquid supply. he was directly calculated from Ap using the parametric study results. For the specified conditions, he varied -30% across the evaporator surface...2 8 Figure 11: Schematics depicting the simulated non-uniform thermal loads. A background flux of 50 W/cm2 is applied while a small hotspot receiving 100 W/cm2
is placed at (a) the center of the micropillar wick and (b) the edge of the wick that contacts the reservoir. ... 29 Figure 12: Distributions of superheat obtained from simulations of the same device geometry as the results in Figure 10 with a non-uniform thermal load. (a) Heat load q' = 50 W/cm2
on 0 5 x/L 5 0.9 and qin" = 100 W/cm2 on 0.9 < x/L 1. Unlike Figure 10(a), the maximum temperatures occurred at the center of the wick due to the localized heat flux. (b) Heat load q' = 100 W/cm2 on 0 x/L 5 0.1 and q' =
50
W/cm2 on 0.1 < x/L < 1. For the same dimension and strength of the "hotspot," the micropillar wick maintained lower peak temperatures when the hotspot was placed at the center of the wick where the HTC w as highest... 30 Figure 13: Superheat calculated by the model at various q!' corresponding to experimental conditions from [16]. The accommodation coefficient was fit to A1. The devices from [16] contacted the liquid reservoir on all sides, a condition which is easily accommodated for in our fluidic model. The device geometries (in pm) are A1: d = 5, 1 = 12, h = 82; A2: d = 12, 1 = 20, h = 90... 32 Figure 14: Predicted dryout heat flux curves compared against experimental results from [18] over a range of wicking lengths. The device geometries (in pm) are B1: d = 7, l = 20, h = 20; B2: d = 6, 1 = 50, h =
19 . ... 3 3 Figure 15: Dryout heat flux predicted by the present numerical model compared to the analytical model and experiments detailed in [16]. Micropillar height was varied while holding d = 12, l = 20. ... 34 Figure 16: Performance in terms of dryout and average HTC when micropillar height is varied. While previous models [16], [18] have predicted the increase in q,ryout with h, we now provide a comparison against the effect on he. These results can be used to optimize wick design for both maximum heat load and temperature constraints. Each he was evaluated at the corresponding q! = q"ryout to account for temperature dependence. The geometric ratios were fixed at d/h = 0.4, 1/h = 1.2 with wicking length L = 5 m m ... 36 Figure 17: Heat transfer coefficient and micropillar geometry figure of merit 0* for a broad range of micropillar geometries. To select an optimal geometry, the wick should be chosen that has the highest possible he while satisfying the minimum V/* needed to prevent dryout. ... 37 Figure 18: he as a function of wick porosity. Wicks of the same porosity (but different micropillar diam eters) have distinct values of he...38 Figure 19: Schematic depicting the thin film region (liquid region less than the distance 6 away from a micropillar) where the heat transfer rate is highest due to low thermal resistance between the solid and the liquid-vapor interface...39
Figure 20: he as a function of the modified wick porosity. Higher fraction of thin film area (corresponding to higher c*) tends to increase he for a fixed micropillar height. ... 40
Figure 21: (a) Schematic of a single grid cell used to model heat transfer in the processing layer of a microprocessor. (b) Boundary grid cell that represents the thermal path from the evaporator surface to the vapor chamber. Figure reproduced from [45]... . 41 Figure 22: Results of CTM simulations of a 256-core Intel SCC processor cooled by (a) a vapor chamber with a micropillar wick evaporator or (b) microchannel-based two-phase cooling. Reproduced from [45]. ... 4 2 Figure 23: Spatial temperature distributions in micropillar wicks measured by Zhang et al. [48] using micro-Raman spectroscopy. Scanning position 0 indicates the edge of the wick contacting the liquid supply. The micropillar geometries tested had d = 20 pm and h = 50 pm with pitches I = 100 pm (20-100), and 1 = 80 pm (20-80). The inlet is coolest in their work despite uniform heat flux because the reservoir was maintained at 40 °C-well below atmospheric Tsat-such that sensible heating could not be neglected near the inlet. Reproduced from [48]...46
Figure 24: Cross section of the area-enhanced, hierarchical wick for ultra-high heat flux cooling. The hierarchical wick design achieves the high heat transfer coefficients and large capillary pumping budget of nanopores without high viscous loss since liquid is supplied from larger pores. Area enhancement increases the area available for evaporation and liquid supply, thus augmenting the effective heat transfer coefficient and m axim um heat load... 47
Chapter 1
1. Introduction
1.1. MOTIVATION
Over recent decades, high demand from defense, aerospace, and the commercial sector have fueled research and development of high-performance electronic devices. However, modem technology has become capable of reaching power densities that are now approaching our limits to remove the heat that they inherently generate. The rapid innovation we have become accustomed to is threatened by a bottleneck at this thermal limit. For example, recent technologies such as high electron mobility transistors (HEMTs) made from gallium nitride (GaN) or gallium oxide (Ga2O3) promise outstanding potential for phased array radars, laser diodes, and high-power radio frequency amplifiers. However, upgrading to the latest HEMTs technology is difficult because it suffers from extreme local heating (-5 kW/cm2[1]). Comparing this new
cooling demand to the -0.1 kW/cm2
capacity of current industrial technologies, there is an acute need for order of magnitude improvement. Another vital concern is to dissipate high heat fluxes while maintaining reasonable operating temperatures [2], underscoring the necessity to improve the heat transfer coefficients of these cooling devices. It is typically observed that the lifetime HEMT-based devices decays exponentially with operating temperature [3]. To ensure chip reliability, elongate device lifetime, and continue pushing the limits of electronic device performance, advanced cooling technologies capable of high heat flux operation with large heat transfer coefficients are essential. As such, development of advanced thermal management technology has become critical to our ability to sustain our standard of fast-paced innovation of electronics.
1.2. BACKGROUND
As emerging technology continues to produce high-performance, high-power density electronics, heat dissipation becomes an increasingly critical challenge [4]-[7]. Liquid-vapor phase change has garnered much interest as a thermal management strategy since the latent heat of vaporization allows for high-flux heat removal. Figure 1 shows the performance of various phase change-based thermal management strategies compared against the baseline fan with heatsink that has been the standard in cooling electronics. Thermal management technologies can be characterized by two key metrics: the maximum heat flux that can be dissipated and the heat transfer coefficient (HTC), where a larger HTC results in a smaller temperature rise at a given heat flux. While flow boiling in microchannels has been broadly researched and performs well in terms of both metrics [8]-[10], flow instabilities and a high pumping power requirement have led to a separate focus on thin film evaporation from porous wicks as an alternative [11]-[13]. This approach offers the advantages of passive, capillary-driven flow and a high heat transfer coefficient due to low thermal resistance of the thin (<100 [im) liquid film. Consequently, use of porous wicks has become widespread in heat pipes and vapor chambers to cool electronics [6]. These devices take advantage of low resistance vapor transport to act as very effective heat spreaders [14], yet improvements in evaporator wick performance remain an active area of research.
100
Thin film evaporation*
-
Flow boiling
in
microchannels*
Pool Boiling
Fan + Heatsink
2
--0.1
0.1 1 10
Maximum Heat Flux (kW/cm
2)
Figure 1: Regime map for thermal management strategies. While flow boiling shows promising performance, this technology requires high pumping power and is plagued by inherent flow instabilities. Thin film evaporation devices have achieved high HTCs yet require design innovations to reach high maximum heat flux removal. Performance metrics reproduced from *Weibel et aL
[11], "Zhu et
aL
[8], and *"Chu etaL
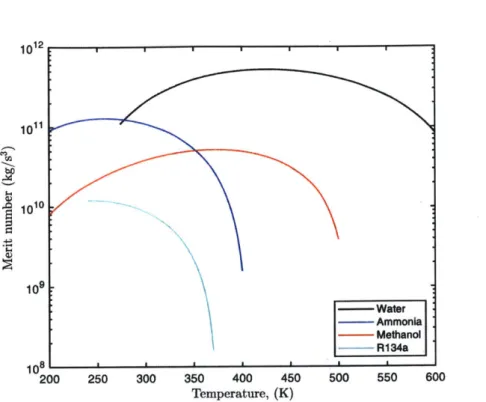
[15].To obtain fundamental insights, wicks with well-defined structures are ideal. Such precise control over geometric parameters can be achieved using traditional silicon nanofabrication techniques to create wicks comprised of arrays of micropillars. These micropillar wicks have been extensively studied [16H22] since they can be tailored and optimized using well-characterized fabrication processes. Previous work has primarily been focused on predicting the maximum heat flux a wick can sustain, typically referred to as the dryout heat flux. When operating at its dryout heat flux, the wick is utilizing its maximum capillary pumping budget, that is, the viscous pressure drop associated with replenishing the wick is equal to the minimum capillary pressure that the wick can sustain. If the thermal load is increased beyond this point, the liquid-vapor interface recedes at the location where the minimum capillary pressure has been reached and a dry spot forms. This dryout phenomenon is considered to be a failure mode since it causes a local spike in evaporator temperature, possibly leading to localized boiling or propagation of the dry spot. There are generally two contributing factors to the dryout heat flux: (1) the interplay of fluid properties as they relate to viscous losses, capillary pumping, and latent heat of evaporation, and (2) the influence of wick geometry on viscous losses and capillary pumping. It has been shown that the influence of the working fluid is well-captured by the fluid merit number, M (Equation 1), which quantifies how well a fluid will perform in terms of dryout heat flux [23]. Figure 2 shows the merit numbers for various working fluids that have been proposed for use or have been implemented in heat pipes and other porous wick evaporators.
M = oph (1)
102 1011 10 -- Water
~-Ammonia
Methanol R134a. 108 200 250 300 350 400 450 500 550 600 Temperature, (K)Figure 2: Merit number for various fluids that have been proposed for porous wick evaporators such as heat pipes and vapor chambers. It can be seen that water is an excellent candidate at ambient temperatures.
To capture the geometric contribution, models to predict dryout heat flux [16], [18] -have been developed based on studies of fluid flow in micropillar wicks [21], [24]. These models serve as design guidelines to optimize geometry for permeability and capillary pressure, both of which influence dryout. Adera et al. [16] approximated permeability as uniform [21] and used Brinkman's Equations [25] coupled with uniform evaporative mass loss to calculate dryout heat flux. Zhu et al. [18] captured the effects ofthe varying liquid-vapor interface shape by solving the 3D meniscus profile and performing computational fluid dynamics (CFD) simulations to determine permeability. Pressure and velocity distributions were then solved numerically for uniform evaporation over the micropillar wick to predict dryout heat flux.
Although these works have been able to accurately model the effects of micropillar geometry and wicking length on dryout heat flux, the HTC has not been rigorously characterized. Recently, Wei et al. [22] addressed micropillar optimization for both dryout heat flux and superheat by determining an effective thermal conductivity from finite element calculations for a flat interface. Extending that approach, Somasundaram et al. [26] solved for the meniscus shape and effective thermal conductivity using a finite element solver and modeling interfacial heat transfer with Schrage's Equation [27]. However, these works did not combine the HTC with a fluid model that incorporated the variation of interface shape across the evaporator wick, which can lead to inaccuracies in device-scale modeling. Therefore, a combined fluid and heat transfer model that resolves distributions of interface shape, HTC, and temperature has yet to be demonstrated.
A common shortcoming of models for both dryout heat flux and HTC has been limitation to uniform thermal loads (the uniform heat flux case) [16], [18], [22], [26]. While these models provide significant
insights for design, they lack the necessary complexity to simulate the performance of porous wick evaporators cooling realistic devices, where device architectures typically lead to localized heat generation. An analytical model to predict dryout heat flux for a simplistic chip with a single hotspot was developed by Adera et al. [19], but they assumed a uniform heat transfer coefficient at the evaporator and the model is limited to the single hotspot thermal load for which it was formulated. A model that is capable of simulating cooling performance under arbitrary thermal loads would provide high-fidelity predictions of dryout heat flux and peak temperatures, while also allowing designers to consider the effects of wick orientation/position with respect to the thermal input profile.
In this thesis, we have formulated a framework to comprehensively model thin film evaporation in micropillar wicks based on three principal design criteria: (1) source temperature (Ts), (2) evaporator temperature (T,), and (3) maximum heat flux. In practical applications, source temperature is constrained by the operating limit of the electronics, which sets the expected device lifetime [3]. Meanwhile, evaporator temperature is constrained by the boiling limit to avoid undesired nucleation [14]. Boiling is widely considered a failure mechanism for heat pipes and vapor chambers since it causes localized, transient hotspots to form, undermining the advantage of fluctuation-free performance that these technologies hold over flow boiling. Further, vapor bubbles within the wick hinder coolant flow, possibly leading to early dryout of the wick. For porous wick evaporators, the maximum heat flux is limited to the dryout heat flux (q,ryout), which is defined as the operating point at which the working fluid evaporates from the wick faster than it can be replenished. Under specified working conditions, the temperature at the evaporator surface is directly dependent on the HTC, and source temperature can be extrapolated by considering conduction in the substrate. Therefore, all three design criteria can be addressed by determining HTC and dryout heat flux for a given porous wick. Further, the variation of HTC on the evaporator due to liquid-vapor interface shape must be considered: our model shows that HTC varied by -30% on a 1 cm x 1 cm micropillar wick under specific operating conditions. However, considering the distribution of HTC amongst micron scale features on a millimeter scale wick presents a challenge for computational efficiency. Our framework consists of performing parametric studies of single micropillar unit cells and incorporating those results into a device-level model. In this manner, the microstructure is not directly simulated, yet rather is lumped into a set of pressure dependent properties. This efficient method is capable of resolving distributions of pressure and temperature on the wick, as well as predicting dryout heat flux, thus addressing all three evaporator design criteria. As a result of our numerical formulation that considers spatial distributions, our model is capable of taking arbitrary thermal loads as inputs, thus overcoming a significant shortcoming of previous works. Since the modeling framework used here is valid for any wick with a periodic structure, its potential impacts extend beyond thin film evaporation in micropillar wicks.
1.3. THESIS OBJECTIVES AND OUTLINE
The objective of this thesis is to model the performance of micropillar wick evaporators used to cool high-performance electronic devices. This model is to serve as a platform to guide comprehensive design that considers all three of the proposed criteria. The structure of this thesis is outlined as follows:
In Chapter 1, we introduced the motivation for developing advanced thermal management strategies and discussed the suitability of liquid-vapor phase change for such applications. We reviewed the literature relevant to porous wick evaporators and proposed a modeling framework that addresses source temperature, evaporator temperature, and maximum heat flux for arbitrary thermal loads.
In Chapter 2, we describe the model that we have formulated and discuss the assumptions and methods adopted for computational feasibility.
In Chapter 3, we present three case studies of evaporator performance using our model. We show the effects of geometry and curvature of the liquid-vapor interface on the heat transfer coefficient and demonstrate simulated temperature distributions for both uniform and non-uniform thermal loads.
In Chapter 4, we validate the heat transfer coefficient and dryout heat flux predicted by our model against experimental data from the literature.
In Chapter 5, we quantify the fundamental design tradeoff between the heat transfer coefficient and dryout heat flux for porous wick evaporators. We then give further insights into optimization of micropillar geometry.
In Chapter 6, we discuss thermal modeling of realistic microprocessors and present our collaborative effort to integrate our micropillar wick evaporator model into a compact thermal model. We show sample results for a thermal simulation of a 256-core Intel SCC processor cooled by a micropillar wick evaporator. In Chapter 7, we make concluding remarks and suggest an experimental platform to validate the temperature distributions predicted by our model. Finally, we propose a biporous wick for cooling high-performance electronics that could overcome the design tradeoff faced by wicks of a single porosity.
Chapter
2
2. Model formulation
Porous wicks efficiently transport heat via evaporation of a thin liquid film that is absorbed into the wick. Heat enters at the evaporator surface and is transported to the liquid-vapor interface predominantly by conduction through the solid structure of the wick as well as the liquid itself. Heat is released to the pure vapor ambient above the wick by liquid-vapor phase change. Meanwhile, the thin liquid film is maintained by a capillary-driven replenishing flow from an adjacent liquid reservoir. In this thesis, we seek to model the coupled heat transfer and fluid flow processes that occur during thin film evaporation from micropillar wicks, a specific porous wick geometry. Here, we are interested in steady state behavior, so we consider steady heat flux inputs and that a condenser maintains the vapor ambient in a saturated condition at a constant pressure.
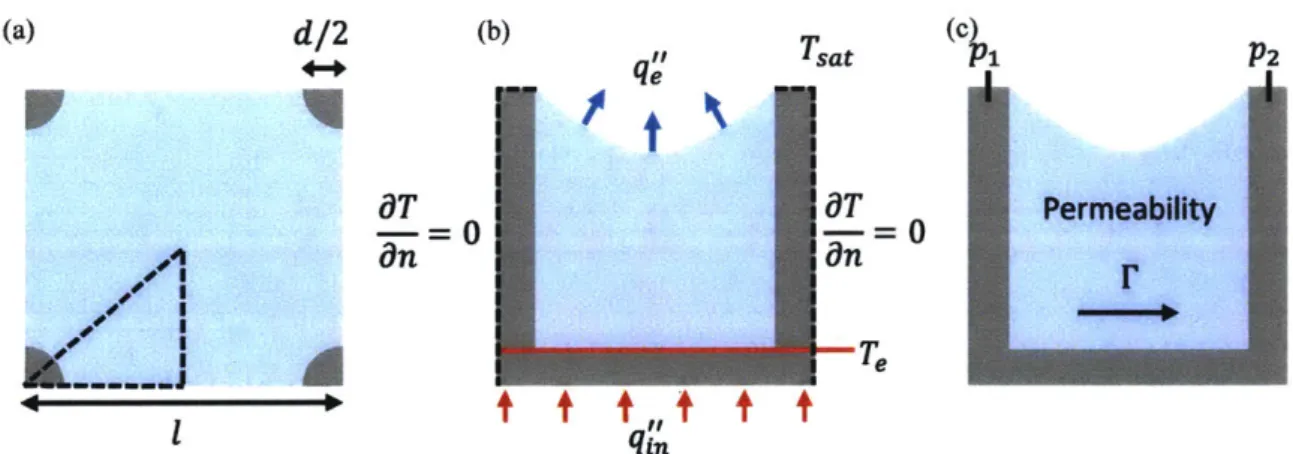
An input heat flux (qf ) is applied to a micropillar wick of wicking length L (edge to center of device) and is dissipated via thin film evaporation (q" (x)) into pure vapor (Figure 3). Capillary forces wick liquid into the micropillar array from the supply at the saturation temperature (Tsat), thus passively maintaining a wetted surface. The micropillar array treated here is comprised of a square unit cell (Figure 3(b)) repeated in a periodic fashion and defined by its diameter (d), pitch (1), and height (h). Due to the capillary pressure gradient across the substrate that drives flow, the liquid-vapor interface shape varies from cell to cell. The local interface shape can be described by its mean curvature (H), which is related to the capillary pressure (Ap = p - po) according to the Young-Laplace Equation (Equation 2) where a is the liquid-vapor surface tension.
Ap = 2aH (2)
This relation applies to all cases presented here as the Bond number is small (Bo = Apgl 2
/u-~10.-, see
Appendix for characteristic values used to determine dimensionless parameters).
Accounting for local effects of interface shape on heat transfer and capillary flow is crucial to this model. To accomplish this, we conduct parametric studies to determine the evaporative heat transfer coefficient (he) and local permeability (K) of the wick over a range of micropillar geometries and interfacial curvatures. The key assumptions behind this model are that convection in the thin film is negligible, lateral conduction in the fluid is much smaller than conduction towards the interface, the variation of curvature within a unit cell can be neglected, and evaporation is near equilibrium (see Appendix for validation of these assumptions).
(a) Liquid
Supply3
IL
II
q'(x)
~1+1I
IL
IL
I
(c) X
=0
qi(x)
*
*
*
0
0
Capillary Flow I*
0
0
0, 0
(b) d/2
H(x)
=LJ
h
IL~ ~~
ILI
L
=L
%
*
*
em---I
0
9
6Figure 3: (a) Side view schematic of a micropillar wick operating during thin film evaporation. An
input heat flux q" is applied to the bottom of the substrate and is rejected by evaporation into pure
vapor. Capillary pressure maintains a wetted surface by passively pumping liquid from the supply
(x = 0) to the center of the device (x = L). (b) Schematic of a micropillar cell, which can be defined by its geometry (d, 1, h) and the local mean curvature of the liquid-vapor interface (H(x)). (c) Top view of the micropillar wick. Net flow is along the x coordinate only in the case where the liquid supply contacts only the sides of the wick normal to the x axis.
2.1. INTERFACE SHAPE
When operating below the dryout limit, the three phase contact line is pinned to the tops of the micropillars and forms a meniscus. We solve for the 3D meniscus profile using a method identical to those used by [18],
[28]. The shape of the capillary surface (F = f(x, y) - z) can be determined by differential geometry [29],
which relates the outward unit normal vector (ft = VF/IIVFII) of the interface to its mean curvature. By this method, the interface is described by a static normal stress balance (Equation 3), where H is defined as positive when the liquid surface is convex, effects of gravity and inertial perturbation are neglected, and curvature is approximated as constant over the unit cell (see Appendix).
V . R = 2H (3)
This nonlinear differential equation is solved in COMSOL Multiphysics [30] on the domain shown in Figure 4(a) by imposing z = 0 at the micropillar edges and symmetry at the cell boundaries (all mesh convergence details can be found in the Appendix). Once resolved, we import the interface shape as a mesh into the heat transfer and fluid parametric studies. For each parametric study, the maximum curvature corresponds to the dryout capillary pressure (APry,out) as determined by a force balance at the contact line when the receding contact angle (0rec) is formed (Equation 4).
4o cos 6rec APdryout
=
( 2 ) d 0 (4)I
I
(a)
d/2
(b) Tsat (cP2T T 0 Permeability
4 n Onr
qi
Figure 4: (a) Top view showing the lines of symmetry of the micropillar unit cell. Only the region
enclosed by the dashed lines is treated as the domain. (b) Side view depicting the heat transfer
parametric study where heat from q" is dissipated solely via evaporation. Symmetry (insulated)
boundary conditions are applied to the lateral faces and pillar tops. The temperature of the
evaporator (Te) is evaluated as the average temperature at the surface (red line). (c) Side view
depicting the flow parametric study. Mass flux due to an imposed pressure drop is reported in order
to calculate the permeability from Darcy's Law. The interface is set as a symmetry boundary to
impose no flux and no shear stress.
2.2. PARAMETRIC STUDIES
Modeling physics in microscale features on a millimeter scale wick inherently introduces a tradeoff between computational efficiency and accuracy. We have approached this problem by parametrically studying the evaporative heat transfer coefficient and permeability of single micropillar cells as functions of geometry and capillary pressure (interface shape). These studies produce lookup tables for the device-level model that allow the wick to be modeled as a flat surface with pressure dependent properties. As such, solving the governing physics for the device-level model only requires meshing over the lengthscale of the wick itself, which is much cheaper computationally than meshing the micropillar geometry over the entire wick surface.
2.2.1. Heat transfer
The parametric study of heat transfer is conducted by determining the heat transfer coefficient (he, Equation
5) for a known q" being rejected to a pure vapor ambient at Tsat where the average evaporator temperature
(T,) issolved by a finite element calculation (Figure 4(b)).
he Te (5)
e " Tsat
In the computational domain, a uniform heat flux is supplied to the bottom of the cell, I
snm
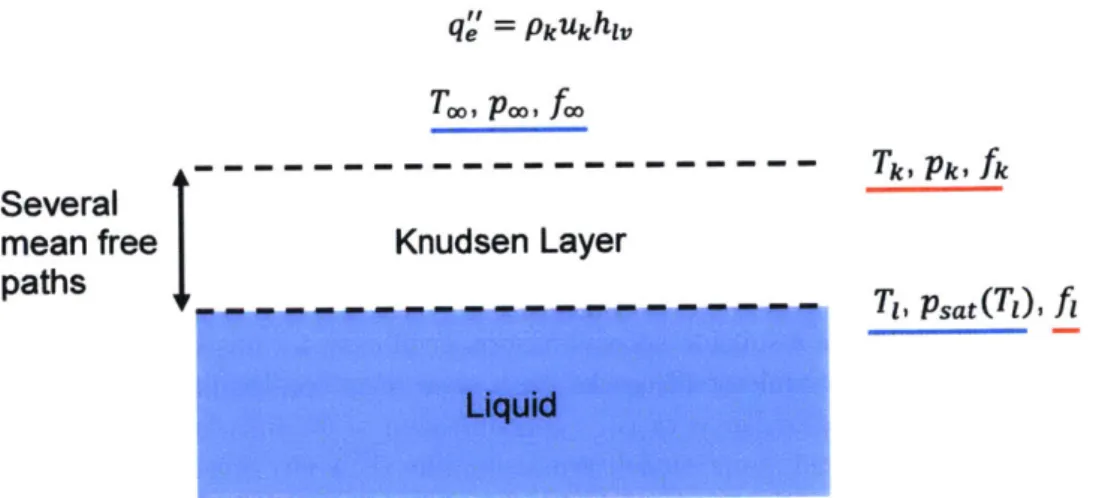
below the base of the micropillars to account for constriction resistance [31]. Since symmetry conditions are enforced at the lateral boundaries of the cell (see Appendix), heat is dissipated from the unit cell solely by evaporation from the liquid-vapor interface (q,'). Natural convection from the tops of the silicon pillars is neglected as the thermal resistance to natural convection was estimated to be -3 orders of magnitude higher than thermal resistance to evaporation (see Appendix).We calculate q,'(TI)-where T, is the temperature of liquid at the interface-using a solution to the
linearized Boltzmann Transport Equation (BTE) for Boltzmann-Krook-Welander (BKW) molecules (Equations 6,7)
k 1- cu (6)
pA (2RTI)1/2
Tk dUk
(2RTI)'/ 2
where the coefficients are given as c: = -2.13204 and d* = -0.44675 [32], R is the specific gas constant, and the subscript "k" indicates a variable evaluated at the Knudsen layer boundary. Low Mach number (near equilibrium) evaporation is an implicit restriction when using the linearized BTE (see Appendix). After additionally constraining the pressure at the Knudsen layer boundary to equal the far field pressure (Figure 5), the evaporative heat flux can be expressed as a function of the mean vapor speed at the Knudsen layer (Equation 8).
q' = PkUkhlv (8)
T., Po, fa
--- T~yfTk vkAfA
Several
mean free
Knudsen Layer
paths
---
- - - - T, Psat(T), fLiquid
Figure 5: Physical picture of evaporation into pure vapor. The vapor flux from the interface is initially in non-equilibrium before a sufficient number of molecular collisions lead to equilibrium. This non-equilibrium region is referred to as the Knudsen layer and the gas kinetics in this region are described by the BTE. The subscript "I" denotes properties evaluated on the liquid side of the interface, "k" denotes properties evaluated at the Knudsen layer/far-field boundary, and "oo" denotes far-field flow properties. Quantities underlined in blue are known inputs to the linearized BTE solver while those underlined in red are determined by conservation of mass, momentum, and energy and by matching pressure boundary conditions (Pk = pm).
The macroscopic flow parameters determined by Equations 6,7 correspond to the "total accommodation" case and must be corrected for fluids such as water. In kinetic theory, the probability that a vapor
molecule impinging on the liquid-vapor interface condenses is referred to as the condensation coefficient (oc) [33]. In Figure 6, we depict the probabilistic interpretation of the condensation coefficient: if an
incident flux
j
of vapor molecules impinges on the liquid-vapor interface, then the condensing flux is acj while a flux of (1 - ac)j is reflected back into the vapor phase. An evaporation coefficient a, isanalogously defined. It is well established that in the case of near equilibrium conditions (low Mach number), the evaporation and condensation coefficients are equal [34]. In this thesis, we will refer to the
accommodation coefficient a = c = ae which can range between 0 5 a S 1 in accordance with the probabilistic nature of the evaporation/condensation coefficients. The total accommodation solution given by Equations 6,7 corresponds to a = 1.
Vapor
j
Incident flux of
(1
- o-c)J vapor moleculesReflected stream
Condensing stream
oc Liuid
Figure 6: Schematic depicting the concept of the condensation coefficient. A vapor molecule incident on the interface has the probability ac of condensing into the liquid face and is otherwise reflected.
We selected the accommodation coefficient for evaporation/condensation as a = 0.052 to match data from Adera et al. [16]. This accommodation coefficient is not intended to represent the theoretical evaporation/condensation coefficients because it absorbs the non-idealities of the experiments from which it was calculated. The experiments detailed in [16] were not designed to be sensitive to the theoretical values; however, they provide a suitable accommodation coefficient for this thesis since the value was determined from experiments on micropillar wicks. Thus, some ofthe non-idealities that would be expected when evaporating from a micropillar wick (i.e., contamination of the interface) are packaged into the accommodation coefficient used in our model. We account for the effect of a non-unity accommodation coefficient on the macroscopic flow parameters using the method outlined by Meland and Ytrehus [35]. In Figure 7, we show the evaporative heat flux determined by solving the linearized BTE as a function of superheat at the liquid-vapor interface (ATint = T, - Tsat) for a = 0.052. In the micropillar wick, large gradients in ATin,t are expected since the conductive micropillar makes direct thermal contact with the interface. In this influence region of the micropillar where ATi,nt is large, the evaporative flux will be highest due to the steep slope of q" (Figure 7). This so called "thin film region" will be discussed further in 5.2. The solution for q" serves as a non-linear boundary condition when we solve the steady state heat transfer problem over the micropillar unit cell domain using COMSOL. We repeat this calculation for numerous geometries at capillary pressures ranging from zero to APdryout to construct a lookup table for the heat transfer coefficient.
5001 400
5
300 200 100 0 0 2 4 6 8 10 ATt (0C)Figure 7: Evaporative heat flux as a function of superheat at the liquid-vapor interface as calculated by solving the linearized BTE for a = 0.052.
2.2.1. Fluid flow
We conduct parametric studies of laminar flow in micropillar cells by adapting the methods of Zhu et al. [18]. In summary, the Navier-Stokes Equations are solved in COMSOL for laminar flow (Reynolds number
Reh = puh/i-101) over a range of geometries and interfacial curvatures. A pressure difference is imposed
across the cell and the mass flux (r) is reported (Figure 4(c)), from which the Darcian permeability (K) can be back calculated from Darcy's Law (Equation 9) where y is the dynamic viscosity of the liquid.
K
u = -- Vp (9)
For a fixed geometry, permeability is a function of interface shape only, which is set by the local capillary pressure. More pronounced curvature yields lower permeability since the effective cross section of the flow is reduced. We account for the effect of curvature by importing the corresponding interface shape and setting it as a symmetry boundary, which enforces no flux and no shear stress at the interface. By this
method, we compile a look up table for permeability as a function of geometry and capillary pressure.
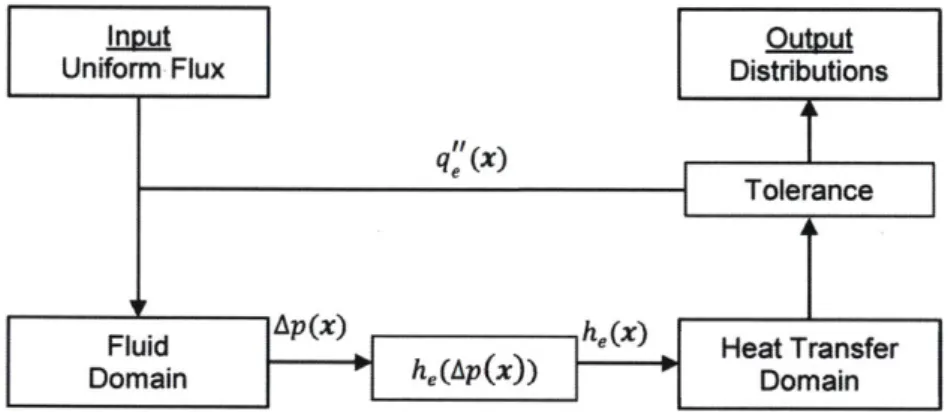
2.3, DEVICE-LEVEL MODEL
We formulated a device-level model for micropillar wicks by coupling fluid and conduction domains for an arbitrary heat load into a substrate of thickness t. The fluid domain is considered as a continuous, porous
medium modeled by Darcy's Law. Given a wick of uniform geometry, the permeability is a function only
of local pressure as described by the parametric study. Reference pressure is set at the inlet while the lines of symmetry parallel to the x and y axes that bisect the device are no flux (symmetry) boundaries. Due to
the low speed of liquid moving toward the interface (Peclet number Peh = uehpcp/k~102, see Appendix),
evaporation can be modeled as a volumetric mass loss (Equation 10)
where Qm = -q"(x)/(hh).
The conduction domain takes an arbitrary heat flux input that is dissipated from the evaporator surface according to q "(x) = h,(x)AT, where he(X) is a function of the local pressure solved in the fluid domain according to the parametric study (he(X) =
f(Ap(x)))
and AT is the local superheat (T - Tsat). q"(x) is then returned to the fluid domain for the next iteration such that the distribution of evaporative heat flux is accounted for in the pressure calculation. In this way, the fluid and conduction domains are coupled by passing pressure and heat flux distributions, respectively (see Figure 8 for visual reference). Symmetry boundaries are assigned to the lines of symmetry bisecting the device and inlet edges, which is reasonable so long as liquid is supplied at Tsat. For all device simulations presented in this work, this process was iterated until the Euclidean norms of the pressure and heat flux distributions each converged to a relative tolerance of at most 106.Irmyt Output
Figure 8: Flow chart of the device-level model iterative approach. On the first iteration, uniform
evaporative flux is assumed in the fluid domain, whereas subsequent iterations utilize the flux
distribution. Ap(x) and
q"'(x)
are passed back and forth between the fluid and heat transferdomains until a relative tolerance of 10" is met bythe Euclidian norms ofboth Ap(x) and q,'(x). As outputs, the model returns the distributions of pressure, temperature, heat transfer coefficient, and redistributed evaporative heat flux. Since conduction is solved numerically for the entire solid substrate, the temperature distributions at the evaporator and source are determined by the model, thus providing complete information for design criteria 1 and 2. Our model can also be used to provide guidance for the third design criteria because the dryout condition can be defined by a critical pressure (APryout) and the model precisely determines the pressure distribution.
2.4. SUMMARY
In summary, we have formulated a coupled fluidic-heat transfer model to predict the performance of micropillarwicks forthin film evaporation. Tomake a computationally feasible model, we used parametric studies to capture the unit cell (microscale) physics and translate these results into pressure and geometry dependent properties for a device-level model. To realize these parametric studies, we first solved the profile of the liquid-vapor interface to account for the effects of local curvature on heat transfer and fluid flow. Using these interface shapes, we solved for steady conduction in the micropillar unit cell where the evaporative flux is calculated from a solution to thelinearized BTE. We fit the accommodation coefficient to experimental results for micropillar wicks to attain high fidelity results from the BTE. Additionally, we
performed CFD simulations to determine the Darcian permeability of the micropillar unit cells. Finally, the pressure and geometry dependent heat transfer coefficient and permeability were imported as lookup tables into the device-level model (millimeter scale), which resolves the distributions of pressure, temperature, heat transfer coefficient, and evaporative heat flux on the micropillar wick. As such, this model addresses all three relevant design criteria (source temperature, evaporator temperature, and maximum heat flux) for arbitrary thermal loads.
Chapter 3
3. Case studies
3.1. HEAT TRANSFER COEFFICIENT
Beyond allowing for accurate modeling of micropillar wick performance, the parametric study of heat transfer shows the effects of geometry and local pressure on the evaporative heat transfer coefficient. We present two studies of evaporation from a silicon micropillar wick into pure water vapor at 100 °C that highlight these effects: varying I while holding constant d = 10 pm and h = 25 pm (Figure 9(a)); and
varying h while holding constant d = 10 pm and I = 30 pm (Figure 9(c)). ql was set to 50 W/cm2 for all parametric sweeps in Figure 9. For each geometry, he was determined for Ap ranging from zero (flat interface) to the APdryout corresponding to 0rec = 150 (receding contact angle for water on silicon dioxide [36], a thin film of silicon dioxide is commonly used to enhance wetting and provide a dielectric barrier [16], [18], [37]). We observed that for a fixed geometry, he increased with capillary pressure. As interfacial
curvature becomes more pronounced, the effective thickness of the evaporating film decreases, thus lowering the conduction resistance of the liquid. In addition, the augmented interfacial area further enhances the evaporation rate. For increasing pillar height, he dropped steadily since film thickness scales with h, effectively increasing conduction resistance (Figure 9(c)). It can be seen that the effect of curvature was dampened for tall pillars, i.e., less variation of he across a wick will be observed for larger values of h/d. For Figure 9(b) and (d), we performed the same parametric sweeps as in (a) and (c), respectively, with the diameter decreased to d = 5 pm. In these cases, a smaller micropillar diameter tended to increase the heat
transfer coefficient. This observation cannot be taken as a general rule since he is the result of interplay amongst all of the geometric parameters' influence on the physics. For example, he was reduced for the smaller diameter for the curves h/d = 4 and h/d = 5 (Figure 9(c,d)). The effects of different geometric parameters on the heat transfer coefficient will be further discussed in 5.2. Dependence of he on the input heat flux is weak for this representative geometry (Figure 9(a)): a 10% change of q resulted in a 0.082% average difference in predicted he.
d = 10pm h = 25 pm A . .A V V A &... d =2 V d =3 ---- G--- l/d=4 |/d=5 0 -1 -2 -3 -4 -5 -6 Ap (kPa)
A
hd = 2 ... h/d =4 Avh/d=3
a h/d=5 d =10 pm, l=3pm . A' ---i . .0 V. . .. o--'° a (b) 180 160 140 120 100 80 60 40 (d) 120 110 100 90 80 70 60 50 40 0 -2 -4 -6 -8 -10 -1t Ap (kPa) 0 -0.5 -1 -1.5 -2 -2.5 0 -0.2 -0.4 -0.6 -0.8 -1 -1.2 Ap (kPa) Ap (kPa)Figure 9: (First row) parametric sweeps of pitch and capillary pressure, with h = 25 pm and (a) d =
10 pm and (b) d = 5 pm held constant. he increased with capillary pressure and was higher on average for smaller pitches. (Second row) sweeps over height and capillary pressure, with I = 30 pm and (c) d = 10 pm and (d) d = 5 pm held constant. Taller pillars had a lower he that became increasingly invariant to interface shape. The last point of each curve represents the dryout condition for Orec = 150.
3.2. UNIFORM THERMAL LOAD
Results of the device-level model for a single set of conditions are shown in Figure 10, where d = 10 pm,
1 = 30 pm, h = 25 pm, L = 5 mm, t, = 100 pm, and the ambient was pure water vapor at Tsat = 100 °C. These chip dimensions are standard and the micropillar geometry was shown to be near-optimal for dryout [18] with a large HTC (he > 60 kW/m2K). We prescribed a uniform input heat flux q! = 82 W/cm2, which is the dryout heat flux for the given set of geometry and operating conditions. For simplicity, this micropillar wick was considered to contact the liquid supply only at the two edges normal to the x axis (Figure 3(c)), reducing the distributions to one dimension. Our model was able to resolve the distributions of evaporator (ATe) and source (AT,) superheats (Figure 10(a)), as well as capillary pressure and heat transfer coefficient (Figure 10(b)). While Ap was determined by the finite element solver, h, was calculated directly from Ap
(a) 140 120 100 80 Cl 60 40 d = 5 pm A .V A. =l 252 /P7 v, /d=3 -. .. .-ld = 4 : L/d=5 20 (c) 100 90 80 70 60 -- A,- h/d=2 .... .. h/d = 4 ..hv d =3 a h/d = 5 A` d = 5pm,l= 30 pm A A A" V V0 - -3 a a : • • • • A .A.-" A 50
via the lookup table from the parametric study, thus making this device-level model computationally feasible. Given that heat transfer is enhanced by curvature, he was highest near the center of the device (x/L = 1) where Ap reached a minimum. Under these specific conditions, h, varied by -30% across the
micropillar wick. It follows that the superheat reached a minimum at the center and was the highest at the edge of the wick: in this simulation, we observed a -3 °C difference in surface temperature, meaning that the inlet is more susceptible to boiling. The source and evaporator temperature design criteria can be addressed because the model predicts the maximum temperatures and their locations.
(a) 4 (b) 0 90 13 s -500 85 (3'12 -1000 +-ATe 75 11 -1500 70 c 10 -2000 65 9 -2500 60 0 0.2 0.4 0.6 0.8 1 0 0.2 0.4 0.6 0.8 1 x/L x/L
Figure 10: Device simulation with d = 10
sm,
1 =30 pm, h = 25 pm, L = 5 mm, and q =82 W/cm2in a vapor ambient at Tsat = 100 °C. (a) Distributions of evaporator (AT,) and source (AT,) superheat
when the substrate thickness was 100
sm.
ATe was -3 °C higher at the inlet than the center of thedevice. (b) Capillary pressure and he at position x/L relative to the liquid supply. he was directly calculated from Ap using the parametric study results. For the specified conditions, he varied -30% across the evaporator surface.
3.3. ARBITRARY THERMAL LOAD
Since our model can resolve the distribution of HTC by accounting for local interfacial curvature, it is capable of accurately simulating device performance when the heat load is non-uniform. Although this capability is somewhat limited by the validity of the symmetry argument applied to the unit cell parametric study (see Appendix), it is nevertheless a valuable contribution of our modeling framework. We demonstrate this significance by considering a case where the micropillar wick received a high heat flux (100 W/cm2) at a small "hotspot" while the remainder of the wick received a smaller (50 W/cm2) background flux (Figure 11). We demonstrate our model's ability to distinguish the differences in performance when the hotspot is located at the center of the wick (Figure 1 1(a)) versus next to the liquid inlet (Figure 11(b)).
4500 pm 500 pm (a)
I I
I
I I
I
I I
50 W/cm2 100 W/cm2 500 pm 4500 pm (b)'l''Ill'I
I
100 W/cm2 50 W/cmFigure 11: Schematics depicting the simulated non-uniform thermal loads. A background flux of 50 W/cm2
is applied while a small hotspot receiving 100 W/cm 2 is placed at (a) the center of the micropillar wick and (b) the edge of the wick that contacts the reservoir.
The peak temperatures were lower when the hotspot was located at the center of the wick (Figure 12(a)) than when the hotspot was shifted to the inlet (Figure 12(b)) due to favorable concentration of heat flux where the HTC was highest (as a result of curvature effects). Previous models that only consider upper/lower bounds of the HTC ([26] and [22], respectively) cannot adequately describe device performance under non-uniform heat loads because they cannot capture the dependence on input heat flux distribution, i.e., hotspot location as shown in Figure 12. We quantified the validity of the symmetry argument for the device in Figure 12(a) by calculating that the maximum temperature gradient between adjacent cells was 1% of the local gradient between the evaporator and the vapor ambient.
I
500 pm
4500 pm
(a)14 (b) 4 13 Evapor orSource 12 12 11 11 0 0 10 10 19 <9 8 8 7 7 0 0.2 0.4 0.6 0.8 1 0 0.2 0.4 0.6 0.8 1 x/L x/L
Figure 12: Distributions of superheat obtained from simulations of the same device geometry as the results in Figure 10 with a non-uniform thermal load. (a) Heat load q" = 50 W/cm2
on 0 5 x/L < 0.9 and q" = 100 W/cm2 on 0.9 < x/L 5 1. Unlike Figure 10(a), the maximum temperatures occurred at the center of the wick due to the localized heat flux. (b) Heat load q" = 100 W/cm2
on 0 5 x/L < 0.1 and q" = 50 W/cm2 on 0.1 < x/L 5 1. For the same dimension and strength of the "hotspot," the micropillar wick maintained lower peak temperatures when the hotspot was placed at the center of the wick where the HTC was highest.
Our model can also be used to determine dryout conditions for arbitrary thermal loads. For example, we can calculate the dryout limit for the hotspot in the configurations shown in Figure 11. Maintaining q! =
50 W/cm2 as a background flux, we raised the heat flux supplied to the hotspot (qj ) for each configuration until the dryout condition up = APdy?.out was reached. The model predicts dryout at q = 226 W/cm2 when the hotspot is at the center of the wick and at q = 1842 W/cm2 when the hotspot is shifted to the inlet. We attribute this large difference in dryout heat fluxes to the difference in wicking length to the site of strongest evaporation. When the strongest evaporation occurs at the center of the wick, the capillary replenishing flow has to overcome more viscous loss than for strong evaporation near the inlet. Thus, the dryout condition is met at a lower heat flux for a hotspot at the center of the wick compared to a hotspot of equal strength near the inlet. The comparisons shown in Figure 12 and the dryout analysis demonstrate that the wick's position relative to high flux regions is an additional design consideration. While positioning the wick centered with respect to the hotspot is beneficial from the perspective of the temperature criteria, this configuration is not optimal for dryout heat flux.
The analytical model used by [16], [22], [26] could at best predict the dryout condition for this non-uniform thermal load by simulating the same total heat input as a uniformly distributed heat flux, but this method would not capture the order of magnitude difference in dryout heat flux between configurations as predicted by this present model. The numerical fluidic model used by Zhu et al. [18] could capture this effect but with less accuracy as the flux redistribution due to the distribution of h, is not included in their model. 3.4. SUMMARY
In this chapter, we presented various case studies to highlight the capabilities of our model. We first showed selected results from the parametric study of heat transfer in micropillar unit cells. Here, we observed that