At the interface of materials and objects in
peripheral vision
by
Shaiyan Keshvari
B.S. in Physics and Astronomy
B.A. in Cognitive Sciences
Rice University, 2010
Submitted to the Department of Brain and Cognitive Sciences in partial fulfillment of the requirements for the degree of
DOCTOR OF PHILOSOPHY at the
MASSACHUSETTS INSTITUTE OF TECHNOLOGY
August 2016 et a 1 \
C Massachusetts Institute of Technology 2016. All rights reserved. A4
Signature of Authoi:
Certified by:
Accepted
Signature redacted
__t/v
~Department
of Brain and Cognitive SciencesApril 1 2 th1 2016
Signature redacted
Ruth Rosenholtz Senior Research Scientist rhesis Supervisor
gnature
redacted--Matthew A. Wilson Shej airchild Professor of Neuroscience and Picower Scholar Director of Graduate Education for Brain and Cognitive Sciences
MASSACHSETTS INSTITUTE OF TECHNOLOGY
DEC 20 2015
LIBRARIES
i
X 1At the interface of materials and objects in peripheral vision
byShaiyan Keshvari
Submitted to the Department of Brain and Cognitive Sciences on August 12th, 2016 in partial
fulfillment of the requirements for the degree of DOCTOR OF PHILOSOPHY
Abstract
Humans are able to simultaneously perceive the world as discrete, distinct "objects", as well as regions of statistical regularity, or "textures". This is evident in the way we describe our perceptual world. A street is made up of concrete and asphalt "stuff", while the people and dogs walking on it are the "things" that make use of it. Both of these types of representation, however, are derived from the same sensory input, and thus there must exist transformations that map one to the other. A complete model of perception must account for these transformations. I study the representations that lie at the interface of object and texture perception in vision, focusing on utilizing the intrinsically impaired perception in the periphery to disambiguate the predictions of different models. I find that many seemingly separate perceptual phenomena in crowding can be better understood as different aspects of a single underlying model. I extend this to the study of material perception, and find that considering images of materials as visual textures can explain human's ability to recognize materials in the periphery. Furthermore, I examine how the limitations of peripheral vision affects the perception of visual designs, namely webpages.
Thesis Supervisor: Ruth Rosenholtz
Table of Contents
introduction...10
Pooling of continuous features provides a unifying account of crowding ... 13
2 .1 A b stract... 14
2.2 Intro d uctio n ... 14
2.3 Generating predictions from the Texture Tiling Model (TTM) ... 17
2 .4 Expe rim e nts ... 18
2.4.1 Can a simple substitution model account for crowding? ... 18
2.4.1.1 (Freeman et al., 2012)'s experiments ... 18
2.4.1.2 Stimuli and procedure for generating TTM predictions for (Freeman et al., 2012)'s stim u li...1 8 2.4.1.3 Results of (Freeman et al., 2012) replication... 19
2.4.2 Do different visual features crowd in concert or independently?... 21
2.4.2.1 (Greenwood et al., 2012)'s experiment... 21
2.4.2.2 Stimuli and procedure for generating TTM predictions for (Greenwood et al., 2 0 1 2 )'s stim u li... 2 2 2.4.2.3 Results of (Greenwood et al., 2012) replication ... 23
2.4.3 How does crowding affect feature integration?... 24
2.4.3.1 (P6der & W agemans, 2007)'s experiment... 25
2.4.3.2 Stimuli and procedure for generating TTM predictions for (P6der & Wagemans, 2 0 0 7 )'s stim u li... 2 5 2.4.3.3 Results of (P6der & W agemans, 2007) replication ... 25
2 .5 D iscu ssio n ... 27
Material perception, texture, and peripheral vision ... 30
3 .1 A b stra ct... 3 1 3 .2 Intro d u ctio n ... 3 1 3.3 Baseline and texture experiment methods ... 34
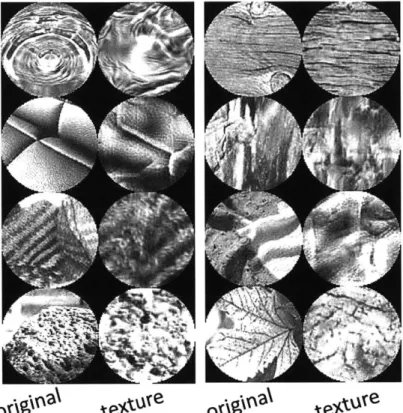
3.3.1 Selecting material images for stimuli... 34
3.3.2 Procedure for synthesis of material textures ... 35
3 .3.3 O bse rve rs ... 36
3.3.4 Experimental apparatus... 36
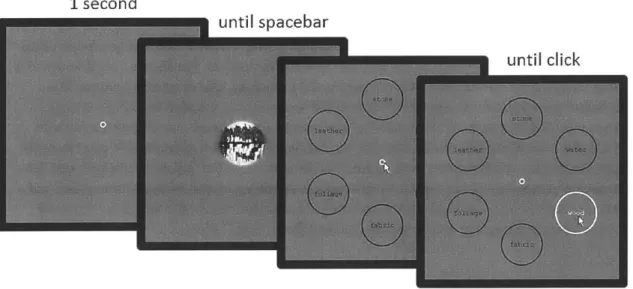
3.3.5 Experimental procedure ... 37
3.3.6 Baseline task ... 37
3.3.7 Texture task ... 38
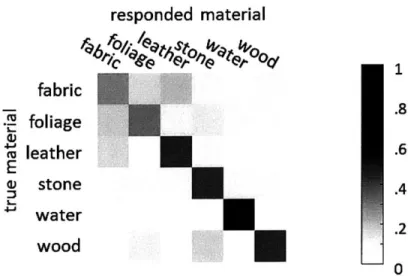
3.3.8 Baseline and texture experim ent results... 38
3.3.8.1 Baseline experim ent results... 39
3.3.8.2 Texture experim ent results... 39
3.3.8.3 Com parison of baseline and texture results... 39
3.4 Interim discussion ... 39
3.5 The relevance of peripheral vision... 40
3.5.1 M ethods for peripheral experim ent ... 41
3.5.2 Peripheral experim ent results ... 41
3.5.2.1 Com parisons between peripheral results and other results ... 41
3.6 Discussion... 43
W eb page gist: w hat can you see in one fixation? ... 46
4.1 Abstract... 47
4.1 Introduction ... 47
4.2 Related work ... 49
4.3 W hat are the web page categories?... 50
4.3.1 Picking the web page categories... 51
4.3.2 Collecting web page screenshots... 51
4.3.3 Getting ground truth categories for screenshots ... 51
4.4 General experim ental procedure... 52
4.4.1 Recruiting participants... 52
4.5 Experim ent 1A: Can observers categorize web pages at a glance?... 53
4.5.1 Procedure...53
4.5.2 Results... 54
4.6 Experim ent 1B: Gist of scram bled w eb pages ... 55
4.6.1 Scram bling web page text... 55
4.6.2 Procedure... 56
4.6.3 Results... 56
4.7 Experim ent 2 - Does this web page have an ad? ... 57
4.7.1 Procedure... 58
4.7.2 Results... 58
4.8.1 Procedure ... 59
4 .8 .2 R e su lts ... 5 9 4 .9 D iscu ssio n ... 6 0 Conclusion ... 61
5.1 General discussion ... 62
5.2 Convolutional neural networks and peripheral vision ... 63
References ... 67
Dedicated to my family and
friends.
You are all I see, foveally and peripherally.Acknowledgments
Ruth, your guidance and friendship has been indispensable to me. When I first saw your bubbly personality and sharp wit at interviews, I knew that yours was an offer I couldn't turn down. You've been the main driver and supporter of my research at MIT, and I wouldn't have had it any other way. Not only have you inspired me to think critically but positively about research, I've learned from you that researchers can be people too. I hope I can pick up even a little bit of the natural charm and confidence that is uniquely yours.
To the Rosenholtz Lab, you've been my second home since I arrived at MIT. I've learned about so much from all of you, from peripheral vision and material classification to cuttlefish camouflage. Much of this work, especially Ali, is directly or indirectly also yours. I also cherish the opportunity I've had to share lunch and office space with Ted's Lab, with whom I've had wonderful times. The McDermott lab from its very beginning has been a fun and welcoming place. I've made some great friends there, and had an unparalleled opportunity to learn all about hearing. Thank you especially John-Elmer Canfield for all the work you do making MIT a great place to be.
Maarten, in addition to introducing me to the field of material perception, you showed me what true scientific passion is; I haven't met another person that can get excited by simply looking at pictures of pieces of fabric.
Josh (McDermott), thank you for introducing me to the world of auditory perception and taking a vested interest in my development, from allowing me assist with your class, teaching me in classes, helping me get a fellowship, and advising my research. I really appreciate the opportunities you've given me and I know they have made a huge impact on my life and career.
Ted, I'll just repeat what I've heard others say about you: He's an amazing person. I won't forget all you've shared with us, from stories youthful hijinks to expert lessons on presenting research clearly. I also appreciate knowing you in a non-academic context, when you invite us over for dinner and creative activities.
Josh (Tenenbaum), you and your lab have been an inspiration to me. I think you are all way too brilliant and kind to be real. I doubt I'll ever be around a group of people as special as you all.
Prior to MIT, I developed my passion for cognitive science and neuroscience by We Ji Ma and
Ronald van den Berg, who continue to be friends and an inspiration for me as I continue my research and career. I look forward to hopefully working again with you in the future.
Friends (in alphabetical order): Affi, Alex, Emily, Galen, George, James, Jiayong, Julian, Karen, Kim, Max, Omer, Praneeth, Zenna (and many more): thank you for the conversations, academic and otherwise, all the nights, food, trips. You are the people that I came to MIT to meet. I'm grateful for the opportunity to call you guys my friends, and you will be the people I will continue to cherish in the future.
Mike Hart, you know why you're in here, for better or for worse. Adam, Nathan, Sunny: thanks for making Boston a little bit more like Texas.
Random Hall and Nina, I'm so grateful for the opportunity to spend four years learning from you in many more ways than a standard PhD program could offer. I've made many good friends, like Phil, Ben, Alison, Nora, and Erons, all of whom I look forward to spending time with as a graduate.
Thirsty Ear Pub, thanks for the opportunity to tackle a project completely different from science, and make friends along the way.
To Sophie, you were worth the wait, so glad my bad jokes finally worked.
To my family, I cannot possibly adequately put in words how important you've been during this intellectually and emotionally challenging part of my life. So, I'll keep it simple: this thesis is for you.
Chapter
1
Introduction
When perceiving the world, our perceptual faculties simultaneously represent both detailed information and general statistical information about the incoming stimuli. We can hear the detailed rhythm of a popular drum solo playing on the car radio, while simultaneously being aware of the background sounds associated with driving on a highway. All at once, we can see the exact outline of a sailboat, with its triangular sail and rounded hull, while noticing the general size of the waves in the bay it is sailing through. Many models have been developed to understand how visual objects (DiCarlo, Zoccolan, & Rust, 2012) are parsed and identified by the brain. On the other hand, models that consider peripheral vision as texture representation (Balas, Nakano, & Rosenholtz, 2009; Freeman & Simoncelli, 2011; Keshvari & Rosenholtz, 2016; Rosenholtz, Huang, & Ehinger, 2012) have also gained ground recently. This divided progress is reflected in computer vision. The state of the art in computer vision algorithms concentrate on determining the identity of objects in an image (Krizhevsky, Sutskever, & Hinton, 2012) or segmenting the objects from an image (Arbel ez, Maire, Fowlkes, & Malik, 2011).
Progress in connecting the levels of representational abstraction has been slow. This is partly because statistical models are only recently becoming computationally tractable and precise, with new techniques for synthesis gaining traction. Foundational work has already been done in trying to understand the limitations in visual object perception as a consequence of statistical representations in the periphery (Balas et al., 2009; Rosenholtz, Huang, & Ehinger, 2012; Rosenholtz, Huang, Raj, Balas, &
Ilie, 2012; Rosenholtz, 2011a). We continue this line of research, specifying the limitations of statistical models while exploring the possibilities of applying it to vision in general.
In particular, we approach the subject through three studies. First, in the spirit of (Balas et al.,
2009), we apply a statistical model' of vision to crowding, a behavioral phenomenon that is traditionally
thought of as a result of difficulty with maintaining accurate object-like representations in the periphery.
By testing whether a single statistical model can explain the main effects in three crowding experiments
with drastically different stimuli, we will help reveal the representation that is relevant for peripheral vision.
Second, we test whether foveal material perception can be explained using a statistical model, and compare the results to peripheral material perception. Humans have the remarkable capability to rapidly detect and identify materials in a visual scene. This ability is crucial to navigating the visual world. For example, the ability to identify frozen regions of the ground is vital to winter trekking, and can lead to painful results if unused. Our understanding of material perception has developed greatly over the last few decades and informed the design of better material recognition algorithms (Fleming, 2014b; Sharan, Liu, Rosenholtz, & Adelson, 2013). While there is a detailed history of using texture to model material perception, most attempts have been unsuccessful (Tomita, Shirai, & Tsuji, 1982), suggesting that texture cannot be a complete model of material perception. We investigate whether a modern statistical model might work better. We also examine material perception in the periphery, as the visual periphery has recently been modeled successfully with statistical texture models.
Third, we investigate peripheral vision in a more applied context, namely visual design. Web pages are particularly interesting examples of design because they can combine elements of natural
' As a technical note, anywhere when we mention "texture" or "mongrel", we refer (unless
otherwise noted) to single pooling region Texture Tiling Model (Balas et al., 2009) syntheses, which is equivalent to Portilla-Simoncelli texture syntheses (Portilla & Simoncelli, 2000).
images (photographs), text, and graphical or style elements (buttons, menus, etc.). The appeal and usability of a webpage depend on how accessible it is visually, which is driven by how well a user can extract information from it at a glance, specifically a single eye fixation. Given a single eye fixation, most of what a user sees on a webpage will fall in the periphery. For this reason, we determined how well observers can assess aspects of a webpage, such as its semantic category, the location of its menu, and the presence of an ad, in the periphery.
These three projects bring us closer to understanding what limitations of peripheral vision are, whether object and material perception can be understood as consequences of forced statistical representations, and how the limitations affect perception of designs.
Chapter
2
Pooling of continuous features provides a unifying account of
crowding
2.1 Abstract
Visual crowding refers to phenomena in which the perception of a peripheral target is strongly affected by nearby flankers. Observers often report seeing the stimuli as "jumbled up", or otherwise confuse the target with the flankers. Theories of visual crowding contend over which aspect of the stimulus gets "confused" in peripheral vision. Attempts to test these theories have led to seemingly conflicting results, with some experiments suggesting that the mechanism underlying crowding operates on unbound features like color, or orientation (Parkes, Lund, Angelucci, Solomon, & Morgan, 2001),
while others suggest it "jumbles up" more complex features, or even objects like letters (Korte, 1923) .
Many of these theories operate on discrete "things" - features of the display items, such as the orientation of each line, or the identity of each item. By contrast, here we examine the predictions of the Texture Tiling Model (TTM), which operates on continuous feature measurements (Balas et al.,
2009), or "stuff". We show that the main effects of three studies from the crowding literature are
consistent with the predictions of TTM. Importantly, TTM is fundamentally different from the existing models; it measures complex statistics "stuff" on image pixels, and does not explicitly encode any segmented information about the "things" in the image. This suggests that many of the stimulus-specific curiosities surrounding crowding are the inherent result of the informativeness of a rich set of image statistics, rather than an amalgam of thing-based phenomena, for the particular tasks.
2.2 Introduction
Colloquially, peripheral vision refers to vision outside of the center of gaze, i.e. outside the
central 1-2 degrees of visual angle known as the fovea2
. Peripheral vision is where you are not looking, i.e. not pointing your eyes. Despite it being markedly worse than central vision, peripheral vision is a key player in many natural tasks, including gaze guidance, object recognition, scene perception, and
navigation (Strasburger, Rentschler, & Jbttner, 2011; Whitney & Levi, 2011).
Peripheral vision has limited acuity and color perception compared with central vision (Anstis,
1998; Strasburger et al., 2011). Whereas these deficits are well studied and significant, they only explain
a small fraction of the difficulty viewers have when performing peripheral tasks. For example, the modest decrease in acuity with eccentricity - distance to the point of fixation - would imply that one could read an entire page of 12 pt text at reading distance without moving one's eyes (Anstis, 1998). The crucial limit to peripheral processing is not lack of acuity, but rather visual crowding.
Crowding refers to empirical phenomena in which observers have difficulty performing a peripheral task, such as identifying or discriminating a target, when that target is surrounded by nearby flankers or is otherwise too complex or cluttered. Traditionally, crowding has often been demonstrated and studied with recognition of a target letter flanked by other letters, but crowding is fundamental to peripheral vision, and not specific to letter stimuli (Pelli & Tillman, 2008). A crowded stimulus often subjectively looks "mixed up", such that the details and exact locations of the stimulus' visual features become difficult to discern. (Lettvin, 1976) described the subjective experience as one in which the stimulus "only seems to have a 'statistical' existence... The loss of spatial order does not involve angles or any other property that we commonly discuss..." This line of thinking has developed into
conceptualization of crowding as "forced texture perception."
What, however, does "forced texture perception" mean? Researchers have answered this question in different ways, analogous to different dominant approaches to modeling texture perception (Rosenholtz, 2014). Whether attempting to predict texture segmentation, discrimination, or
representation, most models of texture perception fall into two broad classes: models that describe 2 Also referred to as the foveola, or rod-free fovea
texture in terms of the features of discrete, pre-segmented texture elements ("things"), and models that describe texture by a rich set of image statistics ("stuff"). As an example of the "things" class of models, some theories of texture segmentation represent texture by a set of discrete features, called textons. Whether segmentation occurs depends on whether two abutting textures contain the same number of attributes, like vertical lines, endstops, closed curves, and arrow junctions (Julesz & Bergen, 1983; Julesz,
1981; Pomerantz & Cragin, 2014). On the other hand, filter-nonlinearity-filter models of texture
segmentation (Landy & Bergen, 1991; Malik & Perona, 1990; Rosenholtz, 2000), as well as texture representations based on image statistics (Heeger & Bergen, 1995; Portilla & Simoncelli, 2000) fall into the class of stuff models of texture perception.
If we characterize crowding models in this fashion, several prominent classes of models are
thing models, operating on discrete features. In averaging models, the visual system is presumed to measure, say, the orientation of each individual item, and encode only a few summary statistics such as the mean and variance (Greenwood, Bex, & Dakin, 2012; Parkes et al., 2001). On the other hand,
substitution models hypothesize that peripheral vision detects discrete things - for example texton-like
features or letter identities - but loses orjurnbles their location information (Pelli, Cavanagh, Desimone, Tjan, & Treisman, 2007; Strasburger et al., 2011; van den Berg, Johnson, Martinez Anton, Schepers, & Cornelissen, 2012; Whitney & Levi, 2011). A key question for both of these classes of discrete-feature models is what are the "textons", the "atoms" of crowding? In other words, what things are averaged? What things are detected before the loss of position information? Are the atoms unbound features, such as the orientation of each display item? Or bound features such as conjunctions of orientation and color? Or object identity, like letters?
The other approach to modeling crowding (and texture perception) essentially says that the primitives of crowding are not "atoms" at all, but rather stuff (Adelson, 2001). This other class of models operates on continuous features, such as the outputs of a cascade of filtering operations and
nonlinearities. For example, a number of researchers have attempted to reason about the implications of a simple pooling model which averages continuous feature measurements over a pooling region. (Levi
& Carney, 2009; Manassi, Herzog, Sayim, & Herzog, 2012; Manassi, Sayim, & Herzog, 2013; Saarela,
Sayim, Westheimer, & Herzog, 2009). However, this simple pooling model, conceived of as pooling within at most a handful of feature bands, has been disproven by a number of experiments (Kooi, Toet, Tripathy, & Levi, 1994; Levi & Carney, 2009; Levi, Klein, & Hariharan, 2002; Livne & Sagi, 2007; Malania, Herzog, & Westheimer, 2007; Manassi et al., 2012, 2013; Nandy & Tjan, 2012; Sayim, Westheimer, & Herzog, 2010; van den Berg, Roerdink, & Cornelissen, 2007), and serves more as a straw man than as a real contender to model crowding. In contrast, our Texture Tiling Model (TTM) represents its inputs with a high-dimensional set of local image statistics (stuff), known to be good for capturing texture
appearance (Balas, 2006; Portilla & Simoncelli, 2000). This model measures correlations of the magnitude of responses of oriented Vi-like wavelets across differences in orientation, neighboring
positions, and scale, and phase correlation across scale, as well as the marginal distribution of luminance and luminance autocorrelation (Rosenholtz, Huang, & Ehinger, 2012; Rosenholtz, Huang, Raj, et al.,
2012). A similar model, measuring the same set of statistics, has been put forward to describe early visual cortex (Freeman & Simoncelli, 2011; Freeman, Ziemba, Heeger, Simoncelli, & Movshon, 2013). We
have previously shown that this model can predict the results of a number of crowding experiments (Balas et al., 2009), among other phenomena (Rosenholtz, Huang, Raj, et al., 2012).
In this study, we examine the results from three different studies, each of which tested
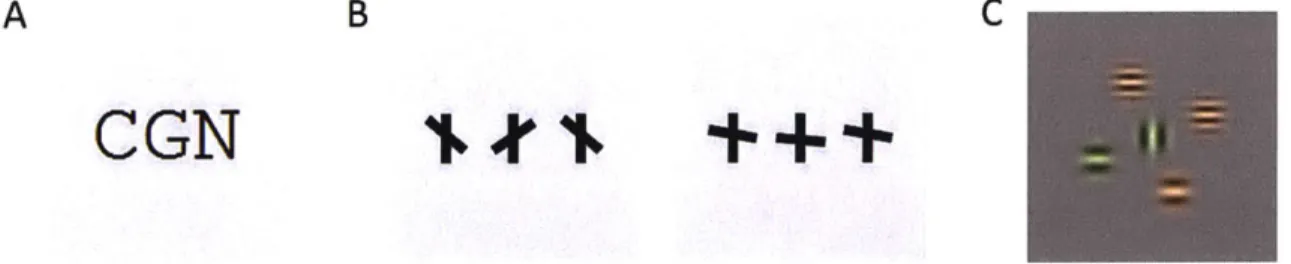
hypotheses about the supposed atoms of crowding - the discrete features upon which the mechanisms of crowding are presumed to act. One study, on letter crowding (Figure 2.1A), indicates that the atoms are not individual letters (Freeman, Chakravarthi, & Pelli, 2012). A study with "T"-like stimuli (Figure
2.1B) suggests that the position and orientation of the cross bar are in some sense bound (Greenwood et al., 2012). A study with Gabor stimuli (Figure 2.1C) indicates imperfect binding between color,
orientation, and spatial frequency (Pbder & Wagemans, 2007). These experiments and their analyses are quite complex; given the differences between the stimuli, it is not obvious which discrete-feature model of crowding could explain the full set of results. On the other hand, a strength of image processing-based, continuous-feature models is their applicability to arbitrary stimuli. We use TTM as our candidate continuous feature model, since it has shown promise on a number of crowding results (Balas et al., 2009; Rosenholtz, Huang, & Ehinger, 2012). We test whether TTM can account for the key results in all three studies. If so, this provides evidence in favor of continuous-feature pooling models of crowding, suggesting that perhaps the primitives of crowding are not atoms after all.
Testing this hypothesis is fairly complex. First, we must make TTM predictions for the previous experiments, essentially running our model through each experiment as a "subject". We describe the methodology for doing this, which involves using human observers, below. We then compare these TTM
A
B
C
CGN++m
Figure 2.1 Example stimulifrom three experiments discussed in this study. (A) Letter-triplet from experiment 1 in (Freeman et al., 2012). Observers viewed peripheral letter triplets and reported the identity of the central letter. (B) In (Greenwood et a/., 2012),
observers reported the relative position and orientation of the central tilted crossbar. For example, the correct response for the first stimulus is "above the midpoint and counterclockwise", while the correct answer for the second is "below the midpoint and
clockwise". In their experiment 4, (Greenwood et al., 2012) vary the angular deviation of the crossbar from the horizontal in order to manipulate the overall probability of crowding. (C) Pdder & Wagemans, (2007) examine how crowding affects feature binding. The observer reported the color (red or green), relative spatialfrequency (high or low), and orientation (horizontal or
vertical) of the central Gabor. Each stimulus randomly had 2, 4, or 6flanking Gabors. The background grey level was different in this experiment than the others.
predictions to the original behavioral results. This alone, however, is insufficient. In each of the three papers described above, the authors fit computational models of various degrees of complexity in order to draw conclusions about the likely atoms of crowding; the authors' conclusions did not follow merely from eyeballing the data, nor from a few simple tests of significance. Here we ask, if TTM were a
"subject" in the experiment, would the authors have come to the same conclusions by fitting its "data" (i.e. its predictions) as they did fitting their own experimental data? Taking this approach allows us to have a better sense of whether our model predicts key features of the data. Note that we are agnostic about both the details of the previous computational models, and about the conclusions drawn from those results. We simply ask whether a crowding mechanism based on pooling of a rich set of
continuous features could have led to the previously observed data and the resulting conclusions. The purpose of this study necessitates that we present a lot of information about the original experiments, the original models, and our attempts to test a unified account of these results. We have done our best to organize the study to make it as clear as possible. First, we describe our standard methodology for generating predictions from TTM. Then, each original study appears in its own section, with four parts, to (1) present the motivation of the original study, (2) describe the experimental
methodology, (3) compare our predictions to the original data, and (4) present the outcome of applying 16
the computational modeling in the original study to the "data" of our model "subject." Each section has a figure with sample stimuli and relevant results. Finally, we discuss the broader consequences of our findings.
2.3 Generating predictions from the Texture Tiling Model (TTM)
To gather predictions of the Texture Tiling Model, we use the same methodology as in our previous work (Balas et al., 2009; Rosenholtz, Huang, & Ehinger, 2012; Rosenholtz, Huang, Raj, et al., 2012; Rosenholtz, 2011a; Zhang, Huang, Yigit-Elliott, & Rosenholtz, 2015). In short: the model represents a stimulus image as vectors of image statistics computed over localized, overlapping sections ("pooling regions") of the image. These measured statistics are then fed into an algorithm that generates a new
image that matches the original image's statistics, but is otherwise random. This methodology allows us to literally see the information encoded by the given set of statistics. The set of images that can be synthesized from a given image (with the same statistics but generated from different random seeds), form the equivalence class of the model. We call these synthesized stimuli "mongrels" (Balas et al.,
2009).
The full version of TTM measures statistics over a number of pooling regions that overlap and tile the entire visual field. It takes hours to synthesize each image. Here we run the local version of the
model, which extracts statistics from only a single pooling region. This reduces to Portilla & Simoncelli
(P-S) texture analysis/synthesis ((Portilla & Simoncelli, 2000), available at
http://www.cns.nyu.edu/~Icv/texture/), applied to stimuli we have blurred to account for reduced peripheral acuity. For stimuli such as those here, which lack larger scale grouping structure and are fairly homogeneous, syntheses of a single pooling region typically appear quite similar to those from the full version of the model.
For color stimuli, we use the color texture synthesis algorithm available at
(http://www.cns.nyu.edu/pub/eero/colorTextureSynth.zip). This algorithm runs principle components analysis on the original color image, and measures statistics on each of the three PCA channels. It synthesizes a new image by iteratively applying P-S texture synthesis to each of the three color bands, enforcing, on each iteration, the correlations between bands corresponding to the eigenvectors of the
PCA. For grayscale images, this reduces to ordinary P-S.
We generate mongrels from image statistics measured on the stimuli in the three original studies. We generate many of these mongrels per condition, and ask observers to perform essentially the same task as in the original study. The observers can view the mongrels for an unlimited time and without restriction of eye movements. Before each experiment, subjects were shown examples of the original stimuli along with their mongrels, and told colloquially how the process of creating the mongrel can mix up locations, features, and legibility of the originals. This procedure attempts to minimize higher level factors in order to test the effect of low-level encoding on complex symbol recognition tasks. See (Geisler & Chou, 1995) and (Zhang et al., 2015), for more discussion. Observer performance on the mongrel task gives us the predictions of TTM for a single pooling region.
The P-S texture analysis/synthesis method assumes that the image wraps around, meaning the top is adjacent to the bottom, and the left adjacent to the right (i.e. periodic boundary conditions). Essentially, it assumes that the image is on a torus. This leads to mongrels in which the "stuff' from the center of the original patch (e.g. the stimulus letters) can be centered on or near one of the edges, rather than the center of the image. This makes doing tasks like "report what letter appeared in the center of the original patch" somewhat tricky for naive subjects, even when told about the wraparound.
uses when unwrapping the torus - we correct for the wraparound by toroidally shifting each mongrel to move the center of mass of the foreground pixels to the center of the image.
2.4 Experiments
2.4.1 Can a simple substitution model account for crowding?
Substitution is undeniably a phenomenon in crowding, in which a subject, asked to report the identity of a target, instead reports one of its flankers. This phenomenon might suggest a mechanism of crowding, which measures features for target and flankers, but either does not encode their location or encodes it in a noisy way (Chung & Legge, 2009; Strasburger & Malania, 2008; van den Berg et al., 2012). This loss of location information would predict substitution of flankers for the target, though it is not the only mechanism that will do so (see (Freeman et al., 2012) and Discussion).
Is crowding due to substitution operating at the level of entire objects like letters - i.e. does the mechanism of crowding identify complete letters, but lose their location? Or does crowding operate on a different level of representation? (Freeman et al., 2012) examined the explanatory power of a simple substitution model at predicting responses in a crowded letter-identification experiment. In simple substitution, the response to a crowded stimulus is determined by independently sampling either the target or a flanker. This means that on a given trial, the response is either: the target, a letter similar to the target, a flanker, or a letter similar to that flanker. Importantly, because simple substitution is only a function of a single letter, any interaction between target and flankers, such as their similarity, does not directly influence the responses.
2.4.1.1 (Freeman et a/., 2012)'s experiments
(Freeman et al., 2012) presented subjects with triplets of letters which were viewed peripherally (Figures Figure 2.2A and Figure 2.2B). The subject's task was to report the identity of the central letter, the "target", disregarding the flankers on either side. (Freeman et al., 2012) based their conclusions
largely on the results in their experiments 1 and 2, and so we address those two experiments here. In experiment 1, letter triplets were chosen such that one flanker was similar to the target and the other was dissimilar. Care was taken in choosing letter triplets to avoid introducing target-flanker correlations. This is necessary partially because observers more easily identify letters at the ends of a crowded array
(Bouma, 1970). If target-flanker correlations were allowed, a subject who identified only the flankers could exploit the correlations to guess the target. A stimulus set was created for each subject such that each letter was used as a target, a similar flanker, and a dissimilar flanker. In experiment 2, an alphabet of two groups of three letters each (LTI, MNW) was used for all subjects. Within each group, the letters are similar, but between groups, they are dissimilar. The flankers were identical to each other in the second experiment, and both the target and flanker identities were chosen randomly on each trial.
(Freeman et al., 2012) proposed that a key prediction of simple substitution is that subjects will report a similar flanker just as often as a dissimilar flanker. They find that this null hypothesis does not hold, and conclude that simple substitution cannot account for letter-identification performance under crowding. A recent paper (Hanus & Vul, 2013), however, argues that simple substitution with letter confusions can account for increased similar flanker reports based their own modeling of the impact of individual letter confusability. We remain largely agnostic to the specifics of the models discussed in those two studies, and focus on the phenomena of similar vs. dissimilar flanker reports (see also
(Bernard & Chung, 2011)).
2.4.1.2 Stimuli and procedurefor generating TTM predictions for (Freeman et a., 2012)'s stimuli
We tested 5 subjects in our reproduction of experiment 1 from (Freeman et al., 2012) Four were experienced observers in other mongrel experiments, and all were naive as to the design of the
experiments. (Three were lab members, and thus may not have been completely nafve as to the purpose of the experiments.) We tested 4 experienced psychophysical observers in experiment 2. Two of these observers were naive to the purposes of the experiment, one of who also participated in experiment 1. Of the two remaining observers, one was an author.
Using P-S synthesis, we generated mongrels of the letter triplet stimuli in (Freeman et al., 2012) (Figures Figure 2.2A and Figure 2.2B). Prior to their first main experiment, (Freeman et al., 2012) measured the confusion matrix for each observer between uncrowded peripheral letters with added
noise. The confusion matrix was used to design a set of stimuli in experiment
1
for each observer, suchthat each letter in the alphabet was associated with a similar and dissimilar letter, resulting in a unique letter triplet of a target, a similar flanker, and a dissimilar flanker. Rather than carry out this procedure for each subject, we used the stimuli generated for their first observer, J.F., for all observers in the
mongrel task. Given the success of observer-independent letter-confusion modeling (Watson & Fitzhugh, 1989), it is reasonable to assume that letter confusion matrices do not differ greatly in structure between observers, an assumption verified by (Hanus & Vul, 2013). We will show that we (similarly to (Hanus & Vul, 2013)) can nonetheless distinguish between simple substitution and pooling models. For each of the original 52 stimuli (each letter of the alphabet appears with equal frequency as the target, and the similar flanker can appear first or last in the triplet), we generated 10 unique
mongrels, i.e. 10 members from the equivalence class of the original stimuli, according to TTM. This gave us a total of 520 trials per observer. Letter size and spacing were matched to the original experiment as closely as possible. Trial order was randomized for each subject.
To generate predictions for their second experiment, we generated letter triplets out of two groups of three letters, as in (Freeman et al., 2012). Enumerating all possible combinations produces 36 unique triplets. We generated 10 mongrels for each triplet. Stimulus order was randomized for each subject.
In both experiments, instead of instructing the subjects to name a single target letter in the center of the mongrel image, we required subjects to enter three letters, and used the second letter as the response. We did this to facilitate performing possible additional analyses of the responses - e.g. how errors in flanker reports relate to target errors; as such analyses are not relevant to the present study we do not present them here. For experiment 1, subjects were informed that in the original patch all letters occurred with equal frequency in all three locations, and that each mongrel represented a triplet of three unique letters. For experiment 2, they were told the 6 possible letters (examples of which were shown on the screen at all times) and told that the flankers would always be identical. Any trials in which subjects did not report identical flankers were discarded (1.39% of trials). Response time was unlimited and subjects received no feedback.
2.4.1.3 Results of (Freeman et al., 2012) replication
2.4.1.3.1 Data analysis
In experiment 1, trials in which subjects mistakenly reported too many letters, too few letters, or repeated letters were discarded (0.62% of all trials). Subjects reported the correct letter on 24.9 1.1% (M Sf) of trials, which is well above chance (1/26, or 3.85%), p <lE-10. This is noteworthy because unlike simple substitution, the TTM model does not explicitly encode information about letter identity; pooled image statistics are sufficient to support identification of letters. Subjects reported the similar flanker on 13.8 .4% of trials and the dissimilar flanker on 8.4 1.6% of trials (Figure 2.2C). The two types of flankers are not reported equally (p < 1E-5, two-sided permutation test), consistent with what (Freeman et al., 2012) observed in their first experiment. This result was also significant for four of the five subjects individually (p <0.035, p = 0.12 for the fifth, two sided permutation test).
In experiment 2, subjects reported flankers more often when they were similar (26.8 3.8%) to the target than when they were dissimilar (14.4 2.1%) (Figure 2.2D). This trend is highly significant (p <
1E-5, two-sided permutation test) This difference in flanker reports is qualitatively if not quantitatively
similar to the results from (Freeman et al., 2012), who found that flankers were reported 60 6% of the time on similar-flanker trials and 24 1% on dissimilar-flanker trials. Subjects in the mongrel experiment had higher overall reports of absent letters than in the (Freeman et al., 2012) study. In short, we find that in both experiments 1 and 2, similar flankers are reported more often than to be expected by a pure substitution model, and thus our data support the notion that simple substitution is not a complete account of crowding.
SXA
LWL
:
I
-Expt 1: original data
Sim. flanker Dissim. flanker Expt 2: original data
Sim. trials Dissim. trials
Expt IA: m 28 20 15 10 5 0 60 80 40 30 20 10 0
U
Sim. flanker Expt 1B: mFigure 2.2 (A) Example stimulus from experiment 1 in (Freeman et al., 2012), with two mongrels to its right used in our Experiment 1A. Mongrels are generated by
iteratively enforcing image statistics on a
random noise seed. Subjects were asked to
report what three letters they believed the mongrel was generated from, free-viewing with no time limit. Notice that the mongrels show effects of substitution (swapping of letter positions), as well as complex interactions between letters. In agreement
;~V.719 with (Freeman et al., 2012), the flanker ("A") more similar to the target ("X") tends to be reproduced more faithfully in the mongrels than the dissimilar ("S") flanker. (B) Original and mongrels for (Freeman et al., 2012)'s
Dngrel data experiment 2 (mongrels in our Experiment
1B). Interestingly, the letter "I" seems to appear in the mongrels, despite being absent in the original. (C) Subject reports of the similar flanker (first bar) compared to the dissimilar flanker (second bar), averaged across subjects, for both (left) (Freeman et al., 2012) and (right) our Experiment 1A.
Notice that in both studies, subjects reported the similar flanker significantly
Dissim. flanker more often than the dissimilar (asterisk indicates p <1E-5, two-sided permutation ongrel data test). (D) How often subjects mistakenly
reported one of the identicalflankers when they were similar (first bar) to or dissimilar (second bar) to the target, for both (left) (Freeman et al., 2012)'s experiment 2 and (right) our Experiment 1B.
Sim. trials Dissim. trials 2.4.1.3.2 Applying (Freeman et al., 2012)'s models to TTM predictions
(Freeman et al., 2012) interpreted their first experiment as showing that simple flanker-substitution (where responses are based on, but not necessarily identical to, a flanker chosen at random) cannot account for letter-similarity effects in crowding, which is consistent with our results. Moreover, using their mixture modeling technique, we determined that flanker substitution could at
20
A
B
C
0. CLD
0 CL W 1, 11. 11 i- , Wq = W .1- - _. . t JW =111 - :_ LL,11 . , ,-\
L Bmost account for 72% of responses in our mongrel experiment, compared to the 55% found by (Freeman et al. 2012).
Similarly, using the mixture model from their experiment 2, we found simple substitution to account for at most 84% of trials. These results, taken together, suggest that substitution cannot be a full account of crowding. While our percentages attributable to substitution are higher than that found in the original study, it is important to keep in mind that the mixture model maximizes the role of substitution in fitting the data; only trials in which it is impossible for substitution to explain are attributed to pooling. We still reach the same conclusion about simple substitution; in other words, if our model was a subject in their experiment, they would have drawn qualitatively the same conclusions (if quantitatively different) as they did when looking at actual behavioral data.
2.4.2 Do different visual features crowd in concert or independently?
If the atoms of crowding are not whole letters, as discussed in the previous subsection, what aspects of the stimuli are encoded prior to crowding, i.e. loss of location information or computation of summary statistics? (Greenwood et al., 2012) designed a set of experiments to determine which visual processing stage is responsible for crowding. One natural question to ask is whether different features of a stimulus, say position and orientation, are treated independently or "bound" together when crowding occurs. In a substitution-style model, in which some amount of recognition occurs (bars vs. corners vs. shapes and so on) prior to loss of position information, more binding implies that crowding operates at a later stage. Similarly, some models suggest that features of discrete items are identified and then averaged, producing crowding. The complexity of the feature measured and then averaged may suggest something about the stage at which crowding occurs. Thus, for both substitution and averaging classes of models, how much binding occurs gets at the important question of where in visual
processing the mechanisms of crowding operate. One should note, however, that for models measuring image statistics rather than features of discrete items, the connection between amount of binding and stage of visual processing is not as straightforward. As we will see in our mongrels, a rich set of image statistics can capture a fair amount of information about feature binding even when that information is
not explicitly encoded, much as the statistics capture some information about letter identity without explicit encoding of said identity.
(Greenwood et al., 2012) fit two models to their data. In both, crowding (i.e. averaging)
mechanisms either operate on a given trial or they do not, in a way that depends probabilistically on the stimulus. In one model, this "gating" occurred for position and orientation features independently. In the other, whether or not orientation crowded also gated whether position crowded. They found that the latter model in which one gate controlled crowding for both features better fit the data. This result
led them to the conclusion that binding of features occurs prior to the mechanisms of crowding. Here we compare the fits of their two models to our mongrel data, and ask whether TTM would have led to the same conclusion.
2.4.2.1 (Greenwood et a/., 2012)'s experiment
(Greenwood et al., 2012) presented triplets of cross-like symbols in subjects' periphery in their experiment 4 (Figure 2.3A and Figure 2.3B). On each trial, one cross-like target was flanked by two other cross-like symbols, and subjects were to report the relative position and orientation of the target crossbar (above or below the midline? tilted clockwise or counterclockwise?). In some conditions, the orientation of the target and flanker were close to zero, thus inducing "strong crowding" ( 10*) (Figure 2.3A). In other conditions, it was very different from zero, thus inducing only "weak crowding" ( 40*) (Figure 2.3B). The strength of crowding as a function of orientation difference between target and flanker was determined separately in their experiment 1. By changing the level of orientation crowding
independently of position crowding, (Greenwood et al., 2012) argue that they can test whether crowding in one dimension induces it in the other, or whether they "crowd" independently. (In what follows, strong and weak crowding refer to experimental conditions, not performance.)
A
B
,or *
r
Both-match 100 801. 60 40 20 100 400 Orientation-differs 100801
201 0D
Position-differs 80 60 40 20 'F
100 400 Both-differFigure 2.3 (A) (left) An example stimulus from (Greenwood et al., 2012) displaying "strong crowding" and a difference in both position and
orientation between target and flankers (both-differ condition). Orientations of the target and
flankers (target at 5, flankers at -10*) are
relatively close to zero. The correct response to the orientation and position (relative to the vertical bar's midpoint) of the center crossbar in this case would be "clockwise and below". (right) Two of the corresponding mongrels. Notice that the orientation of the center object becomes ambiguous in the left mongrel, and swaps with a flanker in the right mongrel. (B) (left) Example from the "weak crowding" condition for which both position and orientation differ. Correct response to these stimuli would also be "clockwise and below". The orientation difference between target and flankers is large here (target at 35', flankers at -40*). (C) - (F) The average data over four subjects (bars) along with averaged modelfits (circles and triangles). Each subplot corresponds to a particular relationship between target and flankers, just as in (Greenwood et al., 2012). The different colors are different types of responses
the subjects made. Within each plot, the bars are grouped according to the orientation of the
target. Notice that subjects tend to make position errors when the target and flankers differ in position (D). They make orientation
errors only when orientation is different (E) by a small amount ( 10*, strong crowding) but not
when orientation differs greatly ( 40', weak crowding). In the case where both position and orientation differ (F), subjects tend to make errors in both features under strong crowding. When crowding is weak, though, subjects get both features correct most often. The model fits in the last plot (F) show that the independent model (solid triangles) predicts more position errors than the data show. The joint model (white circles), however, correctly predicts a greater number of correct responses than position errors in this case.
2.4.2.2 Stimuli and procedure for generating TTM predictions for (Greenwood et al., 2012)'s stimuli
We tested 4 subjects, all experienced psychophysical observers. All subjects had prior
experience viewing mongrels. One was an author and one was naive to both the design and purpose of the experiments. The other two were lab members, and naive as to the design but perhaps not the
broad purpose of the experiment. Because this task was quite unnatural and difficult, we used observers experienced with mongrels in order to focus on difficulty due only to information loss by the model. For each of the 32 original stimuli in experiment 4 from (Greenwood et al., 2012), we generated 20 synthetic
22
C
6) C 0 C U) MtE
60 C 0~40
100 80 0 A ' A CL40 0 20 A 100 400 100 400~ ~ Both correct Position error
Orient. error Both error
_A Independent model o Joint model
--- I
mongrel images (Figure 2.3A and Figure 2.3B for example), for a total of 640 trials per subject. Subjects in the mongrel experiment were asked to do their best to infer from the appearance of the mongrel the orientation and position of the target crossbar in the original stimulus (from which the mongrel was derived). Subjects were shown examples of original stimuli, told how those original stimuli were generated, e.g. that the irrelevant "flankers" were always identical to each other. They were also told that when stimuli are synthesized, the objects can switch positions, flip, etc. Subjects had unlimited viewing time to respond as to the orientation and position of the target crossbar by selecting one of four possible responses. To match the conditions in (Greenwood et al., 2012), trials were split into blocks of 320 trials each. Each block had trials with either strong (difficult) or weak (easier) crowding. The order of blocks was counterbalanced between subjects, and subjects received no feedback.
2.4.2.3 Results of (Greenwood et al., 2012) replication
2.4.2.3.1 Data Analysis
As in (Greenwood et al., 2012), we separate the data into four categories which correspond to the relationship between the target and flankers: both-match, position-differs, orientation-differs, and both-differ (Figure 2.3C through F). In each of these categories, when crowding occurs (leading to weighted averaging a la (Greenwood et al., 2012)), the observer will be more likely to report the value of a flanker's features. According to this model, in the both-match condition, averaging target and flanker
responses would still lead to a correct response; e.g. the average of three positions above the midline is above the midline. We find that our subjects are most likely to be correct in both features, regardless of crowding level (Figure 2.3C). In the position-differs case, the predominant responses in our data are
position errors (also regardless of crowding level), although not much more frequent than correct responses. This suggests that while position judgments were crowded, if "gating" occurred a la
(Greenwood et al., 2012), it would operate on around or slightly less than 50% of trials (Figure 2.3C). In the orientation-differs case, the results are more complex. In the strong crowding sub-case, observers
most commonly responded with an orientation error and to a lesser extent (but not significantly less) they responded correctly, suggesting 50% or more of trials were crowded in orientation. In the weak
crowding case, however, orientation errors dropped to nearly zero, and the most common response was to be correct (Figure 2.3D). This is not surprising, as (Greenwood et al., 2012) designed the weak
crowding condition with large tilts to preclude orientation errors.
Importantly, according to (Greenwood et al., 2012), the key set of trials consists of those in which both the position and orientation differ between target and flankers (both-differ, Figure 2.3F). In the case of strong crowding, their subjects most commonly made mistakes in both position and orientation. When crowding is "released" in the weak crowding condition, however, the dominant response in their experiment was to be correct in both position and orientation. This effect is also prominent in our results.
To be specific: when crowding is "released" by increasing the difference in orientation between target and flankers, subjects have fewer orientation and position errors. This can be shown by
computing the proportion of correct responses expected if releasing crowding only affected orientation judgments, and comparing it to the actual proportion of correct responses. If releasing crowding only
affected orientation judgments, the proportion of correct responses in the weak crowding case should be equal to the number of correct responses with strong crowding, plus the number of orientation errors with strong crowding, minus the number of orientation errors with weak crowding. If the actual number is higher, then releasing crowding in orientation also releases crowding in position, supporting (Greenwood et al., 2012)'s "joint" model of crowding. If the expected and actual proportions are the same, then an independent model of crowding, where position and orientation don't interact, cannot be ruled out. We find that in three of four subjects individually, the proportion of correct responses is 22.5
3.8% higher than expected if weak orientation crowding only affected orientation judgments (p < 0.025, two-sided permutation test for each subject), and higher (6.25%) but not significant for the fourth
subject (p = 0.4581, two-sided permutation test for one subject). This is the same trend observed by (Greenwood et al., 2012).
2.4.2.3.2 Applying (Greenwood et al., 2012)'s models to TTM predictions
In order to interpret their results, (Greenwood et al., 2012) fit two models to their data. The models were similar in that both assume (1) noisy encoding of position and orientation, (2) a mechanism that "gates" orientation crowding on or off with a probability that depends on how close the target and flanker orientations are, and (3) the effect of crowding is modeled as a mechanism that takes a weighted average of the target and flanker features. The models differ in that one model (the "independent model") has a separate parameter for the probability gating on or off position crowding, while the other (the "joint model") posits that crowding in position happens if and only if crowding in orientation happens on a given trial. For a schematic of these models, see Figure 6A in (Greenwood et al., 2012). (Greenwood et al., 2012) argue that if the joint model does similarly (given that it has one fewer free parameter) or better in explaining the data, this implies that crowding in position is tied to crowding in orientation, i.e. that crowding happens after the "binding" of position and orientation.
We fit these two models to our mongrel data and compare the fits. Because we had difficulty converging to a good fit using the models and data from (Greenwood et al., 2012), we made one minor change in both of the models. Specifically, we used the thresholds determined from their experiment 3 to set the standard deviation of position noise in their model (their equation A4). This was done to keep parameter estimates at intermediate values and help the error minimization converge more quickly. Importantly, this component of the modeling is identical for both models, and occurs before the "binding" step, so it should not affect the ability to distinguish the models.
We fit both models to each of our subjects individually and found that for each subject the independent model, i.e. the model in which crowding happens independently for orientation and position, fit worse than the joint model. The root mean squared error (RMSE) of the independent model was 1.71 1.1 percentage points worse than the joint model. The joint model fits the mongrel data better for each subject individually and overall. Compare this to the fits in (Greenwood et al., 2012), where they find RMS errors of 6.29 for the independent model, and 3.78 for the joint model, a
difference of 2.51 .0012. The joint model also fits their data better. Given the difference between the fits of the independent and joint models, our data also supports the conclusion that orientation and position are bound prior to crowding.
2.4.3 How does crowding affect feature integration?
(P~der & Wagemans, 2007) also study to what degree feature binding survives crowding. They ask whether fully bound items are mixed up by crowding (high level substitution), whether the "mixing" happens in each feature band separately, or something in between. By analyzing feature errors and fitting models to the subject responses, they conclude that the level at which crowding occurs is neither extreme, but includes partially bound features. For example, the authors found a correlation between the number of flankers with a particular feature value and the number of times that feature value was erroneously reported. This correlation, however, was not perfect, suggesting some binding of the target features. Additionally, they argue that a Feature Integration Theory (FIT)-style model in which features bind probabilistically within a spotlight of attention fits the data very well, despite having only two free parameters.
We used the method described by (P5der & Wagemans, 2007) to generate stimuli, which we then used to generate mongrels. Subjects viewed the mongrels and did the same task as in the original
experiment. As in the previous sections, we use the same analysis and modeling on our data to test whether we would arrive at the same conclusions about feature binding in crowding.
2.4.3.1 (Pdder & Wagemans, 2007)'s experiment
Using Gabor patches as stimuli, (Pbder & Wagemans, 2007) tested the effect of flankers on an identification task in which the observer must report three features of the target. Each Gabor patch had three orthogonal properties: color (red or green), orientation (vertical or horizontal), and spatial frequency (high or low). The target was selected randomly from the 8 possibilities (2 x 2 x 2). The target was flanked by 2, 4, or 6 Gabors, randomly chosen on each trial. The flankers' features were randomly chosen such that no flanker was identical to the target. The flankers were placed around the target, with their centers regularly spaced on a notional circle of radius 0.8 deg (Figure 2.4A and Figure 2.4B). On each trial, the array of Gabors was briefly displayed peripherally and subjects indicated the target
identity by selecting one of 8 possible responses.
2.4.3.2 Stimuli and procedure for generating TTM predictions for (Pbder & Wagemans, 2007)'s stimuli
Four subjects participated in our experiment. One was an author, two had significant experience with mongrels, and the fourth had a small amount of experience with mongrels. All subjects except the
author were naive to the purposes of the experiment. All properties of the stimuli were chosen to match those of the original study. The subjects were instructed to respond as to what they thought were likely the features of the central target in the original stimulus. Subjects responded by choosing one Gabor
patch of the 8 possibilities displayed at the bottom of the screen and received feedback on each trial.
2.4.3.3 Results of (Pdder & Wagemons, 2007) replication
2.4.3.3.1 Data Analysis
In their analysis, (Pbder & Wagemans, 2007) organize the data in several different ways to make sense of the phenomena. First, they note that for all subjects, performance decreases with increasing number of distractors. They also plot the predictions of a random selection model, where the subject randomly reports one of the Gabors in a given stimulus (essentially losing all position information). This random selection model predicts the same trend but severely underestimates actual performance. Our data (for individual subjects and on average) also show both this decline in performance with increasing number of distractors and better performance than predicted by random selection. This means that while TTM's representation loses information about the stimulus, it does preserve some spatial configuration information. One can directly observe this in the mongrels (Figure 2.4A).
Another important finding reported by (Pbder & Wagemans, 2007) is that subjects' probability of responding with a particular distractor is proportional to the prevalence of that particular distractor in a given display. They attempt to discriminate between two mechanisms that might drive this
performance: random selection (mentioned previously), or misbinding, where the subject reports a combination of features randomly chosen from those present in the stimulus. They show that the probability of reporting a flanker is proportional to how prevalent that flanker is in a particular stimulus. However, the proportionality is less than 1, indicating that at least some responses are not due to random selection. Likewise, they provide evidence for misbinding by showing that increasing the number of times a particular feature value appears among the flankers increases the likelihood of it being reported. For example, having more green flankers in the display leads to a higher probability of subjects reporting a green target. We find strong evidence that TTM produces both of these effects (Figure 2.4C and Figure 2.4D).