Atomistic Simulations of Radiation Damage in
Amorphous Metal Alloys
by
Richard E. Baumer
B.S.E., LeTourneau University (2008)
Submitted to the Department of Materials Science and Engineering
in partial fulfillment of the requirements for the degree of
Doctor of Philosophy
at the
MASSACHUSETTS INSTITUTE OF TECHNOLOGY
A
ACHNE0"
1MASSACHUSETTS
IdWME, OF TECHNOLOGYMAY
14
2014
_-LIBRARIES
September 2013
0 Massachusetts Institute of Technology 2013. All rights reserved.
Author... ... . Department of Materials
Certified by ... ...
Science and Engineering August 6, 2013
Michael J. Demkowicz Assistant Professor of Materials Science and Engineering Thesis Supervisor
Accepted by ... ..... _._.
erbrand Ceder Chair, Department Committee on Graduate Students
Atomistic Simulations of Radiation Damage in
Amorphous Metal Alloys
by
Richard E. Baumer
Submitted to the Department of Materials Science and Engineering on August 6, 2013, in partial fulfillment of the requirements
for the degree of Doctor of Philosophy in Materials Science and Engineering
Abstract
While numerous fundamental studies have characterized the atomic-level radiation response mechanisms in irradiated crystalline alloys, comparatively little is known regarding the mechanisms of radiation damage in amorphous alloys. Knowledge of collision cascade dynamics is lacking, both with respect to the possibility of sub-cascade formation and concerning the types of damage created in individual cascades. This Thesis resolves these knowledge gaps through a systematic simulation study of the radiation response of amorphous metal alloys.
Using a molecular dynamics simulation of /2 MeV ion irradiation in a realistic 2 billion-atom molecular dynamics simulation in amorphous Cu5oNb5o, I show that radiation creates isolated nanometer-scale zones with rapidly quenching liquids. Quenched liquids reach large pressures and emit stress pulses that trigger polarized plastic deformation in adjacent material.
In order to identify liquid zones in irradiated amorphous Cu5oNb5o, I use molecular
dynamics simulations to characterize the properties and glass transition temperature of uniform liquid Cu-Nb alloys. I show that radiation-induced liquid zones rapidly quench to material with the same properties as a uniform liquid quenched at an equivalent quench rate approaching 1014 K/s. These "super-quenched zones" (SQZs) are approximately 10 nm in diameter and provide a mechanistic explanation for radiation-induced swelling and ductilization in metallic glasses.
The identification of plasticity adjacent to SQZs is an unexpected damage mechanism that could prove a limiting factor for the application of amorphous alloys in radiation environments. To aid selection of amorphous alloys with resistance to collision-induced plasticity, I formulate a micro-mechanical model for collision-induced plasticity in irradiated metallic glasses. The analytical model successfully ranks the damage-resistance of irradiated
Cu-Nb alloys and should enable selection of amorphous alloys with optimized radiation tolerance.
Finally, through characterization of quenched Cu5oNb5o, I reveal that glass transition in
Cu5oNb5o occurs by gelation due to formation of a mechanically stiff, percolating network of
atoms with icosahedral local packing at the interfaces between compositionally enriched regions. These features of glass transition are similar to gelation processes in polymeric and colloidal gels and suggest new approaches for understanding glass transition in bulk metallic glasses.
Thesis Supervisor: Michael J. Demkowicz
Acknowledgments
First, I wish to acknowledge and thank my PhD Thesis advisor, Michael Demkowicz, for his patient, thoughtful guidance as I have grown from a welding engineer to a computational materials scientist. It has been a slow, at times painful, journey, fraught with more wrong turns than right, and I am forever grateful for his clear direction and encouragement.
A variety of individuals have contributed to this research. I thank my Thesis
Committee-Jeff Grossman, Chris Schuh, and Frans Spaepen-for their guidance and support throughout my Thesis research. I thank Vasily Bulatov and Tomas Oppelstrup for welcoming me during the Summer of 2010 at Lawrence Livermore National Laboratory. I am grateful to both Vasily and Tomas for useful discussions and assistance with the grant application for computing resources on uBGL. Tomas, thank you for getting me up and running on uBGL and for assistance with parallelizing my analysis code. I thank Professor Van Vliet for useful comments on my characterization of the glass transition in Cu5oNb5o and Felice Frenkel for discussions on visualization. I thank J. Ziegler for providing a version of SRIM modified to exclude electronic
stopping. It was critical to designing the radiation damage simulations.
The material in this Thesis is based primarily upon financial support through a National Science Foundation Graduate Research Fellowship under primary Grant No. 1122374. I also gratefully acknowledge two Departmental Fellowships-the Salapatas Fellowship and John F. Elliott Fellowship-for support during my first year at MIT. Thank you, Mrs. Elliott, for your generosity and encouragement. I acknowledge support through a DuPont/MIT Alliance Fellowship, as well as funding support by the DoE Office of Nuclear Energy, Nuclear Energy Enabling Technologies, Reactor Materials program, contract DE-NE0000533. The computations were performed at Lawrence Livermore National Laboratory through a LLNL 5th Institutional Unclassified Grand Challenge Computing Allocation.
I thank my undergraduate research mentors who guided me towards graduate school and
the study of computational materials science. I thank my undergraduate advisor, Professor Warke, for introducing me to computational materials science and for giving me my first research project in materials modeling. I thank Professor Adonyi for giving me welding research experience. I thank Professor Ayers and Professor Gonzalez for giving me the opportunity to work on the LEGS Project. Finally, I thank Professor Daraio for giving me the chance to work in her lab during the summer of 2007. That research experience confirmed my decision to apply to graduate school.
On a more personal level, I am grateful for the support and feedback of all the members of the Demkowicz Group. In particular, I thank Kedar Kolluri and Abishek Kashinath. Kedar, thank you for many conversations, both technical and personal. Your mentorship helped me to develop into a productive researcher, and your friendship was a bright spot during my first two, often difficult, years at MIT and continues to be a valued source of encouragement to this day. Abishek, thank you for many discussions at the whiteboard. When I was stumped, you often were my sounding board that kept me on the right track.
The courses and qualifying exams at MIT were challenging and took me to the breaking point. I made it this far only through the support and help of numerous individuals. I am grateful for the friendship and support of my first-year study group-Ahmed Al-Obeidi, Satoru Emori, and James Paramore. I would never have passed the core classes or our written quals without your friendship, camaraderie, and help. I am indebted to my first-year TAs, particularly Charles Moore, Jeremy Mason, and Gilbert Nessim. You each listened patiently when I was confused
and clarified concepts difficult for me to grasp. Many thanks to all my classmates who helped me prepare for the oral qualifying exam-Tracey Brommer, Matt Connors, Abishek Kashinath, Heather Murdoch, and Alexis Turjman-and the older students who practiced with me-Eric Homer and Tim Rupert.
Toiling away in the basement at MIT can make for a lonely existence, but a few people brought levity on a nearly daily basis. To my basement compatriots-Uwe Bauer, Satoru Emori, and Liz Rapoport-and by extension-Ahmed Al-Obeidi and Charles Sing-thank you for making me smile and convincing me to open the office window blinds!
My MIT experience was greatly enriched through a few courses at Sloan. I am grateful to a
few specific MBA students who warmly welcomed me into their world-Ari Oxman, Jonathan Bloom, Shanshan Gong, and Dameng Yue. Ari, I am particularly grateful for the opportunity to work with you on the MIT $1 00k Entrepreneurship Competition.
I thank Professor Gibson for giving me the opportunity to work as her TA in 3.032.
Thank you for accommodating my busy travel schedule and providing an inspiring example in the classroom. I learned much and enjoyed working with you. To my fellow TA, Alan Lai, thank you for your teamwork throughout the semester. It was a pleasure working with you.
I thank my wonderful friends at Christ the King Presbyterian Church in Cambridge who
welcomed my wife and me to Boston and made us feel at home. So many have encouraged, counseled, and prayed for us throughout this process. I thank those fellow PhD students-Sean O'Hern, Anthony Wong, and Rachel Liao-for perspective. I thank those who already obtained their PhDs-Ryan Shenvi, Derek Chang, and Erik Baldwin-for encouragement. I thank Ambrose and Gi Huang for welcoming us into their lives. Ambrose, thanks for all the long runs together. I thank John and Rachel Churchill for their friendship. Churchills, we should vacation together again! Laura and Aaron Winn, I am already missing our super club adventures. Sean and Nicole O'Hern, thank you for your friendship and encouragement. I miss our weekly community group. Anthony and Emily Wong, thank you for your support. Anthony, I am grateful for our weekly coffee outings.
I thank my wonderful family for their support. Mom and Dad, thanks for encouraging
me, praying for me, and listening to me throughout my undergraduate and graduate studies. It has been a long journey and you have been there every step of the way. Thanks to my sisters for always thinking what I was doing was "amazing" even when I didn't feel that way. I thank my mother and father-in-law for their support, for their prayers, and for trying to understand what I have spent the last five years studying. Mrs. Callaway, I am forever grateful that you spent the past two months with us so I could focus on finishing my PhD. This could not have happened without your help.
Finally, I thank my wonderful wife, Jordan, for her unwavering support. When I got sidetracked, you pointed me in the right direction. When I was discouraged and depressed, you listened, encouraged me, and told me to go for a run. Thanks for making time, in the midst of pursuing your own career, to support me. Any success that I have achieved is a direct result of your sacrifices. Your courage and perseverance as you have cared for our son has inspired me in the final push. I love you.
Table of Contents
S
Introduction t... 191.1 Fundamental radiation response mechanisms in crystalline metals ... 19
1.2 Knowledge gaps-the radiation response of metallic glasses ... 21
1.3 Thesis outline ... 22
2 Review of m etallic glasses and their radiation response ... 23
2.1 Introduction to glasses ... 23
2.1.1 G lass transition ... 23
2.2 Overview of m etallic glasses ... 25
2.2.1 Synthesis... 25
2.2.2 Structure... 26
2.2.3 M echanical properties... 28
2.3 Radiation response of m etallic glasses: Experim ents ... 29
2.3.1 Radiation-induced sw elling ... 29 2.3.2 Radiation-enhanced ductility ... 30 2.3.3 Radiation-enhanced diffusion... 31 2.3.4 Ion-induced plasticity ... 31 2.3.5 Radiation-induced crystallization... 32 2.3.6 Sum m ary... 33
2.4 Radiation response of m etallic glasses: Sim ulations ... 33
2.4.1 Increased free volum e... 33
2.4.2 Reduced short-range topological order... 34
2.4.3 Enhanced plasticity ... 34
2.4.4 Sum m ary... 35
2.5 Open research questions ... 35
3 A tom istic sim ulation m ethods ... 37
3.1 M olecular dynam ics... 37
3.2 M olecular statics ... 37
3.3 A tom ic structure analysis... 38
3.3.1 Analysis of average structural order with the pair correlation function-g(r)... 38
3.3.2 Classification of bond topology with common neighbor analysis (CNA) ... 39
4.1 Voxel field calculations ... 42
4.1.1 Density and potential energy ... 42
4.1.2 Tem perature... 42
4.1.3 Diffusivity... 42
4.1.4 Stress tensor... 42
4.1.5 Strain tensor... 43
5 Atom istic m odeling of m etallic glasses ... 45
5.1 Modeling of amorphous Cu-Nb alloys with molecular dynamics... 45
5.1.1 Cu-Nb as a m odel am orphous alloy system ... 45
5.1.2 Construction of amorphous Cu-Nb alloy configurations with molecular dynamics 46 5.2 Glass transition by gelation in Cu5oNb5O... 54
5.2.1 Introduction ... 54
5.2.2 M ethods ... 55
5.2.3 Result -Glass transition tem perature is 1500 K ... 56
5.2.4 Result - Glass transition m echanism is gelation ... 60
5.2.5 Discussion - Glass transition by gelation... 65
5.3 Glass transition temperatures in Cu25Nb75, Cu5oNb5o, and Cu75Nb25 ... . .. . . 66
5.3.1 Length-scale of com positional order ... 67
5.3.2 Flow stress ... 69
5.3.3 Icosahedral short-range order ... 69
5.3.4 Therm al expansion ... 69
5.3.5 Heat capacity ... 70
5.4 Properties of amorphous Cu25Nb75, Cu5oNb5o, and Cu75Nb25... ... ... . . 71
5.4.1 Elastic constants ... 72
5.4.2 Yield stress ... 73
5.5 Synthesis of /2 billion atom amorphous alloy configurations... 73
6 Atom istic sim ulations of irradiated m etallic glasses ... 77
6.1 Design of /2 MeV molecular dynamics collision cascade studies ... 77
6.1.1 Prim ary knock-on atom energy selection ... 78
6.1.2 Selection of sim ulation cell size ... 80 6.2 Radiation response mechanisms in metallic glasses: Isolated super-quenched zones and
6.2.1 Sim ulation setup ... 80
6.2.2 Result 1 - Simulation output is reliable... 81
6.2.3 Result 2 - PKA produces isolated thermal spikes without ion tracks ... 84
6.2.4 Result 3 - Thermal spikes are liquids that quench to "Super-quenched zones" ... 87
6.2.5 Result 4 - Thermal spikes produce stress pulses that trigger polarized plasticity ... 93
6.2 .6 D iscussion ... 99
6.3 Role of composition and free volume in radiation response of metallic glasses... 100
6 .3.1 Introduction ... 100
6.3.2 T herm al spike size ... 100
6.3.3 C ollision-induced plasticity ... 101
7 Micro-mechanical model for collision-induced plasticity ... 105
7 .1 Introdu ction ... 105
7.2 M icro-m echanical m odel ... 105
7.2.1 Transient analytical solution to pressurized spherical cavity ... 105
7.2.2 Model-based predictions of transient stress adjacent to thermal spikes... 108
7.2.3 Model-based predictions of maximum stress adjacent to thermal spikes ... 111
7.3 Modeling onset of collision-induced plasticity... 112
7.3.1 Maximum von Mises stress adjacent to thermal spikes ... 112
7.3.2 Maximum pressure inside thermal spikes ... 113
7.3.3 Collision-induced plasticity susceptibility parameter X... ... 115
7.4 Validation of micro-mechanical model with irradiated Cu-Nb alloys... 116
7.4.1 Testing damage resistance parameter X with simulation data ... 116
8 C onclu sion s... 119 9 R eferen ces... 12 1
List of Figures
Fig. 1.1: Molecular dynamics simulation of 1 keV self-ion irradiation of 32,000 atom FCC copper configuration at 300 K (interatomic potential is copper Voter EAM potential splined to ZBL at short-distances [8]). Atoms are colored by the number of nearest neighbors. Perfectly coordinated (N = 12) FCC atoms are removed for clarity. (a) Ballistic stage of the cascade results in numerous displacements. (b) The primary damage state includes vacancies (e.g. indicated by under-coordinated atoms) and interstitials (e.g. indicated by over-coordinated ato m s)...2 0 Fig. 2.1: Variation of volume (or enthalpy) with temperature in a quenched liquid. Sufficiently slow cooling causes crystallization at the melting temperature (TM). Fast cooling causes undercooling below TM, suppressing crystallization and leading to formation of glass "a." Faster cooling leads to glass "b." Reprinted by permission from Macmillan Publishers Ltd: Nature 410:
259-267, C 200 1. ... 24 Fig. 2.2: Metallic glasses are disordered, but not random, at the atomic scale. (a) Atomic configuration of an amorphous metal alloy-Cu5oNb5o-produced with atomistic modeling (See Chapter 5 for details). Nb atoms colored in dark gray; Cu atoms colored with light gray. (b) Total pair correlation function computed for the visualized structure shown in (a). ... 26
Fig. 3.1: Calculation of the pair correlation function. (a) g(r) computed as the number of atoms within a spherical shell of width Ar at a distance r from a given atom, relative to bulk density. (b) Pair-correlation function computed in liquid Cu5oNb5o at 4000 K. The dashed line indicates the
value for the norm alized bulk density... 38
Fig. 3.2: Application of common neighbor analysis (CNA). (a) Bonded atoms are identified on the basis of a cutoff distance (here, 3.5
A).
The charcoal and red colored atoms are the nearest neighbors to the light gray atoms. (b) The nearest neighbors common to the two light gray atoms are highlighted in red and correspond to a 5-5-5 CNA index for the root pair bond... 39 Fig. 5.1: Molecular dynamics "virtual quenching" procedure for synthesis of amorphous metal structures. (a) Simulation temperature versus time, with inset showing the stepwise cooling procedure. Simulation pressure, potential energy, and volume (b, d, e, respectively) are plotted against the simulation temperature during the quench. The initial crystalline and final amorphous configuration (c and f, respectively). Cu atoms are shown in light gray; Nb atoms in dark gray. 48 Fig. 5.2: Topological and chemical ordering in a-Cu5oNb5o quenched at 10"3 K/s. (a) Pair-pair correlation functions for Cu-Cu, Cu-Nb, and Nb-Nb interactions. (b) Total structure factor, computed from the total g(r), computed for r values out to r=4.5 nm. (c) Partial structure factorsSa (q) computed for each of the individual g(r),p curves in (a), but with radial distances out to
r=4.5 nm. (d) Composition-composition structure factor factor Sec(q), computed from the partial structure factors (shown at low q-values in the inset)... 50
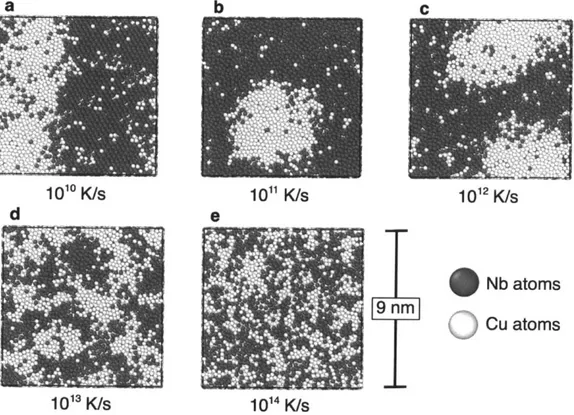
Fig. 5.3: Cu5oNb5o via molecular dynamics quenching. (a) Quenching at 1010 K/s yields a phase
yields phase separated amorphous structures, (b) and (c) respectively. Quenching at 1013 K/s and 1014 K/s amorphous structures with interpenetrating networks of compositionally enriched material, (d) and (e) respectively. All structures shown at 300 K, after quenching from 4000 K liquid under P = 0 GPa at the indicated quench rate. Atomic structure visualizations performed
w ith O V IT O [87]... 5 1
Fig. 5.4: Critical quench rate for crystallization in rapidly quenched CuMoNb5o. (a) Pair-correlation functions-g(r)-at quench rates of 10" K/s (top) and 1010 K/s (bottom). (b) Potential energy versus temperature in Cu5oNb5o quenched from 4000 K liquid to 300 K solid at rates of 1011 K/s (dashed line) and 1010 K/s (solid line). ... 52
Fig. 5.5: Length-scale of compositional medium range order (CMRO). Variation of local composition as a function of distance along a 2 nm diameter cylinder in 300 K amorphous Cu55Nb45 produced by MD quenching. Compare with Fig. 2(d) in Ref. [36]. ... 53 Fig. 5.6: Visualizations of Cu5oNb5o at 1400 K (left) and 1600 K (right) after 20 ns of annealing.
(a and b) A 1 nm thick slice is shown with Cu-rich regions colored light gray and Nb-rich regions colored black. (c and d) Atoms at the CMRO interface, 40 < < 60% Cu, in the slice of
the top panel are visualized. Atoms participating in ISRO packing are colored red and emphasized with a 20% larger radius. Bonds between ISRO nearest neighbor atoms are colored red. (e and f) Probability pfl""(r) of finding an atom in the icosahedra network at distance r
from C M R O interfaces ... 57
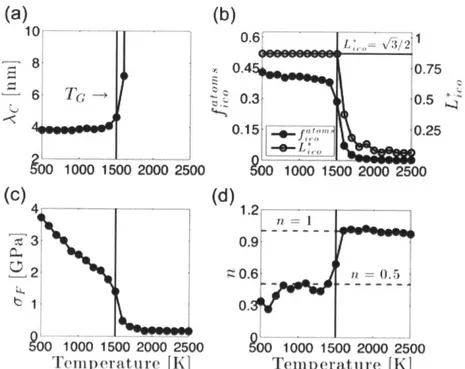
Fig. 5.7: Properties in annealed Cu5oNb5o. Temperature dependence of (a) CMRO wavelength
Ac ; (b) percent of atoms in full icosahedra f""""ll and size of largest ISRO cluster divided by simulation cell edge length L> = Lo
/L
0; (c)
flow stress o-F ; and (d) diffusion exponent n .The vertical lines at 1500 K correspond to the glass transition temperature. All quantities computed after 20 ns annealing at indicated temperature. ... 58Fig. 5.8: Variation of potential energy as a function of local composition in 300 K amorphous
Cu5oNb5o. Open data points correspond to the average local composition and potential energy in
the Nb-rich (triangle), interface (squre), and Cu-rich region (diamond). Dashed line is the interpolated value of potential energy versus local concentration based on the values of the Nb-rich and Cu-Nb-rich data points. Filled star corresponds to the average local composition and potential energy for ISRO atoms. Uncertainty on the mean values reported of order of the size of the sym bols and therefore not shown... 59
Fig. 5.9: Harmonic elastic response of icosahedra network. Change in potential energy for the icosahedra network and non-icosahedral atoms (closed and open symbols, respectively) as a function of applied strain ezz below the elastic limit... 61
Fig. 5.10: Variation in the fraction of icosahedra fo""" in Cu5oNb5o deformed at 1400K. (a)
zero-configuration after Cl has been loaded to a total strain of EAPP at ta = 2 x 10⁹ s-'and unloaded to zero strain at the same rate. Error bars represent the uncertainty on the mean value, determined
by averaging over 5 (a) and 30 (b) independent simulations... 63
Fig. 5.11: Reversible deformation. (a) Average displacement magnitude I Ar I and (b) average difference in potential energy APE between two zero-strain configurations, C1 and C2, as a function of applied strain EAPP (see text for details). The vertical lines indicate the global yield strain. Error bars represent the uncertainty on the mean value, determined by averaging over 30 independent sim ulations... 63
Fig. 5.12: Diffusion behavior of annealed CusoNb5o. Variation of mean-squared displacement with temperature for 9,826 atom Cu5oNb5o annealed at temperatures between 500 K and 2500 K (100 K increments). The cage breaking interval is shaded in blue; the fitting window is shaded in
cyan; and the phase separation interval is shaded in red. ... 65
Fig. 5.13: CMRO versus temperature and composition. Visualization of alloys (Cu25Nb75, Cu5oNb5o, and Cu75Nb25 at top, middle, and bottom, respectively) following 20 ns annealing. A 1 nm thick slice is shown with Cu-rich regions colored light gray and Nb-rich regions colored b lack ... 6 7
Fig. 5.14: Variation of properties with composition and annealing temperature. (a) Variation of the length-scale of compositional medium range order (AC) with temperature. (b) Variation of the flow stress with temperature. (c) Fraction of atoms in full icosahedra as a function of temperature. (d) Glass transition temperature as a function of composition. All values computed after annealing for 20 ns at the indicated temperature... 68
Fig. 5.15: Variation of properties with composition and temperature. (a) Variation of thermal expansion with respect to temperature for three alloy systems. (b) Temperature dependence of the second derivatives of the curves in (a). The inflection point is where the second derivative equals zero. (c) Variation of heat capacity with respect to temperature for three alloy systems. (d) Temperature dependence of the second derivatives of the curves in (c). The inflection point is where the second derivative equals zero... 70
Fig. 5.16: Atomistic calculation of mechanical properties of of a-Cu5oNb5o. (a) Stress versus
strain computed under quasi-static uniaxial tension. Solid lines indicate linear fits. (b) Von Mises stress versus work equivalent strain under volume conserving deformation at 300 K with a strain rate of = 2 - 10' 1/s. Solid line indicates 0.2% strain offset... 73
Fig. 5.17: Comparison of thermodynamic output between 50k and 474M atom configurations of quenched Cu5oNb5o. (a) Potential energy versus simulation time. (b) Volume per atom versus sim ulation tim e... 74 Fig. 6.1: (a) The nuclear and electronic stopping powers (Sn and Se, respectively) as a function of PKA energy for Nb and Cu (black and red, respectively), as computed in an a-CuoNbso5 system of density p=8.193 g/cm with standard SRIM [125]. (b) Ratio of Sn and Se as a function of PKA energy, for Cu (red) and Nb (black) PKAs... 78
Fig. 6.2: (a) Distributions of final positions of 475 keV Nb PKAs in an a-Cu5oNb5o system of density p=8.193 g/cm computed with SRIM. The solid line and filled circles are for no electronic
stopping (modified SRIM [126]) while the dashed line and open circles include electronic stopping (standard SRIM [125]). (b) Histogram of primary recoil energies due to 475 keV Nb ions, averaged over 1,000 Nb PKAs, computed using SRIM without and with electronic stopping (solid and dashed lines, respectively). ... 79
Fig. 6.3: Energy is conserved in MD simulation of 475 keV Nb ion irradiation of a Cu5oNb5o. (a) Variation of simulation timestep size with total simulation time. (b) PKA energy and change in total system energy as a function of simulation time... 81
Fig. 6.4: Trajectory of 475 keV Nb ion in a-Cu5oNb5o, computed with NVE molecular dynamics. (a) Visualization of PKA trajectory. The simulation cell boundaries are indicated. The dashed line indicates the specified PKA direction. (b) PKA position as a function of simulation time. The simulation cell has an edge length of 196 nm... 82
Fig. 6.5: Change in the simulation center of mass position as a function of simulation time... 83 Fig. 6.6: Quantifying PKA collision events. (a) PKA energy versus integral trajectory distance.
(b) Histogram of number of recoils created at a given energy, computed using SRIM without [126] and with [125] electronic stopping (solid and dashed lines, respectively), as previously
shown in Fig. 6.2. Blue symbols with dashed line correspond to MD data, computed as the histogram of PKA energy drops [from part (a)]. ... 85
Fig. 6.7: Displacement zones and thermal spikes in irradiated a-Cu5oNb5o. (a) Displaced atom trajectories in a-Cu5oNb5o: 475keV Nb PKA plotted in red, knock-on atoms acquiring at least 1 keV in black; atoms displaced between 0.5-1 nm in blue. (b) Temperature fields due to inter-nuclear collisions. Red voxels have a maximum temperature greater than TG = 1500 K [39]. The
blue contour is for Tmax = 350 K after a total simulation time of 12 ps. (c) Isolated thermal spikes identified on the basis of nearest-neighbor cluster analysis. (d) Energy flux into a single representative therm al spike, boxed in (c). ... 86
Fig. 6.8: Thermal spike volume versus deposited energy. The straight line corresponds to the linear fit: VTs = (15.1 ± 0.6 nm3/keV) ETS-(8.9 + 11.2 nm3)... 87
Fig. 6.9: Time-dependent properties of a single voxel inside thermal spike shown in Fig. 6.7 (d). (a) Voxel temperature and density versus time. (b) Voxel mean-squared displacement (MSD) and derivative diffusivity versus time. (c) Voxel density and (d) diffusivity versus voxel temperature (open symbols), compared with values from uniform CuMoNbMo liquid quenched at
6 - 1 0 K / s... 89
Fig. 6.10: Mapping of thermal spike properties to rapidly quenched, uniform liquid. Diffusivity (a) and density (b) at t=5 ps plotted versus temperature for voxels with Tmax > TG (open symbols: voxel data; blue line: binned average). The values for Cu5oNb5o liquid quenched at 6- 1013 K/s are
Fig. 6.11: Changes in voxel potential energy (a) and density (b) between the initial and post-irradiation SQZs are plotted versus voxel quench rate. Property changes for a-Cu5oNb5o quenched at various rates, with respect to 1 - 10" K/s are shown for comparison (black line).. 91 Fig. 6.12: Schematic representation of radiation-induced SQZ formation, responsible for radiation-induced swelling and ductilization ... 92
Fig. 6.13: Confined melting leads to pressurization of thermal spike and initiation of a stress pulse. (a) Close-up view of thermal spike. (b) Pressure, (c) temperature, and (d) density plotted versus simulation time for thermal spike (black line) and adjacent material within 4 nm of thermal spike surface (gray line). Shaded band indicates uncertainty of the mean... 93 Fig. 6.14: Liquid thermal spikes emit stress pules. (a) Pressure as a function of distance from the surface of the thermal spike visualized in Fig. 6.13 (a). Inset plot is position of the peak of the pressure pulse as a function of time. (b) Stress pulse front after 5 ps... 94 Fig. 6.15: Material response in a radiation damage zone. (a) Close-up view of thermal spike boxed in Fig. 1(a). A cylindrical coordinate system is defined along the major (z) axis of the thermal spike. (b) Average temperature in the thermal spike and in adjacent voxels versus time. (c) Variation of diagonal components of plastic strain in cylindrical coordinates with location along the thermal spike major axis, with uncertainty indicated by shaded bands. (d) Von Mises stress and tensile work equivalent plastic strain versus time, averaged over all adjacent voxels w ithin 4 nm of the therm al spike. ... 95
Fig. 6.16: Voxel average plastic strain components in material adjacent to the seven largest thermal spikes as a function of the thermal spike energy. Arrow indicates the thermal spike analyzed in F ig. 6.15...96
Fig. 6.17: (a) Distribution of maximum pressure inside thermal spikes; (b) Distribution of maximum average von Mises equivalent stress (Uvm) in material within 4 nm of thermal spikes.
... 9 7
Fig. 6.18: Summary of radiation damage in irradiated Cu-Nb alloys. Left column, PKA trajectories shown with red lines; KA (ke>1keV) shown with black lines. Center column, red cubes correspond to regions with Tmax > TG; blue contour corresponds Tmax = 350 K. Right
column, voxels adjacent to liquid zones
(
Tmx > 350 K)
with plastic strainsEV (t-12 ps) > 0.01 are shown as black cubes... 102
Fig. 6.19: Number of clusters, sorted largest to smallest, comprising 80% of the total thermal spike volume, versus glass transition temperature of irradiated alloys (Cu25Nb75, TG=1400 K;
Cu5oNbso, TG=1500 K ; Cu75Nb25, TG=1600 K). ... 104 Fig. 6.20: Variation of collision-induced plasticity with material glass transition temperature and annealing. Open symbols correspond to as-quenched state and filled symbols indicate relaxed state ... 10 4
Fig. 7.1: Schematic of the micro-mechanical model for the onset of collision-induced plasticity. (a) Spherical cavity of radius a loaded with an internal pressure P at time t = 0. An analytical
solution describes the transient stress response at a material point r. (b) Schematic of the
assumed step-function loading pressurization of the spherical cavity... 106
Fig. 7.2: Comparison of thermal spike data from molecular dynamics simulation of 475 keV Nb irradiation of Cu5oNb5o and transient linear elastic model. (a) Thermal spike zone, with red cubes
indicating voxels with Tmax>1500 K and black cubes indicating EP>0.01. (b) Spherical cavity
approximation of thermal spike in (a) with a radius r=4 nm. ... 109
Fig. 7.3: Application of transient elastic model to model stress response of material adjacent to thermal spikes. The pressure input is modeled with a single step function (a), two step functions
(b), and multiple step functions (c). The dashed blue line (a-c) is the pressure measured in the
thermal spike shown in Fig. 7.2 (a). The approximation for P(t) is shown in the solid black line (a-c). Using the P(t) approximation shown in (a-c), the stress response of a material point at r = 7
nm is plotted with a solid black line. The actual stress data measured at this material point adjacent to the thermal spike is plotted in the dashed black line... 110
Fig. 7.4: Model-based prediction of maximum von Mises stress (OvM) as a function of distance from the surface of the therm al spike. ... 111 Fig. 7.5: (a) Variation of thermal spike pressure with material. (b) variation of X with material type, evaluated using pressure measured in thermal spikes... 116
Fig. 7.6: Collision-induced susceptibility parameter X computed from material properties versus
X evaluated directly from thermal spike properties. Open symbols correspond to as-quenched systems while filled symbols indicate relaxed systems... 117
List of Tables
Table 3.1: Common neighbor analysis (CNA) indices for different atomic structures [38, 86].. 40 Table 5.1: Variable quench rate synthesis procedure for 50k atom model glasses and resulting p rop erties... 5 3 Table 5.2: Synthesis procedure for 50k atom model glasses and resulting properties. ... 72 Table 5.3 Synthesis procedure for % billion atom model glasses and resulting properties... 75 Table 6.1: Plasticity in irradiated Cu-Nb alloys. Cascade direction determined by the major axis of the best-fit ellipsoid to voxels withTmax > 350 K; eigenvalues computed from the average plastic strain tensor of voxels adjacent to liquid zones (e.g. 350 < Tmax < TG); the aggregate collision-induced plasticity parameter is computed as A = f(EP_)/cj, where (EfM) is the average
strain in voxels adjacent to liquid zones and
4
is the dose. ... 103Table 7.1: Model inputs for Fig. 7.3. The average stress predicted at various times is indicated, as well as the actual stress measured in the material in the irradiated material. ... 111 Table 7.2: Predicting the maximum stress in thermal spikes... 115
1
Introduction
The fundamental, atomic-scale mechanisms responsible for bulk property changes in irradiated materials have received considerable attention over the past fifty years [1]. These studies, motivated in large part by unanticipated property changes, such as void swelling in irradiated structural metals in nuclear reactors, have revealed that radiation creates defects at the atomic-scale. In some cases, such as focused ion-beam milling, radiation-induced defects can be employed as a tool to engineer desirable material properties. In others, such as nuclear reactors, radiation degrades critical material properties, reducing the lifetime of a material for its intended application.
Most research effort on radiation effects in metals has focused on crystalline, structural alloys. By contrast, another category of metals-metallic glasses-has received comparatively little fundamental study. Metallic glasses are amorphous, meaning that no long-range order exists at the atomic scale. As a consequence of their disordered atomic structure, amorphous metal alloys have impressive mechanical properties, high temperature formability, and corrosion resistance. Additionally, radiation has been found to yield property changes qualitatively different from crystalline metals, but the fundamental radiation response mechanisms remain poorly understood.
1.1 Fundamental radiation response mechanisms in crystalline metals
In crystalline metals, radiation in the form of high-energy particles like neutrons and ions creates damage through atomic displacements caused by collisions between incident particles and atoms in the irradiated material. Particle-atom scattering transfers energy to material atoms, creating "Primary Knock-on Atoms" (PKAs) that may have sufficient energy to be displaced from initial lattice positions. If the PKA energy exceeds a modest energy (~ 25 eV), the displaced PKA creates a single vacancy and terminate as a self-interstitial, creating a stable Frenkel pair. However, as illustrated in Fig. 1.1, for PKAs with energies exceeding ~ 1 keV, the PKA will initiate a chain reaction of atomic displacements ("collision cascade") that generates multiple point defects [1] and, at high energies, can also yield defect complexes such as interstitial clusters [2]. These atomic-level responses of crystalline solids to radiation yield large changes to macroscale properties, including continuous void swelling due to clustering of vacancies [3, 4] and embrittlement due to multiplication of dislocation obstacles (e.g. vacancy
A 14.4 s B 14t=3.49 ps 7.3 nm --
-Fig. 1.1: Molecular dynamics simulation of 1 keV self-ion irradiation of 32,000 atom FCC
copper configuration at 300 K (interatomic potential is copper Voter EAM potential splined to ZBL at short-distances [8]). Atoms are colored by the number of nearest neighbors. Perfectly coordinated (N = 12) FCC atoms are removed for clarity. (a) Ballistic stage of the cascade
results in numerous displacements. (b) The primary damage state includes vacancies (e.g. indicated by under-coordinated atoms) and interstitials (e.g. indicated by over-coordinated atoms).
clusters and precipitates) [5, 6]. Understanding atomic-scale radiation damage mechanisms is
therefore critical to science-based design of engineering alloys resistant to radiation damage [7]. Displaced PKAs lose energy through discrete scattering events with material atoms ("nuclear stopping"), as well as through interactions with the electronic sub-system of the material ("electronic stopping") [9]. Electrons slow PKAs and enhance thermal conductivity, dissipating energy away from collision cascades [1]. The average PKA energy in irradiated alloys is well above the threshold for cascade formation (e.g. 1 MeV neutrons in nickel produces an average PKA energy of 35 keV [9]) but in the energy range where most PKA energy is lost through nuclear stopping [10].
Collision cascades occupy volumes approximately ten nanometers (nm) in diameter and exist for times on the order of ten picoseconds (ps) [Fig. 1.1]. Current experimental techniques lack the spatiotemporal resolution to analyze defect production in-situ and are limited to post-mortem analysis of radiation-induced damage. Therefore, theory and simulation provide the only means of revealing the actual atomic-scale mechanisms responsible for damage production in irradiated materials [1].
Extensive computer modeling demonstrates that collision cascades in metals proceed through two distinct stages [1]. For the first ; 0.5 ps of the cascade, the PKA collides with other atoms in discrete, two-body scattering events, so-called the "ballistic stage," which sets the spatial distribution of displacements and subsequent energy deposition. Second, for the next ~ 10 ps, the energy of displaced atoms decreases, the scattering cross-section increases, and energy is dissipated in the lattice through many-body interactions in "thermal spikes." During the thermal spike stage, energy dissipation causes local melting, followed by rapid quenching to a defective crystal state [11, 12]. Rapid melting leads to pressurization of the liquid zone, which emits an elastic stress pulse into the surrounding unmelted material [2]. If the energy of a PKA exceeds a material-dependent threshold, the collision cascade splits into multiple spatially-distinct "sub-cascades." For example, computer simulations demonstrate 200 keV PKAs in iron split into smaller sub-cascades that are individually comparable in size and energy to those resulting from a single 10 keV PKA [13]. Although some Frenkel pairs recombine in the disordered core of the collision cascade, numerous defects remain, including Frenkel pairs, vacancy clusters, and self-interstitial clusters [2, 14]. The subsequent long-time evolution of the damage state depends on the defect mobility and proximity to defect sinks.
1.2 Knowledge gaps-the radiation response of metallic glasses
Unlike in crystalline alloys, only a handful of modeling studies exist to guide interpretation of experimental results of irradiated metallic glasses. As summarized in Chapter 2, all fundamental studies in realistic models of metallic glasses have focused on changes to local topological order, and no study has yet explored the dynamics of defect production. Knowledge of collision cascade dynamics is lacking, both with respect to the possibility of sub-cascade formation and concerning the types of damage created in individual cascades.
This Thesis resolves these knowledge gaps through a systematic simulation study of the radiation response of amorphous metal alloys. Through the use of massive parallel computing techniques, a series of /2 billion atom, realistic models of metallic glasses are constructed.
Irradiation with /2 MeV ions is subsequently simulated, revealing that ions lose energy through binary collisions that terminate in spatially distinct liquid zones (thermal spikes). Additionally, novel damage mechanisms in the form of "super-quenched zones" (SQZs) and plastic deformation are revealed at the level of individual collision cascades.
1.3 Thesis outline
In Chapters 2 and 3, I lay the groundwork for the Thesis results. In Chapter 2, I present a detailed review of the literature on the properties of metallic glasses and their radiation response, demonstrating that metallic glasses respond to radiation in ways qualitatively different than crystalline alloys. I summarize experimental findings, present insights from computer modeling, and describe the key knowledge gaps in the current understanding of the radiation response of metallic glasses. In Chapter 3, I review the computational materials science methods utilized to simulate the radiation response of metallic glasses.
In Chapters 4 - 8, I present the core results of the Thesis. In Chapter 4, I describe the
analysis methods developed to process the large simulation dataset (~ 100 Terabytes) produced through the course of this research. In Chapter 5, I report the glass transition physics in the alloy system employed in this research (Cu-Nb), as well as the mechanical properties. Identification of the glass transition temperature in each of the studied alloys (Cu2 5Nb75, Cu5oNb5o, and Cu75Nb25) is critical to identification of liquid zones in irradiated alloys in Chapters 6 and 7. In Chapter 6, I report the atomic-scale damage mechanisms in irradiated metallic glasses-super-quenched zones (SQZs) and collision-induced plasticity-in the model system a-Cu5oNb5o. I expand the
investigation in a-Cu5oNb5o to other Cu-Nb alloy systems and discuss the role of free-volume and composition in radiation response. In Chapter 7, I derive a figure of merit for selection of metallic glasses with optimal radiation damage resistance. Conclusions are provided in Chapter 8 and references listed in Chapter 9.
2 Review of metallic glasses and their radiation response
Amorphous metals are a class of metal alloys with no long-range order at the atomic-scale. While some early studies showed promising radiation damage resistance (e.g. swelling without void formation [15, 16] and radiation-enhanced ductility [17]) and novel radiation responses (e.g. ion-induced plasticity [18]) compared to crystalline alloys, the fundamental mechanisms responsible for bulk radiation responses have received little investigation. This Thesis resolves many of the knowledge gaps on fundamental radiation response mechanisms in irradiated metallic glasses. In order to place my findings (Chapters 4 - 7) within the context of
previous work, this Chapter begins with an introduction to glasses generally and metallic glasses specifically, before moving to a thorough review of the experimental and simulation-based findings on radiation response mechanisms in irradiated metallic glasses.
2.1 Introduction to glasses
Many materials found in nature are crystalline. Crystalline materials are ordered at the atomic scale, with atoms or molecules arranged on a periodic lattice. A crystal lattice has translational symmetry extending to length-scales much greater than atomic distances, and single crystal specimens have been prepared with dimensions approaching 1 meter (e.g. single crystal aircraft turbine blades prepared from nickel based super-alloys and single crystal silicon wafers). While crystalline materials are ubiquitous, it is not the only form of solid matter. In fact, non-crystalline-amorphous-materials, possessing no long-range topological order beyond a few nanometers, can be found in nature (e.g. obsidian glass formed from volcanic lava), as well as manufactured. Amorphous materials are employed in diverse applications, including oxide glasses in window panes and amorphous silicon in solar cells. While the compositions, chemistries, and material synthesis procedures vary widely, amorphous materials share the common feature of a complete lack of long-range topological order at the atomic scale.
2.1.1 Glass transition
As shown schematically in Fig. 2.1, many slowly cooled liquids crystallize at the melting temperature [19]. Crystallization is a first-order phase transition, marked by a discontinuous change in the material volume (and enthalpy), as well as derivative quantities like specific heat and thermal expansion, at the melting temperature (TM). While crystallization may be thermodynamically preferred, crystallization is inherently affected by kinetics since a finite time
is required to nucleate a seed crystal in a liquid. While the thermodynamic driving force for crystallization grows with increased cooling below TM, undercooling causes atomic diffusion to decrease, slowing the formation of a critical crystalline nucleus. If cooled quickly enough, a liquid may bypass crystallization completely. Because of the kinetics involved in the glass transition, glasses are more easily formed in viscous liquids with a glass transition temperature close to the melting temperature.
For a rapidly quenched liquid, in a relatively narrow temperature window, so-called the glass transition, the viscosity of a quenched liquid is found to increase many orders of magnitude. Below the glass transition temperature (TG), the material is a solid and resistant to flow on the timescale of an experiment, although the structure is reminiscent of the liquid state, without any long-range topological order [20]. As illustrated in Fig. 2.1, the properties of a glass depend on its quench rate, with more rapid quench rates resulting in higher glass transition temperatures and lower density. Annealing a rapidly quenched glass close to TG results in aging, with relaxation towards the properties of a glass quenched at a slower rate (e.g. increased density and lower TG).
L
E
Tga Tgb TM
Temperature
Fig. 2.1: Variation of volume (or enthalpy) with temperature in a quenched liquid. Sufficiently slow cooling causes crystallization at the melting temperature (TM). Fast cooling causes undercooling below TM, suppressing crystallization and leading to formation of glass "a." Faster
2.2 Overview of metallic glasses
While oxide-based glasses have been used for centuries, the discovery of amorphous metal alloys occurred comparatively recently. Amorphous metals are a class of metal alloys with no long-range order at the atomic-scale, resulting in a range of interesting and useful material properties such as high yield stress [21], corrosion resistance [22], and excellent formability [23]. Amorphous metals can be prepared through a number of synthesis routes, including rapid quenching of a liquid metal [24], vapor deposition [25], and ion-beam mixing [26]. Amorphous alloys that are synthesized via quenching are termed "metallic glasses," reflecting the fact that these alloys exhibit glass transition and relaxation behavior found in more traditional glassy materials such as polymer and silicate glasses.
2.2.1 Synthesis
The first amorphous metal alloy- Au75Si25-was reported by Duwez et al. in 1960 [27]
and was synthesized using a specially designed apparatus for rapid liquid quenching [28]. The apparatus consisted of a graphite crucible for melting the material, separated by a Mylar
membrane from a chamber filled with pressurized helium. Upon bursting the membrane, a shock wave propelled the liquid droplet onto the interior of a rotating copper cylinder [28], which ensured good wetting for optimal heat conduction and produced quenching rates on the order of
109 K/s. Synthesized with this method, Au75Si25, remained amorphous during characterization
with x-ray diffraction [27], but was unstable and crystallized within twenty-four hours.
Since Duwez et al. synthesized this first amorphous metal alloy by rapid quenching, a variety of alloy systems, such as Pd-based and Zr-based metallic glasses, have since been
discovered that can be synthesized with conventional metallurgical casting techniques at cooling rates as low as 1 K/s [24]. These so-called "bulk metallic glasses" (BMGs) can be formed into fully-glassy ingots with diameters on the order of centimeters [24]. Development of BMG alloys has been guided by the principal of "frustrating" the liquid state, such that the kinetics of crystal nucleation in an undercooled melt are slow and therefore easily bypassed by rapid cooling. Empirically, it has been found that good glass forming alloys meet the following criteria: (1) Multiple components and a composition near a deep eutectic; (2) atomic size ratios excess of
2.2.2 Structure
Metallic glasses are disordered at the atomic-scale, as evidenced by a diffuse X-ray diffraction spectrum without any sharp Bragg reflection peaks [27]. However, determination of the structure factor-S(q) -or the real-space analog of the pair-correlation function -g(r) -reveals that the structure is not random. In fact, both topological and chemical order exists in
amorphous metals for distances out to 1 nm. As illustrated by the atomistic modeling results in
Fig. 2.2(a), a typical pair correlation function in amorphous metals has a well-defined first nearest-neighbor shell (first peak), as well as inter-penetrating shells of atoms at the second nearest-neighbor position (split second peak) [Fig. 2.2(b)]. In crystalline alloys, diffraction data can be indexed to a unique 3-dimensional structure [29]. However, in non-crystalline, amorphous metals, no unique atomic arrangement exists and therefore to understand what topological and chemical ordering produces the g(r) signal it is necessary to use complimentary analyses beyond the pair correlation function.
Development of models for the structure of amorphous materials has been guided by Bemal's description of the structure of monatomic liquids (e.g. liquid argon) through physical models [30, 31]. Bernal produced three-dimensional physical models for the structure of liquids, including compressing ball bearings in paint, allowing the paint to harden, and then physically picking apart the structures to determine the coordination of spheres [31]. The physical models approximated an assemblage of randomly packed hard spheres and revealed a well-defined
first-a b
--- --- --- --- ----0.5
0
.0 2 4 6 8 10
9 nm Radial distance
(A)
Fig. 2.2: Metallic glasses are disordered, but not random, at the atomic scale. (a) Atomic configuration of an amorphous metal alloy-Cu5oNb5o-produced with atomistic modeling (See
nearest neighbor shell in good agreement with that found in liquid argon [31]. A high fraction of nearest-neighbor coordination contained five-fold symmetry, although the coordination geometry was irregular and in need of a statistical description [30, 31].
In the spirit of Bernal's early work, Miracle proposed a solute-centered cluster model for metallic glasses for alloys with low solute concentrations [32]. Miracle postulated that solvent atoms surround solute atoms in a proportion dictated by the relative size ratios, with each of these individual clusters in-turn forming a close-packed, cubic configuration of interpenetrating clusters. Subsequent atomistic modeling demonstrated that while solute-centered clusters are a distinguishing feature of metallic glasses, the packing of these "quasi-equivalent" clusters has primarily icosahedral, rather than cubic, symmetry [33].
In support of this modeling work, more advanced experimental techniques have recently emerged that provide direct evidence for ordering at the nanometer scale in metallic glasses. Hirata et al. employed nano-beam electron diffraction in Zr66.7Ni33.3 to reveal short-range local
topological order in the form of atom clusters-atoms clustered around a central atoms-as well as medium range order in the form of interpenetrating atom clusters [34]. Supporting this picture of interpenetrating atom clusters, Hwang et al. investigated Zr5oCu45Al5 through a "hybrid" RMC simulation that optimized an atomic configuration by fitting both to fluctuation electron microscopy data and the system potential energy, as determined from an EAM interatomic potential, finding evidence for crystal-like symmetry, in addition to icosahedral order, in the medium-range cluster packing [35].
Modeling has also been successful in describing the atomic structure of immiscible metallic glasses, such as the amorphous Cu5oNb5o alloy visualized in Fig. 2.2(a). For example, while phase separating binary systems such as Cu-Nb [36] or Ni-Ag [37] are poor glass formers, calorimetry showed that sputter deposited amorphous immiscible binary metals exhibit a lower than expected crystallization enthalpy (~~ 10 kJ/mol) [36], suggesting that some form of atomic
ordering stabilizes these amorphous solids [25]. He et al. employed Reverse Monte Carlo modeling on the immiscible system Ag4oNi6o to reveal that nanoscale, "spinodal-like" compositional order develops and stabilizes the amorphous structure against crystallization [37]. More recent experiments [36] confirmed the presence of "spinodal-like" patterns of nanometer-scale compositional enrichment, with simulations predicting percolating networks of local
icosahedral atom packing [38}, located at the interfaces between regions of compositional order
[39] (See Chapter 5).
2.2.3 Mechanical properties
At low-temperatures and moderate stresses (e.g. T/TG < 0.8 and 1 > 0.02p, where r is the shear stress and p is the shear modulus), most metallic glasses exhibit inhomogeneous plastic
flow, with shear localizing in narrow bands (shear bands) that lead to catastrophic failure [40].
At high temperatures and low stresses (e.g. T/TG > 0.8 and r < 0.003p), plastic flow is uniform, and large strains can be achieved [40]. The unit process responsible for deformation is the shear transformation zone [41]. Unlike flow-defects in crystalline solids-dislocations-that can intersect and lead to strain hardening, shear transformation zones are accompanied by dilatation, which increases the propensity for flow, and ultimately leads to shear localization [41].
Under some loading conditions, such as uniaxial tension, shear localization leads to failure in a brittle-like manner. However, a few specially engineered amorphous metals show properties comparable (or better) than many crystalline alloys. For example, tensile ductility has been achieved in metallic glass composites containing crystalline precipitates [42]. Precipitates act as barriers to the propagation of shear bands and greatly improve ductility. Additionally, a remarkable combination of toughness and yield strength has been demonstrated in a special palladium-based metallic glass (Pd79Ag3.5P6Si9.sGe2), rivaling the properties of the best crystalline alloys [43].
Experiments demonstrate that local variations in structure in metallic glasses yield large local variations in the deformation response of metallic glasses. For example, Wagner et al. used atomic force microscopy to map local variations in elastic constants of Pd77.5Cu6Sii6.5 metallic glass and found a wide distribution (full-width half maximum of 33%) of contact moduli on length-scale of 10 nm [44]. Simulations suggest that percolating networks of "soft" (i.e. negative elastic constants) and "stiff' material exist at the ~ 1 nm scale [45]. Finally, dynamic nanopillar compression experiments yield results consistent with percolating network of rigidly bonded clusters [46]
Plastic deformation has been found to trigger crystallization in deformed metallic glasses. For example, Chen et al. deformed amorphous alloys and found crystalline precipitates formed
(Al8 5NilOC35), demonstrating that deformation-induced crystallization is composition dependent
[47]. Deformation induced-crystallization has also been observed in simulations of deformed amorphous silicon (a-Si) [48], suggesting that plasticity-induced crystallization may be a general feature of the amorphous state.
2.3 Radiation response of metallic glasses: Experiments
Since the primary effect of radiation is to generate atomic-scale defects, it is reasonable to expect that the disordered structure of metallic glasses might render their response to radiation different from crystalline alloys, if not superior. Indeed, as I show below, experiments demonstrate that the macroscale behavior of metallic glasses under irradiation is markedly different than in crystalline metals-they swell without voids to a finite limit [15, 16] and become more ductile [17, 49]-suggesting distinct atomic-level responses to radiation. Similar to crystalline alloys, radiation enhances diffusion and points to the kinetics of radiation-induced defects. Finally, high-energy ion irradiation causes anisotropic plastic flow in irradiated stress free samples.
2.3.1 Radiation-induced swelling
Void swelling in irradiated crystalline alloys results from radiation-induced vacancy production and subsequent agglomeration [9]. By contrast, neutron irradiation of amorphous materials results in density reduction [15] with no void formation [15, 16], suggesting that radiation-induced increases in free-volume remain diffuse and non-localized [16].
The key test for void swelling in amorphous materials is the evolution of density with radiation dose. This approach was taken by Gerling and Wagner, who demonstrated a ~0.9% density reduction in neutron-irradiated amorphous Fe40Ni4OB 20 with the rate of density change going to zero at high doses [15]. Electron microscopy revealed no clear evidence of void or helium bubble formation [16], in stark contrast to the agglomeration of vacancies into voids in crystalline materials. Annealing of neutron-irradiated amorphous Fe4oNi4OB 20 does not enable a full recovery to the non-irradiated, annealed density, demonstrating that permanent, irreversible structural changes do accompany swelling [15]. However, the exact nature of these irreversible structural changes is unclear.
Swelling has also been probed through surface profile measurements of ion-irradiated amorphous nickel-based alloys [50, 51]. While distinct changes in the surface profile have been
measured following irradiation, no void formation was observed [50], suggesting that a qualitatively different mechanism is operating than the void swelling reported in crystalline metals. Indeed, Chang and Li note in an early study that surface swelling could be due to inhomogeneous plastic deformation [51], as is well known to result from ion irradiation of metallic glasses [18]).
While other studies have claimed to discern the presence of voids either during annealing
[52, 53] or through ion irradiation [54], those results are not convincing. For example, Tiwari and von Heimendahl [55] argue that the "voids" observed by Morris [52], are in fact crystallites, rather than voids. While Shibayama et al. observe voids in ion-irradiated amorphous alloy, crystallization occurred, obscuring whether voids form in the amorphous or crystalline matrix.
2.3.2 Radiation-enhanced ductility
While irradiated crystalline alloys become brittle, irradiated metallic glasses become more ductile [17, 49]. Radiation-induce ductility is reversible and subsequent annealing returns the alloy to its pre-irradiated brittle state [17, 49, 56].
Gerling et al. annealed a series of amorphous alloys, FeNiB, FeNiP, and CuTi, resulting in a systematic decrease in the strain to fracture with increasing annealing temperature [17], and subsequently irradiated the embrittled alloys with neutrons, resulting in a complete restoration of ductility. While the neutron dose required for complete ductilization varied with composition, for a sufficiently high neutron dose, all alloys returned to the pre-annealed ductile state. Alloys subject to longer annealing times (i.e. more brittle) required larger neutron doses to restore ductility. Finally, the authors performed a cyclic thermal annealing and post-annealing radiation experiment and found that the transition from brittle to ductile was completely reversible [17].
Magagnosc et al. also found reversible radiatinduced ductilization in Ga+ ion-irradiated Pt5 7.5Cu14.7Ni. 3P2 2.5 metallic glass nanowires [49]. As-fabricated metallic glass nanowires are initially brittle and marked by inhomogeneous flow. Following irradiation, however, the nanowires exhibit an increase in tensile ductility, marked by homogeneous flow. Post-radiation thermal annealing returns the samples to the initially brittle state, demonstrating reversibility
Raghavan et al. irradiated Zr4 2Ti1 .8Cu12.5NiioBe22.5 with Cu ions up to doses of 100 dpa, and found in subsequent micro-compression testing that the irradiated glasses had reduced yield
![Fig. 1.1: Molecular dynamics simulation of 1 keV self-ion irradiation of 32,000 atom FCC copper configuration at 300 K (interatomic potential is copper Voter EAM potential splined to ZBL at short-distances [8])](https://thumb-eu.123doks.com/thumbv2/123doknet/14121845.467787/20.918.191.700.108.418/molecular-simulation-irradiation-configuration-interatomic-potential-potential-distances.webp)