The Consolidation and Strength Behavior of
Mechanically Compressed Fine-Grained Sediments
by
Brendan Casey
B. Eng. in Civil and Environmental Engineering, University College Cork, 2009 S.M. in Civil and Environmental Engineering, Massachusetts Institute of Technology, 2011
Submitted to the Department of Civil and Environmental Engineering in partial fulfillment of the requirements for the degree of
Doctor of Philosophy in the field of Geotechnical and Geoenvironmental Engineering at the
Massachusetts Institute of Technology
June 2014
MASSACHUSETS 1NST1_1TUTE' OF TECHNOLOGY
JUN 13 201
LIBRARIES
C 2014 Massachusetts Institute of Technology. All rights reserved.Signature of Author...
Signature redacted
...
Department of Civil and Environental'fgineering
May 2 nd 2014
Certified by...Signature
redacted...
John T. Germaine Senior Research Associate of Civil and Environmental Engineering
A ccepted by...
TI
pesis
SuperisorSignature redacted
HeiIi M.jNepf Chair, Departmental Committee for Graduate Students
The Consolidation and Strength Behavior of
Mechanically Compressed Fine-Grained Sediments
by
Brendan Casey
Submitted to the Department of Civil and Environmental Engineering on May 2"d, 2014 in partial fulfillment of the requirements for the degree of
Doctor of Philosophy in the field of Geotechnical and Geoenvironmental Engineering
ABSTRACT
This thesis investigates the consolidation and shear strength behavior of saturated fine-grained sediments over the effective stress range of 0.1 to 100 MPa. The research makes use of samples which are resedimented in the laboratory from natural soils. In addition to practical benefits, resedimentation allows for isolation and quantification of individual factors influencing behavior such as composition, consolidation stress and overconsolidation ratio (OCR).
Ko-consolidated triaxial compression tests were performed on eight resedimented soils at room temperature. The results demonstrate conclusively that the conventional assumption of these soils exhibiting constant normalized properties is not valid when behavior is evaluated over a significant stress range. The direction and rate at which a soil's strength properties vary depend on its composition, with high plasticity soils showing a much more rapid reduction in both normalized undrained strength and critical state friction angle with increasing stress compared to low plasticity soils. For all soils, increasing consolidation stress results in a more ductile stress-strain response during undrained shearing as strain to failure increases and the amount of post-peak strain softening reduces at each OCR. Variations in strength properties as a function of stress level and soil type are closely linked to Ko, with higher values of Ko associated with both lower friction angles and lower undrained strengths. During virgin compression, high plasticity soils display a rapid increase in Ko and values in excess of 0.80 have been measured at high stresses.
The permeability behavior of a large number of resedimented soils has been investigated over a permeability range of 10-1 m2 to 10-2 m2 and a porosity range of about 0.75 to 0.20. The
permeability-porosity relationship for a soil can be correlated to its liquid limit, which provides a robust indicator of the combined effects of pore size distribution and clay minealogy on behavior. Virgin compression behavior is strongly influenced by composition at low stresses, although at high stresses all fine-grained soils display a similar compression behavior regardless of their composition. The conventional 'Terzaghi' definition of effective stress is shown to be applicable to fine-grained sediments at pore pressures up to at least 10 MPa.
Thesis Supervisor: John T. Germaine
ACKNOWLEDGEMENTS
Without question my greatest thanks goes to my research supervisor, teacher and friend Dr. Jack Germaine. The utmost respect and admiration is given to his knowledge of laboratory testing, and indeed engineering as a whole. Almost as important for a person committing to life as an MIT graduate student, Dr. Germaine's personality and sense of humor makes working with him a pleasure. I am also extremely grateful to Prof. Peter Flemings for teaching a poor communicator how to effectively present technical data to an audience, this is an invaluable skill in any field for which I have Peter to thank.
I would like to thank my committee members for their invaluable contributions and insights into the work: Prof. Chuck Ladd, Dr. Dick Plumb, Prof. Brian Evans and Prof. Herbert Einstein. I would also like to acknowledge my other teachers of geotechnical engineering; Prof. Andrew Whittle and Dr. Lucy Jen. I recognize that I have been advised and educated by some of the best in the world.
I am sincerely thankful for all my friends with whom I began my career at MIT and share almost every day with, in particular Amy, Amer, Steve, and Jana. The daily banter has made demanding times seem less daunting, and indeed often a lot of fun. Lastly, to Erin, who has given me unconditional support, happiness and clothing throughout my last few years at MIT.
TABLE OF CONTENTS LIST O F TA B LE S...11 LIST OF FIGURES...12 LIST OF SYMBOLS...22 1 INTRODUCTION... 27 1.1 PROBLEM STATEMENT... 27
1.2 THESIS SCOPE AND OBJECTIVES ... 28
1.3 ORGANIZATION OF THE THESIS... 29
2 B A C K G R O U N D ... 32
2.1 INTRODUCTION ... 32
2.2 PREVIOUS STUDIES OF HARD CLAYS IN TRIAXIAL COMPRESSION... 33
2.3 EFFECTS OF DIAGENETIC CEMENATATION ON BEHAVIOUR ... 40
2.3.1 Introduction ... 40
2.3.2 Classification of Fine-grained Materials ... 41
2.3.3 Apparent Preconsolidation ... 43
2.3.4 Stress-Strain Response during Shearing... 43
2.3.5 Failure Envelopes ... 45
2.4 NORMALIZED BEHAVIOUR... 46
2.4.1 Introduction ... 46
2.4.2 Effect of Stress Level on Normalized Strength... 47
2.4.3 Correlations with Atterberg Limits ... 50
2.4.4 SHANSEP versus Recompression ... 51
2.4.5 Normalized Behaviour of Clay Shales ... 52
2.5.1 Introduction ... 53
2.5.2 Proposed Modifications to Terzaghi's Definition of Effective Stress ... 54
2.5.3 Experimental Investigation of the Definition of Effective Stress ... 57
2.6 SA TU RA TION AN D B-V A LU E ... 58
2.6.1 Introduction ... 58
2.6.2 Skem pton's Pore Pressure Param eter B ... 59
2.6.3 A pparatus Com pressibility ... 61
3 RESEDIMENTATION AND TEST MATERIA LS... 80
3.1 IN TR O D U CTION ... 80
3.2 TEST M A TERIA LS ... 81
3.2.1 Introduction ... 81
3.2.2 Boston Blue Clay... 82
3.2.3 Presum pscot Clay... 83
3.2.4 U rsa Clay... 84
3.2.5 U gnu Clay... 84
3.2.6 San Francisco Bay M ud ... 85
3.2.7 London Clay... 86
3.2.8 Skibbereen Silt ... 86
3.2.9 Eugene Island Clay... 87
3.3 RESED IM EN TA TION ... 88
3.3.1 Introduction ... 88
3.3.2 Resedim entation Procedure... 88
3.3.3 Equipm ent ... 90
4 EQ UIPM EN T AN D PR O CED UR ES... 106
4.1 IN TRODU CTION ... 106
4.2 TRIAX IA L EQU IPM EN T... 106
4.2.1 Overview of Triaxial System s... 106
4.2.2 Triaxial Cells ... 107
4.2.3 End Platens ... 109
4.2.4 Pressure V olum e A ctuators ... 111
4.2.5 Control System ... 112
4.2.6 D ata A cquisition... 113
4.2.7 Apparatus Com pressibility... 114
4.3 EVALUATION OF TRIAXIAL EQUIPMENT ... 116
4.3.1 Introduction ... . 116
4.3.2 Consolidation... 116
4.3.3 Undrained Shear... 117
4.4 TESTIN G PROCED U RES... 118
5 CO N SO LID A TIO N RESULTS ... 135
5.1 IN TRODU CTION ... 135
5.2 COM PRESSION BEHAV IOR ... 135
5.2.1 Experim ental Results... 135
5.2.2 Com parison of Com pression M odels ... 137
5.3 PERM EABILITY BEH AV IOR ... 139
5.3.1 Introduction ... 139
5.3.2 Permeability Results and Correlations with Liquid Limit... 141
5.3.3 D iscussion of Perm eability Correlations... 143
5.3.5 Coefficient of Consolidation ... 147
5.4 FACTORS INFLUENCING K0... ... 148
5.4.1 Effect of Stress Level and Composition on KONC ... 148
5.4.2 Effect of OCR on K0... 151
6 UNDRAINED SHEAR RESULTS... 170
6.1 INTRODUCTION ... 170
6.2 EFFECTIVE STRESS TESTS ... 171
6.3 RESEDIMENTED BOSTON BLUE CLAY... 173
6.3.1 Normally Consolidated Behavior... 173
6.3.2 Overconsolidated Behavior ... 176
6.3.3 Critical State Behavior ... 181
6.4 RESEDIMENTED PRESUMPSCOT CLAY... 182
6.5 RESEDIMENTED GoM URSA CLAY ... 184
6.6 RESEDIMENTED UGNU CLAY ... 186
6.7 RESEDIMENTED SAN FRANCISCO BAY MUD... 187
6.8 RESEDIMENTED LONDON CLAY ... 189
6.9 SUMMARY AND COMPARISON OF RESULTS ... 190
6.9.1 Undrained Strength ... 190
6.9.2 Friction A ngle... 193
6.9.3 Y oung's M odulus ... 195
6.9.4 Effect of Ko on Shear Strength ... 196
6.9.5 Critical State Behavior ... 198
6.9.6 Particle R eorientation ... 199
6.10 STRENGTH BEHAVIOR IN OTHER MODES OF SHEAR ... 200
6.10.2 Summ ary of Undrained Strength... 201
6.10.3 Summ ary of Friction Angle Data... 202
6.10.4 Yield Surface Evolution ... 202
7 CONCLUSIONS AND RECOMMENDATIONS... 240
7.1 RESEDIM ENTATION ... 240
7.2 CON SOLIDATION BEHAVIOR ... 241
7.3 STRENGTH BEHAVIOR ... 243
7.4 RECOMMENDATIONS FOR FUTURE WORK ... 248
LIST OF TABLES
Table 2-1: Summary of the main findings of Abdulhadi (2009) for CKoUC test program on R B B C ... 64
Table 3-1: Origin, index properties and USCS classification of soils included in this thesis...95
Table 3-2: Mineralogy of soils included in this thesis... 96 Table 3-2: Water contents and salt concentrations at which resedimented samples are mixed to form a slurry...97
Table 4-1: Precision of the central data acquisition system and MADC device together with the corresponding resolutions for each device...121 Table 5-1: Summary of triaxial consolidation results ... 153 Table 5-2: Comparison of the accuracy of various compression models to measured behavior...154
Table 6-1: Summary of triaxial shear results...205 Table 6-2: Summary of strength parameters for soils investigated in this work...206
LIST OF FIGURES
Figure 2-1: Effective stress paths (Cambridge stress space) in undrained triaxial compression for Vallericca Clay. The onset and development of slip surfaces in specimens is also shown (Am orosi and Ram pello 2007)... 65
Figure 2-2: Virgin compression and critical state conditions for intact and resedimented specimens of Vallericca Clay (Amorosi and Rampello 2007)... 65
Figure 2-3: Normalized effective stress paths (MIT stress space) for RBBC at OCRs 1, 2 and 4 from CKOUC triaxial tests with a', = 10 MPa (Abdulhadi 2009)... 66 Figure 2-4: Normalized shear stress-strain responses for RBBC at OCRs 1, 2 and 4 from CKoUC triaxial tests with a', = 0.2 and 10 MPa (Abdulhadi 2009)... 66 Figure 2-5: Variation in normalized undrained strength with stress level for RBBC at OCRs = 1, 2 and 4 from CKOUC triaxial tests (Abdulhadi 2009)... 67 Figure 2-6: Value of KONC at the end of virgin consolidation versus stress level for RBBC from CKoUC triaxial tests (Abdulhadi 2009) ... 67 Figure 2-7: Normalized undrained secant Young's modulus versus axial strain for RBBC at OCRs 1, 2 and 4 from CKOUC triaxial tests at a',= 0.2 and 10 MPa (Abdulhadi 2009)... 68 Figure 2-8: Normalized shear induced pore pressure versus axial strain for RBBC at OCRs 1, 2 and 4 from CKOUC triaxial tests at a', = 0.2 and 10 MPa (Abdulhadi 2009)... 68 Figure 2-9: Deviatoric stress-strain response during undrained triaxial compression for a NC mud volcano clay (Y assir 1989)... 69 Figure 2-10: Effective stress paths (Cambridge stress space) followed during undrained triaxial compression of a NC mud volcano clay (Yassir 1989). The dashed red line is added to illustrate curvature of the failure envelope ... 69 Figure 2-11: Normalized excess pore pressure (ue/p'0) versus axial strain during undrained triaxial compression of a NC mud volcano clay (Yassir 1989)... 70 Figure 2-12: Normalized shear stress versus axial strain for CIUC tests on Kimmeridge Shale and Barents Sea Shale. Note that strain is given millistrain, mS (Gutierrez et al. 2008) ... 70 Figure 2-13: General forms of stress-strain response for clay shales (Petley 1999) ... 71 Figure 2-14: Conceptual form of failure envelopes for clays by Burland (1990) (from Abdulhadi 2 0 0 9 ) ... 7 1
Figure 2-15: Conceptual form of failure envelopes for hard clays and clay shales (Petley 1999). Note that the residual strength envelope would be better designated as the intrinsic critical state envelop e ... 72 Figure 2-16: Normalized undrained shear strength versus OCR for a SHANSEP test program on AGS Plastic Marine Clay (Koutsoftas and Ladd 1985)... 72 Figure 2-17: Effect of stress level on the SHANSEP S and m parameters for RBBC in triaxial com pression (Abdulhadi 2009)... 73 Figure 2-18: Relationship between undrained strength and consolidation stress for CIUC tests performed on resedimented London Clay. Where multiple tests were performed at a particular stress, the average value is plotted (Bishop et al. 1975)... 73 Figure 2-19: Variation in normalized undrained strength with stress level for Resedimented Ugnu Clay at OCR = 1 from CKOUC triaxial tests (from Jones 2010)... 74 Figure 2-20: Undrained strength ratios of various NC clays and silts plotted against plasticity index (adapted from Ladd 1991)... 74 Figure 2-21: Friction angles of various clays plotted against plasticity index (adapted from T erzaghi et al. 1996)... 75 Figure 2-22: Reconsolidation procedures for laboratory CKoU testing (Ladd 1991)... 75 Figure 2-24: Normalized undrained shear strength versus OCR for four clay shales (Gutierrez et al. 200 8) ... 76 Figure 2-25: Testing procedure for a multistage drained triaxial compression test to determine the significance of the au term in defining effective stress (Bishop and Skinner 1977)... 77 Figure 2-26: Typical multistage drained triaxial compression test carried out on Ham River sand with (03 - u) = 363 kPa throughout (Bishop and Skinner 1977)... 78 Figure 2-27: Various B-value responses over time as a function of saturation... 79 Figure 3-1: Plasticity chart showing the location of soils tested as part of this work... 98 Figure 3-2: Particle size distributions of soils tested as part of this work as determined from hydrom eter tests ... 98 Figure 3-3: Location of site U1322 in the Ursa Basin of the Gulf of Mexico (Reece et al. 2012)99 Figure 3-4: Tube samples of Ugnu Clay used for resedimentation (Jones 2010)... 99 Figure 3-5: Location of boreholes A-12 and A-20 in the Eugene Island region of the Gulf of M exico (B etts 2014) ... 100
Figure 3-6: Mixing of clay powder and water into a slurry... 100
Figure 3-7: Vacuuming of clay slurry to remove any entrapped air... 101
Figure 3-8: Setup of consolidometer with hanger system ... 102
Figure 3-9: Pneumatic actuator used for resedimenting samples to a', = 10 MPa... 103
Figure 3-10: Comparison of virgin compression curves for RBBC as measured in a typical CRS test and during resedimentation in consolidometers... 103
Figure 3-11: The ratio of vertical stresses within sample RS324 normalized with respect to the applied vertical stress as the sample undergoes resedimentation ... 104
Figure 3-12: Variation in the calculated coefficients of friction as a function of stress level for three samples undergoing resedim entation... 104
Figure 3-13: Comparison of compression behaviors measured during the Ko-consolidation phase of triaxial tests for RBBC samples prepared in 3.45 cm diameter ('Plexi.') and 6.35 cm diameter consolidom eters ('Stnd.') (Abdulhadi 2009)... 105
Figure 3-14: Comparison of shear stress-strain responses measured during the undrained shear phase of triaxial tests for RBBC samples prepared in 3.45 cm diameter ('Plexi.') and 6.35 cm diameter consolidometers ('Stnd.') (Abdulhadi 2009)... 105
Figure 4-1: Schematic of the standard automated triaxial testing system used in the MIT Geotechnical Engineering Laboratory (from Santagata, 1998)... 122
Figure 4-2: Cross-section of high pressure triaxial cell... 123
Figure 4-3: Cross-section and dimensions of high pressure triaxial cell. Note all dimensions are given in inches ... 124
Figure 4-4: High pressure triaxial cell within a temperature controlled enclosure... 125
Figure 4-5: The effect of cell fluid pressure on the output of a 2.2 kN Honeywell® S-beam load cell... 12 6 Figure 4-6: The effect of cell fluid pressure on the output of a 222 kN Futek@ LCM550 threaded rod load cell... 126
Figure 4-7: Cross-section of smooth end platen configuration... 127
Figure 4-8: Example of a specimen which failed during Ko-consolidation in the medium pressure cell by extruding around the top cap... 128
Figure 4-10: MADC device and 12 bit digital-to-analogue converter ported to a USB interface card ... 130 Figure 4-11: Control box containing a control card, servoamplifiers, a 50 V dc power supply and a fan ... 130 Figure 4-12: True and measurable B-values for triaxial systems. B-values are calculated assum ing N C RBBC ... ... 131 Figure 4-13: The ratio AVapp/AVshear versus stress level, where AVapp is the volume of pore fluid which flows from the specimen into the drainage lines at the point of undrained failure (due to compression of water in the drainage lines), and AVshar is the volume of fluid which must drain from the specimen to develop its drained strength. The figure is drawn assuming NC RBBC.. 131 Figure 4-14: Compression behavior of RBBC as measured using the low, medium and high pressure triaxial system s and a CRS device... 132 Figure 4-15: Change in Ko of RBBC during the consolidation phase of triaxial tests using the low, medium and high pressure triaxial systems ... 132 Figure 4-16 (a) and (b): Comparison of shear stress-strain responses measured during undrained shearing of NC RBBC with the low and medium pressure triaxial systems (a), and with the m edium and high pressure system s (b)... 133 Figure 4-17 (a) and (b): Comparison of friction angles of NC RBBC measured using the low and medium pressure triaxial systems (a), and using the medium and high pressure systems (b).... 133 Figure 4-18 (a) and (b): Comparison of shear induced pore pressures of NC RBBC measured using the low and medium pressure triaxial systems (a), and using the medium and high pressure sy stem s (b) ... 134 Figure 5-1: Compression data measured during the Ko-consolidation phase of triaxial tests.... 155 Figure 5-2: One dimensional virgin compression behavior of soils tested by the author... 155 Figure 5-3: One dimensional virgin compression behavior of all soils included in the research 156 Figure 5-4: Compression indices of all soils included in the research plotted as a function of liquid lim it and stress level... 156 Figure 5-5: Void ratios at specific stresses for all soils included in the research plotted as a function of liquid lim it... 157
Figure 5-6: The reduction in the mean particle orientation (from horizontal) of RBBC with increasing vertical effective stress. Multiple data points at a given o', reflect experimental scatter as well as differences in imaging techniques (adapted from Adams 2014)... 157 Figure 5-7: Permeabilities of smectite, illite and kaolinite clay minerals (adapted from Mesri and O lson 197 1)...158
Figure 5-8: Changes in the permeability of soils with porosity as measured during resedim entation and CR S tests...158 Figure 5-9: Permeability-porosity relationships for all of the soils included in the research. The experimental data are represented using regression lines. The limits of the regression lines represent the lim its of the m easured data... 159 Figure 5-10: Correlation between logio(ko.5) and liquid limit... 159 Figure 5-11: Correlation between the parameter y and liquid limit... 160 Figure 5-12: Comparison of measured permeabilities with those predicted using the liquid limit correlations. The predicted permeabilities all fall within ±5 times the measured values ... 160 Figure 5-13: Relationship between logio(ko.5) and clay fraction, where clay fraction is defined as the percentage of particles < 2 pm ... 161 Figure 5-14: Relationship between the parameter y and clay fraction, where clay fraction is defined as the percentage of particles < 2 pm ... 161 Figure 5-15: Values of logio(ko.5) from this work as well as from Pandian et al. (1995) plotted against liquid lim it ... 162 Figure 5-16: Values of y from this work as well as from Pandian et al. (1995) plotted against liqu id lim it... 162 Figure 5-17: Comparison of measured permeabilities with those predicted using the liquid limit correlations for samples of intact Boston Blue Clay and intact GOM Ursa Clay. The permeability data included in Figure 5-12 are shown in grey in the background... 163 Figure 5-18: The change in cvNc of soils over a very wide range of effective stress ... 163 Figure 5-19: The change in Ko measured during the consolidation phase of triaxial tests perform ed on R B B C ... 164 Figure 5-20: The change in Ko measured during the consolidation phase of selected triaxial tests ... 164 Figure 5-21: Values of KONC measured at the end of the consolidation phase of triaxial tests.. 165
Figure 5-22: Power-law regressions through the KONC data presented in Figure 5-21... 165
Figure 5-23: Correlation between the parameter Kojo and liquid limit... 166
Figure 5-24: Correlation between the parameter J and liquid limit... 166
Figure 5-25: The change in Ko measured during the swelling portion of triaxial tests... 167
Figure 5-26: The change in Ko measured during the swelling and recompression portions of a triaxial test perform ed on RLC ... 167
Figure 5-27: The change in Ko measured during the swelling and recompression portions of a triaxial test perform ed on RBBC ... 168
Figure 5-28: The change in Ko measured during the swelling and recompression portions of a triaxial test perform ed on RPC ... 168
Figure 5-29: The change in KO measured during the swelling and recompression portions of a triaxial test perform ed on RSFBM ... 169
Figure 6-1: Stress-strain responses measured during undrained shearing of NC RBBC with a wide range in the magnitude of pore pressures... 207
Figure 6-2: Friction angles measured during undrained shearing of NC RBBC and NC RGoM Ursa with a wide range in the magnitude of pore pressures ... 207
Figure 6-3: Stress-strain responses measured during undrained shearing of NC RBBC ... 208
Figure 6-4: Normalized stress-strain responses measured during undrained shearing of NC R B B C ... 208
Figure 6-5: Normalized stress-strain responses measured during undrained shearing of NC RBBC for axial strains up to 2 % ... 209
Figure 6-6: The variation in the undrained strength ratio of NC RBBC with stress level... 209
Figure 6-7: The variation in normalized secant Young's modulus with axial strain measured during undrained shearing of NC RBBC... 210
Figure 6-8: Normalized shear induced pore pressures measured during undrained shearing of NC R B B C ... 2 10 Figure 6-9: Effective stress paths followed during undrained shearing of NC RBBC over a wide range of consolidation stresses... 211 Figure 6-10: The variation in undrained strength ratio of RBBC as a function of pre-shear KoNC ... 2 1 1
Figure 6-11: Stress-strain responses measured during undrained shearing of RBBC at OCRs 1, 2, 4, and 8 for a low and high stress level... 212 Figure 6-12: The effect of OCR and stress level on the axial strain to undrained failure ... 212 Figure 6-13: The variation in the undrained strength ratio of RBBC with stress level at OCRs 1, 2, 4 and 8. Best-fit power-law functions are fitted through the experimental data... 213 Figure 6-14: The variation in the SHANSEP S and m parameters for RBBC as a function of stress level... 2 13 Figure 6-15: The variation in the undrained strength ratio of RBBC with stress level at OCRs 1, 2, 4 and 8. Best-fit power-law functions are fitted through the experimental data with the constraint that T = -0.025... 214 Figure 6-16: Equivalent values of Si for OC RBBC as a function of OCR ... 214 Figure 6-17: The variation in normalized secant Young's modulus with axial strain measured during undrained shearing of RBBC at OCRs 1, 2, 4, and 8 ... 215 Figure 6-18: The variation in normalized secant Young's modulus as a function of OCR and
consolidation stress level for RBBC. The author's measured data define Eu/a'v, at Ea = 0.01 %, while the relationship of Santagata (1998) defines Eu/a', at its initial maximum value ... 215 Figure 6-19: Normalized shear induced pore pressures measured during undrained shearing of RBBC at OCRs 1,2, 4, and 8 for a low and high stress level ... 216 Figure 6-20: Effective stress paths followed during undrained shearing of RBBC at OCRs 1, 2, 4, and 8 for a low and high stress level... 216 Figure 6-21: The variation in the critical state friction angle of RBBC with stress level... 217 Figure 6-22: Mean effective stresses and shear stresses at critical state for RBBC. The figure shows the Ko virgin compression behavior of the soil as determined from representative triaxial tests. Results from two triaxial extension tests are also included... 217 Figure 6-23: Normalized stress-strain responses measured during undrained shearing of NC RPC ... 2 18 Figure 6-24: Normalized stress-strain responses measured during undrained shearing of NC RPC for axial strains up to 2 % ... 218 Figure 6-25: The variation in normalized secant Young's modulus with axial strain measured during undrained shearing of N C RPC ... 219
Figure 6-26: Normalized shear induced pore pressures measured during undrained shearing of N C R P C ... 2 19 Figure 6-27: Effective stress paths followed during undrained shearing of NC RPC... 220 Figure 6-28: Normalized stress-strain responses measured during undrained shearing of NC R G oM U rsa...220
Figure 6-29: Normalized stress-strain responses measured during undrained shearing of NC RGoM Ursa for axial strains up to 2 %... 221 Figure 6-30: The variation in normalized secant Young's modulus with axial strain measured during undrained shearing of NC RGoM Ursa... 221 Figure 6-31: Normalized shear induced pore pressures measured during undrained shearing of N C R G oM U rsa ... 222 Figure 6-32: Effective stress paths followed during undrained shearing of NC RGoM Ursa.... 222 Figure 6-33: Normalized stress-strain responses measured during undrained shearing of NC RUC ... ... ... ... 22 3 Figure 6-34: Normalized stress-strain responses measured during undrained shearing of NC RUC for axial strains up to 2 % ... 223 Figure 6-35: The variation in normalized secant Young's modulus with axial strain measured during undrained shearing of NC RUC ... 224 Figure 6-36: Normalized shear induced pore pressures measured during undrained shearing of N C R U C ... ... ... 224 Figure 6-37: Effective stress paths followed during undrained shearing of NC RUC ... 225 Figure 6-38: Normalized stress-strain responses measured during undrained shearing of NC R SF B M ... 225 Figure 6-39: Normalized stress-strain responses measured during undrained shearing of NC R SFBM for axial strains up to 2 % ... 226 Figure 6-40: The variation in normalized secant Young's modulus with axial strain measured during undrained shearing of NC RSFBM ... 226 Figure 6-41: Normalized shear induced pore pressures measured during undrained shearing of N C R SFB M ... 227 Figure 6-42: Effective stress paths followed during undrained shearing of NC RSFBM ... 227
Figure 6-43: Normalized stress-strain responses measured during undrained shearing of NC RLC
over a wide range of consolidation stresses... 228
Figure 6-44: Normalized stress-strain responses measured during undrained shearing of NC RLC over a wide range of consolidation stresses for axial strains up to 2 %... 228
Figure 6-45: The variation in normalized secant Young's modulus with axial strain measured during undrained shearing of NC RLC ... 229
Figure 6-46: Normalized shear induced pore pressures measured during undrained shearing of NC RLC over a wide range of consolidation stresses... 229
Figure 6-47: Effective stress paths followed during undrained shearing of NC RLC over a wide range of consolidation stresses... 230
Figure 6-48: Undrained strength ratios of soils plotted as a function of stress level... 230
Figure 6-49: Regression lines for the experimental data presented in Figure 6-48. The regression lines are of the form su/u 'vc = SI(1000c'P [Mp])T... 231
Figure 6-50: Correlation between the parameter Si and liquid limit... 231
Figure 6-51: Correlations between the parameters T and B with liquid limit ... 232
Figure 6-52: Critical state friction angles of soils plotted as a function of stress level... 232
Figure 6-53: Regression lines for the experimental data presented in Figure 6-52. The regression lines are of the form (p',, = A(0.001a'p [Na])B...233
Figure 6-54: Correlation between the parameter A and liquid limit... 233
Figure 6-55: Normalized secant Young's moduli of soils measured at &a = 0.01 % and OCR = 1. The relationship for FA/a',c developed for NC RBBC by Santagata (1998) is also plotted. 234 Figure 6-56: Relationship between the pre-shear KONC and undrained strength ratio of soils ... 234
Figure 6-57: Correlation between the pre-shear KONC and friction angle of soils... 235
Figure 6-58: Mean effective stresses and shear stresses at critical state for various soils... 235
Figure 6-59: Critical state lines of mean effective stress and shear stress for various soils... 236
Figure 6-60: Normalized stress-strain responses measured during undrained shearing of NC RBBC in triaxial extension mode of shear at a low and high consolidation stress level... 236
Figure 6-61: Normalized shear induced pore pressures measured during undrained shearing of NC RBBC in triaxial extension mode of shear at a low and high consolidation stress level... 237
Figure 6-62: Effective stress paths followed during undrained shearing of NC RBBC in triaxial extension mode of shear at a low and high consolidation stress level... 237
Figure 6-63: The variation in the undrained strength ratio of NC RBBC with consolidation stress level for TC, DSS and TE m odes of shear... 238 Figure 6-64: The variation in the critical state friction angle of RBBC with consolidation stress level for TC, DSS and TE modes of shear... 238 Figure 6-65: Interpreted yield surfaces of RBBC at low and high consolidation stresses based on the results of TE and TC tests performed on the soil at OCR = 1 ... 239
LIST OF SYMBOLS QBASIC BBC CUC CKoU CKoUC CKoUDSS CKoUE CH CL CL-ML CR CRS CSL DSS GOM LVDT MH MIT NC OC OCR PSC PSE PVA R
Quick Beginner's All-purpose Symbolic Instruction Code Boston Blue Clay
Isotropically Consolidated Undrained Triaxial Compression Test Ko-Consolidated Undrained Triaxial Test
Ko-Consolidated Undrained Triaxial Compression Test Ko-Consolidated Undrained Direct Simple Shear Test Ko-Consolidated Undrained Triaxial Extension Test High Plasticity Clay
Low Plasticity Clay Silty clay
Virgin Compression Ratio Constant Rate of Strain Critical State Line Direct Simple Shear Gulf of Mexico
Linear Variable Differential Transformer Elastic silt
Massachusetts Institute of Technology Normally Consolidated
Overconsolidated Overconsolidation Ratio Plane Strain Compression Plane Strain Extension Pressure-Volume Actuator Resedimented
RBBC RGoM El RGoM Ursa RLC RPC RSFBM RUC SHANSEP SR SS TC TE TX USCS VCL Acyrindrical A0 Ao Aparaboic B Bmeas Btrue C
Resedimented Boston Blue Clay
Resedimented Gulf of Mexico Eugene Island Clay Resedimented Gulf of Mexico Ursa Clay
Resedimented London Clay Resedimented Presumpscot Clay Resedimented San Francisco Bay Mud Resedimented Ugnu Clay
Stress History and Normalized Soil Engineering Properties Swelling Ratio
Skibbereen Silt Triaxial Compression Triaxial Extension Triaxial
Unified Soil Classification System Virgin Compression Line
Right cylinder area correction for a specimen Skempton's pore pressure parameter A at failure Initial specimen area
Parabolic area correction for a specimen Skempton's pore pressure parameter B
Measurable/observable B-value in a triaxial test True B-value of a soil specimen
Compressibility of a soil specimen with respect to a change in consolidation stress
Compression index Cc
CL Compressibility of the drainage lines and valves in a triaxial cell
CM Compressibility of a pore pressure transducer
CS Compressibility of the solid material(s) forming soil particles CW Compressibility of the pore fluid within a specimen
cv Vertical coefficient of consolidation
c' Apparent cohesion intercept
E Young's modulus
Eu, EuMAx Undrained secant Young's modulus, maximum undrained secant Young's modulus
e Void ratio
Gs Specific gravity
I, Plasticity index
K Lateral stress ratio
Ko Coefficient of lateral earth pressure at rest
KONC Coefficient of lateral earth pressure at rest for NC soil
Kos Coefficient of lateral earth pressure at rest for a soil undergoing swelling KOR Coefficient of lateral earth pressure at rest for a soil undergoing
recompression
k Vertical (bedding perpendicular) permeability
ko.5 Vertical (bedding perpendicular) permeability at a porosity of 0.5
m Exponent in the SHANSEP equation describing the change in normalized strength with OCR
n porosity, or exponent describing the change in Ko with OCR p' Average effective stress, %(a'a + a'r)
p 'm Mean effective stress, Y3(a'1 + 2a'3)
q Shear stress, (av - Gh)
r2 Regression coefficient
su Undrained shear strength
t Time
u Pore pressure
Ub Back-pressure
Ue Excess pore pressure
us Shear induced pore pressure
VL Volume of fluid in the drainage lines, valves and porous stones of a triaxial cell
V volume of a soil specimen
v specific volume
wC Water content
WL Liquid limit
WP Plastic limit
AVapp The volume of pore fluid which flows from a specimen into the drainage lines at the point of undrained failure
AVshear The volume of pore fluid which must drain from a soil specimen in order to fully develop its drained strength
& Strain
Ca Axial strain
sE Axial strain at shear failure
Ev Volume strain
Slope of [log] permeability-porosity relationship e'C, Secant critical state friction angle
P'p Secant friction angle at peak shear strength
o' P Preconsolidation pressure
S'VY Vertical effective yield stress
01, 02, Y3 Major, intermediate and minor principal stresses
0oct Octahedral stress, /3(01 + 203) (same as total mean stress)
1
INTRODUCTION
1.1 PROBLEM STATEMENT
The mechanical behaviour of fine-grained soils is now relatively well understood for the range of stresses conventionally encountered in geotechnical engineering practice. Traditionally, the geotechnical engineering discipline has been focused on applications involving stresses less than about 1 MPa, with behavior at higher stresses being of much less concern. On the other hand, the field of rock mechanics has traditionally been associated with the study of lithified materials, often at pressures in excess of 100 MPa. As a result, the mechanical behavior of intermediatory materials, which include hard clays and unlithified or weakly lithified soft clay-shales, is far less well understood. Such materials are the most abundant in the uppermost 5 km of the Earth's crust (Petley 1999). In recent years a desire to gain a deeper understanding of the behavior of these materials has been driven primarily by the petroleum industry for applications in hydrocarbon reservoir development.
This thesis involves an extensive experimental investigation of the compressibility, permeability and shear strength behavior of fine-grained sediments over the stress range of 0.1 -100 MPa. The work focuses particularly on strength behavior, and examines the friction angle and undrained strength properties of a variety of fine-grained materials from a wide range of geologic backgrounds. The work also examines the systematic variation of these properties with effective stress level, and demonstrates that the degree to which these strength properties vary as a function of stress is closely related to a soil's composition.
The overall goal of this work is to increase understanding of the consolidation and shearing behavior of fine-grained sediments at stresses traditionally encountered in geotechnical engineering practice but also at much higher stresses. The research aims to make a consistent link between the mechanical behavior of soft soils and unlithified soft rock.
1.2 THESIS SCOPE AND OBJECTIVES
The research presented in this thesis has three main objectives. The first and primary objective is to examine the shear strength behavior of a variety of fine-grained sediments over the stress range of 0.1 - 100 MPa and to determine the effects of soil composition, effective stress level and overconsolidation ratio (OCR) on this behavior. This is achieved through a program of Ko-consolidated undrained triaxial tests on fully saturated specimens possessing varying degrees of mechanical consolidation. The vast majority of tests are performed in triaxial compression mode of shear and all are performed at room temperature. Test specimens are produced by resedimenting the natural source materials in the laboratory. Resedimentation
allows one to produce saturated samples of identical composition from source material with any desired preconsolidation stress or porosity, something which would be impossible with the use of intact samples.
A secondary objective of the research is to examine the principle of effective stress in relation to the shear strength of fine-grained soils. In particular, to investigate whether there is any effect of interparticle contact area on how effective stress should be defined at the pressures relevant to the research. The conventional Terzaghi definition of effective stress, i.e. total stress minus pore water pressure, assumes that there is no effect of interparticle contact area on effective stress, or at least that any such effect is negligible. While this assumption has long been shown to be valid at pressures typically encountered in geotechnical engineering practice, validation of its applicability for fine-grained soils at the pressures encountered in this research has not previously been demonstrated. It was therefore necessary to investigate if the conventional definition of effective stress would be appropriate to apply in the analysis of high pressure triaxial tests such as performed in this research.
The third objective of the research is to develop the necessary equipment for testing conventional sized specimens (3.5 cm diameter and 8.1 cm height) at effective stresses up to 100 MPa. Existing low and medium pressure triaxial systems in the MIT Geotechnical Engineering Laboratory only enable triaxial testing at effective stresses up to 2 MPa and 10 MPa respectively. A new high pressure triaxial system is custom designed and built to achieve this objective. The new system consists of a high pressure triaxial cell with internal deviator load measurement, pressure volume actuators to generate the necessary cell, pore and load frame pressures, as well
as a new control system to allow for continuous automated test control. The system has the ability to perform both Ko or stress path consolidation prior to shearing.
The work presented in this thesis represents one element of the wider research objectives of the UT GeoFluids Consortium, a joint venture between the Massachusetts Institute of Technology and the University of Texas at Austin. The high level objective of the GeoFluids group is "to study the state and evolution of pressure, stress, deformation and fluid migration
through experiments, theoretical analysis, and field study". The author's research focuses solely
on mechanical behavior determined through experimentation, and provides a baseline behavior for use in analytical geomechanical models.
1.3 ORGANIZATION OF THE THESIS
This thesis is organized into seven chapters, each of which has a separate and distinct function, as given below.
Chapter 2 provides a literature review of important background information relevant to the research. The aim is to establish an overall picture of the current level of knowledge regarding the shear strength behaviour of unlithified fine-grained sediments at stresses higher than those typically encountered in geotechnical engineering, i.e. > 1 MPa. The effects of natural micro-structure, particularly cementation due to diagenesis, on strength properties are discussed. The concept of normalized soil behavior is then introduced, including the SHANSEP normalization procedure. Chapter 2 also provides a review of the principle of effective stress, including previous studies which have examined the applicability of the standard Terzaghi definition of effective stress at high pressures. Finally, Chapter 2 discusses the issue of specimen saturation and introduces the concept of a B-value.
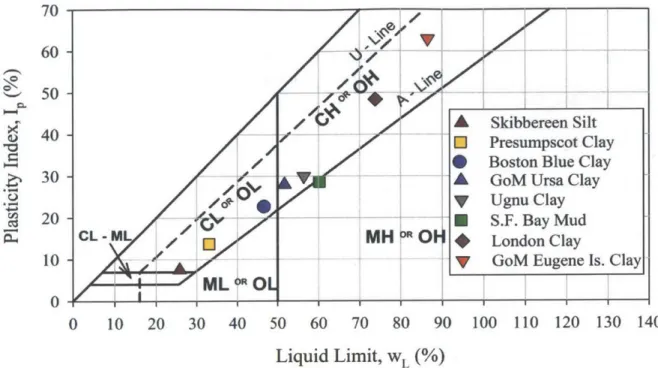
Chapter 3 discusses the origin and index properties of soils tested as part of this work, including Presumpscot Clay, Boston Blue Clay, Ursa Clay, Ugnu Clay, San Francisco Bay Mud, London Clay, Skibbereen Silt and Eugene Island Clay. These fine-grained soils cover a very wide range in terms of composition, geologic origin and mechanical properties. Chapter 3 also provides a detailed description of the resedimentation process, including the processing method
used for the various source materials, a brief background of resedimentation at MIT, the procedure and equipment used as part of this work, and an evaluation of sample uniformity.
Chapter 4 describes the equipment and procedures used in the triaxial testing program carried out during the course of the research. A description is given of the three different automated triaxial systems designed for low, medium, and high stresses that were used throughout the testing program. A more detailed discussion is provided of the high pressure triaxial system which was developed as part of this work, including a description of the high pressure cell, pressure volume actuators, automated control system and data acquisition. The issue of apparatus compressibility in relation to the pore fluid drainage system and its impact on measurements of pore pressure is also addressed. In addition, an evaluation is given of the reproducibility and reliability of test results obtained using the three types of triaxial system.
Chapter 5 presents the consolidation properties of soils as determined from the results of resedimentation, CRS tests and the Ko-consolidation phase of triaxial tests. The chapter begins by presenting the one dimensional virgin compression behavior of the soils tested, and describes how this behavior changes as a function of soil type and stress level. The permeability behavior of the soils is then presented and it is shown that the permeability-porosity relationships of wide range of different soils can be successfully correlated to liquid limit, liquid limit being used as a convenient indicator of soil composition. Comparisons made between the measured permeabilities of intact samples of Boston Blue Clay and Gulf of Mexico Ursa Clay against those predicted using the liquid limit correlations are used to demonstrate the value of the correlations for predicting in situ permeability. Data on the coefficient of consolidation for the different soils is also presented, together with a discussion of how this value changes over a very wide range of effective stresses. Finally, Chapter 5 presents data on the Ko value of soils as determined from triaxial tests and discusses the dependence of Ko on soil type, stress level and OCR.
Chapter 6 presents results obtained during the shearing phase of triaxial tests. First, the results of tests carried out specifically to investigate the principal of effective stress are presented. Following this, the shear stress - strain and effective stress behavior observed for each soil during undrained shearing is discussed separately. The effect of overconsolidation on undrained shear response is presented for one soil, RBBC. When viewed over a significant stress
range, is it shown that the critical state friction angle and undrained strength ratio of most soils vary consistently as a function of effective stress level. Comparisons are then made between the different soils, where it is shown that variations in strength properties are closely related to soil composition. Correlations are presented which allow a reasonable estimate of the drained or undrained strength of a fine-grained soil in triaxial compression to obtained from liquid limit together with a knowledge of the in situ effective stress and OCR. Finally, the important link between undrained strength ratio and the pre-shear value of Ko for normally consolidated soil is
discussed.
Chapter 7 summarizes the main conclusions which can be drawn from the results of the research. A hypothesis is proposed to explain the strength behavior of soils as presented in
2 BACKGROUND
2.1 INTRODUCTION
The mechanical behaviour of fine-grained soils at effective stresses typically encountered in geotechnical engineering applications, below about 2 MPa, is relatively well understood and documented throughout the literature. However, considerably less is known about the behaviour of these soils at much higher stresses. Recent work by Abdulhadi (2009) involved an extensive experimental program to examine systematically the strength properties of resedimented clay as a function of both stress level and OCR for vertical consolidation stresses (a',e) up to 10 MPa. Above this stress level, however, there has been no similar experimental program previously carried out to examine systematically the behaviour of clay as a function of both stress level and OCR.
This chapter begins with a review of previous experimental studies carried out to examine the behaviour of both intact and resedimented hard clays in triaxial compression at high stresses. Particular attention is paid to the findings of Abdulhadi (2009).
In Section 2.3 emphasis is placed on the effects of natural micro-structure, particularly cementation due to diagenesis, on the behaviour of intact fine-grained soils at high stresses. These materials are often regarded as clay shales. The brittle-ductile transition in stress-strain response often experienced by these materials is discussed along with some basic models that have been proposed to define their behaviour.
Section 2.4 reviews our current understanding of the normalized behaviour of fine-grained soils at high stresses. The SHANSEP normalization procedure and its applicability at high stresses are discussed. Previous attempts to relate normalized strengths to soil index properties such as the Atterberg limits are also mentioned.
Section 2.5 presents a discussion on the concept of effective stress as well as on assumptions regarding its definition for stresses much higher than those commonly encountered in soil mechanics.
The research presented in this thesis only considers materials which are fully saturated with a single pore fluid. Section 2.6 discusses saturation together with the issue of pore pressure generation in response to an increase in applied boundary stresses. These are important concerns for laboratory testing of any type of porous material, particularly at the stress range encountered in this research.
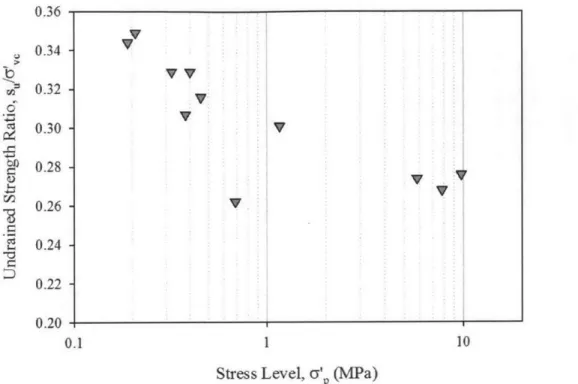
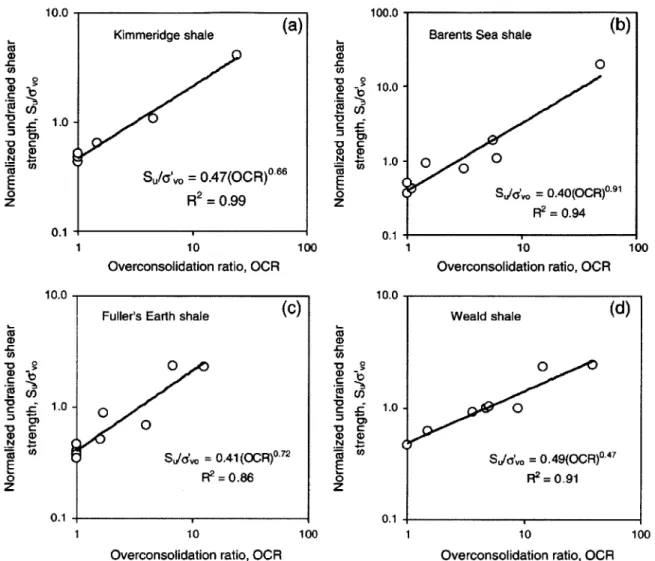
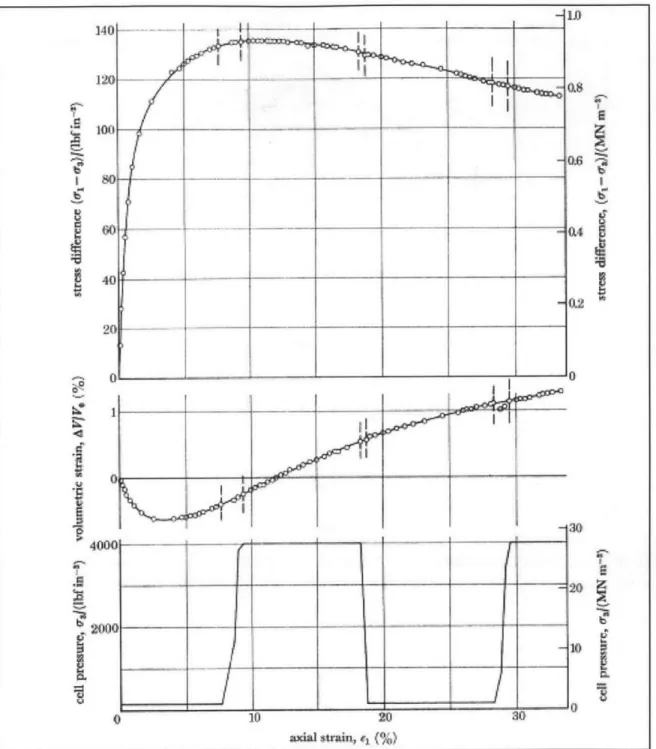
2.2 PREVIOUS STUDIES OF HARD CLAYS IN TRIAXIAL COMPRESSION One of the earliest programs of triaxial testing at relatively high stresses is that of Bishop et al. (1965) on London Clay from Ashford Common for a', up to approximately 7.5 MPa. Boom clay has been investigated by both Horseman et al. (1993) and Taylor and Coop (1993) for a'v, up to 5.4 MPa. Petley et al. (1993) tested Kimmeridge Clay up to 10.6 MPa and Eocene North Sea Shale up to 16 MPa, and compared their undrained shear deformation behaviour with that of chalk. Petley (1999) tested London Clay up to 30.1 MPa in an effort to define the form of the peak strength envelope. Marsden et al. (1992) conducted tests on Weald Shale and Fullers Earth up to 23 MPa and on London Clay up to 8 MPa with the objective of making correlations between petrophysical and mineralogical properties and the measured mechanical behaviour. More recently, Gutierrez et al. (2008) tested Kimmeridge Clay up to 30 MPa and Barents Sea Shale up to 63 MPa as part of an investigation into normalized behaviour.
All of the studies mentioned above involved isotropically consolidated undrained triaxial compression (CIUC) tests on unweathered intact samples. Obtaining intact samples generally involves some sampling disturbance, even with the use of careful sampling procedures, and ideally large diameter or block samples should be used. However, this is generally too expensive or infeasible, particularly in the case of deep samples or samples from the deep ocean. Even more important, the use of intact samples rather than resedimented ones does not allow one to control the stress history, i.e. preconsolidation pressure (a'p), of the sample. As a result, intact samples with a high a'p require a large consolidation stress to reach the normally consolidated range while samples with a low o', require the development of large strains in order to test at high stresses. Combined, these factors make a systematic investigation of the mechanical behaviour of any soil as a function of both stress level and OCR practically impossible. It is important to note that the above studies also involved isotropic consolidation of test specimens
prior to shearing. Unlike one-dimensional (i.e. Ko) consolidation which best mimics in situ conditions, isotropic consolidation is a very rare occurrence in nature and can produce a significantly misleading behaviour in laboratory shear testing. A compilation of a large variety soft clays in both intact and resedimented states by Belviso et al. (2001) illustrates the large difference in undrained strength which some clays exhibit depending on the laboratory consolidation procedure used. For consolidation to the same G'v, isotropically consolidated specimens will generally have a higher undrained strength (Resedimented Boston Blue Clay is a notable exception). This is due to the fact that, assuming Ko < 1, the mean effective stress prior to shearing will be larger, thereby producing a lower water content/void ratio and a higher undrained strength. On the other hand, due to the anisotropic micro-structure possessed by soil in a Ko condition, Ko consolidated specimens will generally exhibit a higher undrained strength than isotropically consolidated specimens when consolidated to the same mean effective stress. Isotropic consolidation can also produce a very misleading stress-strain response during shearing (Ladd and Varallyay 1965). For samples of resedimented clay and low OCR intact clay in particular, isotropic consolidation can result in a much larger strain to failure (Ef) and a less
distinct peak shear strength compared to samples subjected to Ko consolidation.
Amorosi and Rampello (2007) investigated the behaviour of Vallericca Clay, a structured stiff clay of marine origin from Italy, using a series isotropically and anisotropically consolidated triaxial compression tests for a'vc up to 11 MPa and 6.75 MPa respectively. These tests were performed on intact samples, though some isotropically consolidated tests were also performed on resedimented samples for a'7 up to approximately 1.2 MPa. Specimens were sheared under both drained and undrained conditions. Figure 2-1 shows some typical effective stress paths in Cambridge stress space' for anisotropically consolidated intact specimens sheared undrained in both the normally consolidated (NC) and overconsolidated (OC) range. Amorosi and Rampello reported that, under both isotropic and anisotropic consolidation to stresses greater than a'p, major and irreversible damage to the soil's initial interparticle bonding (likely weak cementation) was produced. While significant changes to the initial soil fabric (where fabric refers to the arrangement of soil particles) also occurred during isotropic consolidation to stresses beyond a'p, only minor changes to the soil's fabric were induced by anisotropic consolidation to stresses
beyond a', under nearly Ko conditions. It was proposed that, unlike for purely cemented soils, the natural fabric of the Vallericca Clay gave the intact specimens an undrained strength much higher than the resedimented counterparts and this difference was not eliminated by consolidation to high stresses nor by shearing. This can be seen in Figure 2-2, where stress paths for both drained and undrained shearing of intact and resedimented specimens are plotted in specific volume (v = 1+e) versus mean stress space. The end points of the tests where a constant shear stress was observed with continued straining produce a critical state line (CSL). A single CSL can be defined for the intact specimens irrespective of their isotropic or anisotropic consolidation histories. The critical states observed for resedimented specimens define a CSL significantly below the one associated with the intact specimens, though characterized by the same slope A = 0.148. Since the intact and resedimented CSLs were found to be parallel it was concluded, that over the stress range investigated, the natural Vallericca Clay does not tend to the reference state defined by the corresponding resedimented material. Amorosi and Rampello attributed the variation in behavior between the intact and resedimented samples to a difference in soil fabric. Images taken of the fabric of the natural clay showed a prevalence of edge-to-face contacts with average intra-aggregate pore spaces of 1 - 3 Pm and inter-aggregate pores of 3 - 6 gm. In contrast, the resedimented material displayed mostly face-to-face contacts with more closely spaced aggregates. However, Vallericca Clay also contains an unusually large proportion of microfossils, giving the clay a calcium carbonate content of about 30%. It is possible that these microfossils provide the intact material with additional strength which is destroyed by the resedimentation process, though not by shearing in the triaxial device.
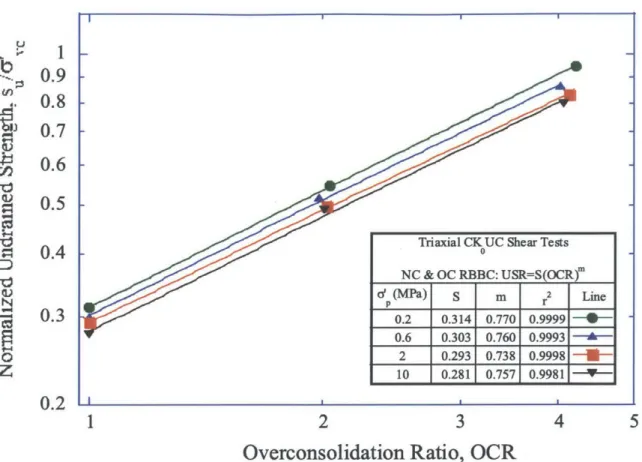
One of the most comprehensive and systematic investigations of the mechanical behaviour of a clay for a', up to 10 MPa was carried out by Abdulhadi (2009). Abdulhadi tested Resedimented Boston Blue Clay (RBBC) through a series of CKOUC tests. Some of the main findings of this investigation are summarized in Table 2-1, which shows the separate effects of varying OCR and stress level on the behaviour of RBBC. Regarding the effect of increasing OCR, the findings are in agreement with previous well established knowledge of behaviour of clays, e.g. Burland (1990) and Amorosi and Rampello (2007), as well as with previous work carried out on RBBC, e.g. Sheahan (1991), Santagata (1994) and Santagata (1998). The increase in normalized undrained strength (s/a',, a.k.a. undrained strength ratio) associated with increasing OCR is due to the dilative response of OC clay during shearing. As a result of
dilation, OC samples tend to generate lower excess pore pressures and fail at an effective stress higher than the consolidation stress. On the other hand, NC samples exhibit entirely contractive behaviour during shearing as positive excess pore pressures are produced and tend to fail at an effective stress much lower than the consolidation stress. Figure 2-3 shows effective stress paths for specimens of RBBC at OCRs 1, 2 and 4 in MIT stress space2 normalized to the same a', of
10 MPa. As shown in Figure 2-4, increasing OCR also leads to a more ductile response as the strain to failure increases and post-peak strain softening decreases. An increase in the value of Ko and normalized undrained secant Young's Modulus (E,/a',e) with increasing OCR, as well as a decreasing A parameter (Skempton 1954) at failure (Af) with increasing OCR, are also results that are to be expected for clay.
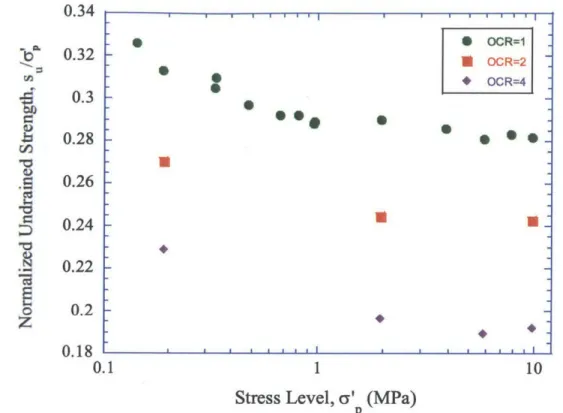
Unlike the effect of OCR, the effect of stress level on the mechanical properties of clay is less well established. Significantly, Abdulhadi (2009) found that increasing consolidation stress causes a reduction in normalized undrained strength. Figure 2-5 clearly illustrates the consistent trend of decreasing normalized strength with increasing stress level for each OCR tested. Most of the decrease occurs at low stresses < 1 MPa. This reduction in normalized strength with stress corresponds with an increase in the normally consolidated value of Ko (KoNC) at the end of virgin consolidation as stress level increases, as shown in Figure 2-6. Abdulhadi suggested that the link between normalized undrained strength and Ko is more pronounced in the NC clay than the OC clay, since for the NC clay a relatively small shear stress increment is required to attain the peak stress state from the pre-shear stress state. At a given stress level, the stress paths for each OCR approach a common failure envelope at large strains, as shown in Figure 2-3 for y', = 10 MPa. However, while the failure envelope at 10 MPa has a critical state friction angle p'cs = 26.80 and normalized cohesion intercept c'/a',= 0.032, the failure envelope at 0.2 MPa has p',
= 33.7 and c'/a', = 0.018. This implies a failure envelope having significant curvature. The
secant friction angle at peak shear strength (p'p) decreases with increasing stress level for the OC clay, which is expected given that p', coincides with p'c,. However, for the NC clay P'p is unrelated p'cs and the value of 9', is found to be unaffected by stress level. Increasing consolidation stress also produces a more ductile response during shearing as strain to failure increases and post-peak strain softening decreases for a given OCR, a behaviour illustrated in
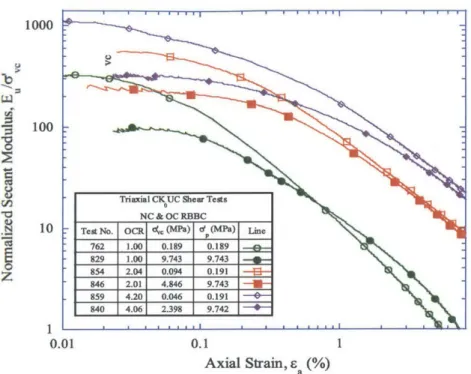
Figure 2-4. The normalized Young's Modulus also displays stress level dependence, decreasing in magnitude with increasing consolidation stress for each OCR tested. This is illustrated in Figure 2-7, where it can also be seen that the high pressure tests show a larger strain range of linear behaviour than the low pressure tests. The reduction in normalized undrained strength with increasing stress level found by Abdulhadi (2009) is discussed further in Section 2.4.2.
One might suspect that the decrease in normalized strength with increasing stress level found by Abdulhadi (2009) would be associated with an increase in excess pore pressure (ue) at failure. Significantly, however, Abdulhadi (2009) found that as consolidation stress increases, the normalized excess pore pressures generated during undrained shearing decreased for each OCR tested. To isolate the pore pressure response due to changes in shear stress alone, the shear induced pore pressure (us = Au - Aoct)3 provides a better understanding of pore pressure generation during undrained shearing as it essentially removes the effect of total stress path. Note that unlike ue, u, is a soil property. Figure 2-8 shows the normalized shear induced pore pressure
(u/a',) generation with strain for RBBC at OCRs 1, 2, and 4 at low and high stress levels (a', =
0.2 and 10 MPa). In all cases the shear induced pore pressures initially increase, indicating contractive behaviour. The NC clay remains contractive throughout shearing, while the OCR = 2 clay changes to slightly dilative behaviour before contracting again with increasing strain. The shear induced pore pressures decrease beyond 0.5% strain for the OCR = 4 clay which ultimately displays dilative behaviour with continued shearing. As the stress level increases, the shear induced pore pressures decrease for the NC and OCR = 2 clay while for the OCR = 4 clay the pore pressures instead increase, i.e. become less negative.
Some of the very limited triaxial compression testing carried out on resedimented clays for a', higher than the 10 MPa achieved by Abdulhadi (2009) includes William (2007), Yassir (1989), Berre (1992) and Bishop et al. (1975)4. William (2007) tested both resedimented and intact Bringelly Shale from Sydney for o', up to 60 MPa. However, these tests involved incremental isotropic consolidation of test specimens prior to drained shearing. Only a limited number of tests were performed on the resedimented material and the results are of little
3 Octahedral stress (aoC,) is the same as total mean stress (p,). For conventional triaxial compression testing where there is no change in cell pressure during shearing, i.e. Aa3 = 0, u, is simply equal to Au - MAAav