HAL Id: cirad-00845617
http://hal.cirad.fr/cirad-00845617
Submitted on 17 Jul 2013
HAL is a multi-disciplinary open access
archive for the deposit and dissemination of
sci-entific research documents, whether they are
pub-lished or not. The documents may come from
teaching and research institutions in France or
abroad, or from public or private research centers.
L’archive ouverte pluridisciplinaire HAL, est
destinée au dépôt et à la diffusion de documents
scientifiques de niveau recherche, publiés ou non,
émanant des établissements d’enseignement et de
recherche français ou étrangers, des laboratoires
publics ou privés.
Development and characterization of microsatellite
markers in Tectona grandis (Linn. f)
Daniel Verhaegen, Daniel Ofri, Inza Fofana, Mireille Poitel, Alexandre Vaillant
To cite this version:
Daniel Verhaegen, Daniel Ofri, Inza Fofana, Mireille Poitel, Alexandre Vaillant. Development and
characterization of microsatellite markers in Tectona grandis (Linn. f). Molecular Ecology Notes,
Wiley-Blackwell, 2005, 5, pp.945-947. �cirad-00845617�
Molecular Ecology Notes (2005) 5, 945–947 doi: 10.1111/j.1471-8286.2005.01124.x
© 2005 Blackwell Publishing Ltd
Blackwell Publishing, Ltd.
P R I M E R N O T E
Development and characterization of microsatellite markers
in
Tectona grandis
(Linn. f)
D A N I E L V E R H A E G E N ,* D A N I E L O F O R I ,† I N Z A F O F A N A ,‡ M I R E I L L E P O I T E L * and A L E X A N D R E V A I L L A N T *
*CIRAD, Forestry Department, Research Unit ‘Genetic Diversity and Breeding of Forest Trees’, Baillarguet TA10/C, 34398 Montpellier cedex 5, France, †FORIG Forestry Research Institute of Ghana UST, PO Box 63 Kumasi, Ghana, ‡SODEFOR Forest Development Society BP 3770 Abidjan 01, Côte d’Ivoire
Abstract
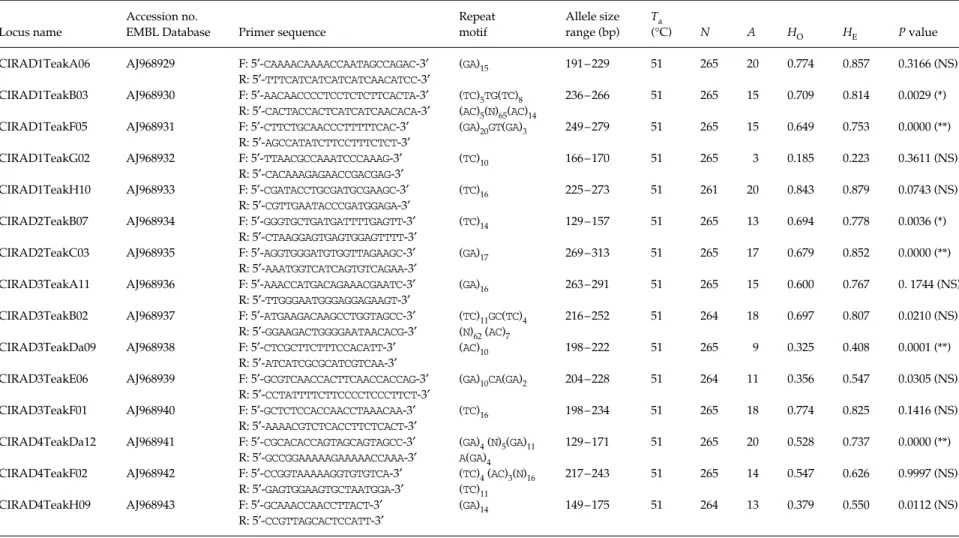
Teak (Tectona grandis Linn. f) is a hardwood species of worldwide reputation. It occurs naturally in India, Thailand, Myanmar and Laos. Fifteen highly polymorphic microsatellite loci were developed from a genomic library enriched for AG/ TC repeats. Primers to amplify these loci were tested on 265 individual trees from different teak populations. An average of 14.7 alleles per locus were detected and expected heterozygosity ranged from 0.223 to 0.879. These loci constitute a powerful tool in investigating the mating system, gene flow, parentage analysis and population dynamics for use in sustainable management of teak forests and for in situ conservation purposes.
Keywords: conservation, genetic diversity, microsatellite, Tectona grandis Received 27 May 2005; revision accepted 30 June 2005
The natural distribution of Tectona grandis covers parts of India, Myanmar, Thailand and Laos. Appreciated as an extraordinarily durable building timber, teak is now coveted worldwide. Currently there is a serious deficit in timber resources and, consequently, harvesting of teak from natural forests is banned or severely restricted in all the countries of its natural range. In spite of its great interest, no nuclear microsatellite markers have yet been identified for this species. This study describes the develop-ment of 15 microsatellite markers for Tectona grandis.
Our genomic library was constructed using a DNA sample from an individual belonging to one Tanzanian population. Total genomic DNA was extracted from 300 mg of freeze-dried leaf sample using standard methods (Saghai-Maroof et al. 1984). Ten micrograms of teak puri-fied DNA were used to construct a (GA)n repeat enriched genomic library, according to the protocol of Billote et al. (1999). DNA fragments containing (GA) microsatellite sequences were selected using biotin-labelled microsatel-lite oligoprobe and streptavidin-coated magnetic beads, following a hybridization-based capture methodology adapted from Kijas et al. (1994). We selected and cultured
864 bacterial clones containing plasmids (size range 500– 900 bp) with inserts that gave strong hybridization signals. These clones were sequenced by Genoscope Centre National de Séquençage (http://www.genoscope.cns.fr/). Because of the difficulty of sequencing long fragments, only 480 clones could be exploited. A first check of the presence of simple sequence repeat (SSR) loci showed that the library created from this protocol gave a very good enrichment rate, with 417 sequenced clones (86.9%) con-taining a microsatellite (GA)n. A total of 143 primers pairs were defined with oligo 4.06 software (National Biosciences). Fifteen SSR loci were selected among these primers pairs on the basis of good polymerase chain re-action (PCR) product quality and clear polymorphism detection (Table 1). Loci with only one or two closest and strongly amplified fragments were chosen and microsatel-lite polymorphisms were screened on six genotypes of teak belonging to different origins.
A total of 265 trees were sampled: 71, 64, 36 and 94 indi-viduals from India, Thailand–Laos, Indonesia and Africa, respectively. Automated infrared fluorescence DNA sequ-encing was used to find the allele variability according to Steffens et al. (1993). Microsatellite loci were amplified using PCR in 15 µL reaction volume containing: 25 ng of genomic DNA in a 1× reaction buffer (10 mm Tris-HCl,
Correspondence: Daniel Verhaegen, Fax: +33 (0)467593733; E-mail: daniel.verhaegen@cirad.fr
946 PRIMER NOTE © 2005 Blackwell Publishing Ltd, Molecular Ecology Notes , 5, 945– 947
Table 1 Development, screening and polymorphism of 15 nuclear microsatellites for Tectona grandis Accession no. in the EMBL Nucleotide Sequence Database
Locus name
Accession no.
EMBL Database Primer sequence
Repeat motif Allele size range (bp) Ta (°C) N A HO HE P value
CIRAD1TeakA06 AJ968929 F: 5′-CAAAACAAAACCAATAGCCAGAC-3′ (GA)
15 191–229 51 265 20 0.774 0.857 0.3166 (NS)
R: 5′-TTTCATCATCATCATCAACATCC-3′
CIRAD1TeakB03 AJ968930 F: 5′-AACAACCCCTCCTCTCTTCACTA-3′ (TC)
5TG(TC)8 236–266 51 265 15 0.709 0.814 0.0029 (*)
R: 5′-CACTACCACTCATCATCAACACA-3′ (AC)
5(N)65(AC)14
CIRAD1TeakF05 AJ968931 F: 5′-CTTCTGCAACCCTTTTTCAC-3′ (GA)
20GT(GA)3 249–279 51 265 15 0.649 0.753 0.0000 (**)
R: 5′-AGCCATATCTTCCTTTCTCT-3′
CIRAD1TeakG02 AJ968932 F: 5′-TTAACGCCAAATCCCAAAG-3′ (TC)
10 166–170 51 265 3 0.185 0.223 0.3611 (NS)
R: 5′-CACAAAGAGAACCGACGAG-3′
CIRAD1TeakH10 AJ968933 F: 5′-CGATACCTGCGATGCGAAGC-3′ (TC)
16 225–273 51 261 20 0.843 0.879 0.0743 (NS)
R: 5′-CGTTGAATACCCGATGGAGA-3′
CIRAD2TeakB07 AJ968934 F: 5′-GGGTGCTGATGATTTTGAGTT-3′ (TC)
14 129–157 51 265 13 0.694 0.778 0.0036 (*)
R: 5′-CTAAGGAGTGAGTGGAGTTTT-3′
CIRAD2TeakC03 AJ968935 F: 5′-AGGTGGGATGTGGTTAGAAGC-3′ (GA)
17 269–313 51 265 17 0.679 0.852 0.0000 (**)
R: 5′-AAATGGTCATCAGTGTCAGAA-3′
CIRAD3TeakA11 AJ968936 F: 5′-AAACCATGACAGAAACGAATC-3′ (GA)
16 263–291 51 265 15 0.600 0.767 0. 1744 (NS)
R: 5′-TTGGGAATGGGAGGAGAAGT-3′
CIRAD3TeakB02 AJ968937 F: 5′-ATGAAGACAAGCCTGGTAGCC-3′ (TC)
11GC(TC)4 216–252 51 264 18 0.697 0.807 0.0210 (NS)
R: 5′-GGAAGACTGGGGAATAACACG-3′ (N)
62 (AC)7
CIRAD3TeakDa09 AJ968938 F: 5′-CTCGCTTCTTTCCACATT-3′ (AC)10 198–222 51 265 9 0.325 0.408 0.0001 (**)
R: 5′-ATCATCGCGCATCGTCAA-3′
CIRAD3TeakE06 AJ968939 F: 5′-GCGTCAACCACTTCAACCACCAG-3′ (GA)10CA(GA)
2 204–228 51 264 11 0.356 0.547 0.0305 (NS)
R: 5′-CCTATTTTCTTCCCCTCCCTTCT-3′
CIRAD3TeakF01 AJ968940 F: 5′-GCTCTCCACCAACCTAAACAA-3′ (TC)16 198–234 51 265 18 0.774 0.825 0.1416 (NS)
R: 5′-AAAACGTCTCACCTTCTCACT-3′
CIRAD4TeakDa12 AJ968941 F: 5′-CGCACACCAGTAGCAGTAGCC-3′ (GA)4 (N)5(GA)11 129–171 51 265 20 0.528 0.737 0.0000 (**)
R: 5′-GCCGGAAAAAGAAAAACCAAA-3′ A(GA)
4
CIRAD4TeakF02 AJ968942 F: 5′-CCGGTAAAAAGGTGTGTCA-3′ (TC)4 (AC)3(N)16 217–243 51 265 14 0.547 0.626 0.9997 (NS)
R: 5′-GAGTGGAAGTGCTAATGGA-3′ (TC)11
CIRAD4TeakH09 AJ968943 F: 5′-GCAAACCAACCTTACT-3′ (GA)14 149–175 51 264 13 0.379 0.550 0.0112 (NS)
R: 5′-CCGTTAGCACTCCATT-3′
Annealing temperature (Ta), number of individuals (N), total number of alleles (A), observed heterozygosity (HO), expected heterozygosity (HE) under HWE, P values for the HWE test,
significance threshold adjusted using sequential Bonferroni correction: P (5%) ≤ 0.0040. *Significance threshold at 5%.
**Significance threshold at 1%. NS non significant.
P R I M E R N O T E 947
© 2005 Blackwell Publishing Ltd, Molecular Ecology Notes, 5, 945–947
50 mm KCl, 2 mm MgCl2), 0.2 mm dNTPs, 0.10 µm of for-ward primer, 0.06 µm of reverse primer, 0.10 µm of IRdye M13/700 or M13/800 and 0.13 U/µL Taq DNA polymerase (Invitrogen). The amplifications were carried out with a thermal cycler Stratagene RoboCycler Gradient 96 under the following conditions: denaturation at 94 °C for 4 min; 30 cycles of denaturation at 94 °C for 30 s, annealing at 51 °C for 45 s and extension at 72 °C for 45 s; and a final extension at 72 °C for 5 min. The reverse PCR primers were probed with a 19 base extension at its 5′ tail end with the sequence 5′-CACGACGTTGTAAAACGAC-3′. This sequence is complementary to an IR-labelled universal M13 forward sequencing primer, which is included in the PCR. During PCR, the tailed primer generates a complementary sequence, which is subsequently utilized for priming in the amplifi-cation reaction thereby generating IR-labelled PCR pro-ducts. The samples were electrophoresed on an IR DNA analyser (li-cor) that can detect primer-labelled extension products at two different wavelengths (IRDye 700 nm and IRDye 800 nm). This allowed loading of a multiplex of four PCR products in one well. The individuals trees were genotyped using saga software (li-cor).
Data analysis was performed with gda (Lewis & Zaykin 2001) and micro-checker (Van Oosterhout et al. 2004) softwares. The number of alleles ranged from three to 20 per locus and was clearly higher in India and Africa, with respective means of 11.5 and 10.8 alleles, than in Indonesia and Thailand–Laos, with 5.5 and 5.1 alleles, respectively. Heterozygosity ranged from 0.185 to 0.843, with most values above 0.60. In all cases, the observed heterozygosity was lower than the expected heterozygosity (Table 1). Six of the 15 loci showed significant deviation from Hardy– Weinberg equilibrium (HWE), which has been interpreted as the result of a Wahlund effect because the total popu-lation was structured in several subpopupopu-lations. The pres-ence of null alleles was suggested for loci 3TE6, 4TD12 and for loci 1TB3 in natural populations of India and Thailand, respectively. However, the observed segregation in two half-sib families from these populations confirmed the observed homozygosity for these three homozygous loci (data not shown). Microsatellite genotypes were tested for linkage disequilibrium for all pairs of loci within each population. Two pairwise disequilibria between 3TE6/ 4TF2 and 1TF5/1TG2 were found at the 1% level using the
sequential Bonferroni correction, in Thailand and Indonesia/ Africa populations, but for these loci this disequilibrium could largely be due to the Hardy–Weinberg disequilibrium present in the teak populations studied and to the sub-population structure in these sub-populations.
The 15 microsatellite loci reported here constitute a powerful tool in investigating the mating system, gene flow, parentage and population dynamics for use in sustainable management of natural teak forests and for in or ex situ conservation of teak genetic resources.
Acknowledgements
We are grateful to Genoscope (Centre National de Séquençage) for sequencing the teak DNA clones. We would like to thank the European Commission project ‘Waft’ (Inco-Dev ICA4-CT-2001-10090), which supported this research in Ghana, in Ivory Coast and in the laboratory. Many thanks to the SODEFOR and FORIG which supplied the teak plant material. We are very grateful to Mireille Poitel for her assistance in creating the microsatellite bank and for help with population genotyping.
References
Billote N, Lagoda PJL, Risterucci AM, Baurens FC (1999) Microsatellite-enriched libraries: applied methodology for the development of SSR markers in tropical crops. Fruits, 54, 277–288.
Kijas JMH, Fowler JCS, Garbett CA, Thomas MR (1994) Enrichment of microsatellites from the Citrus genome using biotinylated oligonucleotide sequences bound to streptavidin-coated magnetic particles. BioTechniques, 16, 657–662.
Lewis PO, Zaykin D (2001) GENETICDATAANALYSIS: Computer program
for the analysis of allelic data, version 1.0 (d16c). Free program dis-tributed by the authors over the Internet from http://lewis.eeb. uconn.edu/lewishome/software.html.
Saghai-Maroof MA, Soliman KM, Jorgensen RA, Allard RW (1984) Ribosomal DNA spacer length polymorphisms in barley: Mendelian inheritance, chromosomal location, and population dynamics. Proceedings of the National Academy of Sciences, USA, 81, 8014–8018.
Steffens DL, Sutter SL, Roemer SC (1993) An alternate universal forward primer for improved automated DNA sequencing of M13. BioTechniques, 15, 580–582.
Van Oosterhout C, Hutchinson WF, Wills DPM, Shipley P (2004)
micro-checker: software for identifying and correcting
geno-typing errors in microsatellite data. Molecular Ecology Notes, 4, 535–538.