HAL Id: hal-02326863
https://hal.archives-ouvertes.fr/hal-02326863
Submitted on 6 Nov 2020
HAL is a multi-disciplinary open access
archive for the deposit and dissemination of
sci-entific research documents, whether they are
pub-lished or not. The documents may come from
teaching and research institutions in France or
abroad, or from public or private research centers.
L’archive ouverte pluridisciplinaire HAL, est
destinée au dépôt et à la diffusion de documents
scientifiques de niveau recherche, publiés ou non,
émanant des établissements d’enseignement et de
recherche français ou étrangers, des laboratoires
publics ou privés.
Evidencing the relationship between isomer spectra and
melting: the 20- and 55-atom silver and gold cluster
cases
Mathias Rapacioli, Fernand Spiegelman, Nathalie Tarrat
To cite this version:
Mathias Rapacioli, Fernand Spiegelman, Nathalie Tarrat. Evidencing the relationship between isomer
spectra and melting: the 20- and 55-atom silver and gold cluster cases. Physical Chemistry Chemical
Physics, Royal Society of Chemistry, 2019, 21 (45), pp.24857-24866. �10.1039/C9CP03897C�.
�hal-02326863�
Journal Name
Evidencing the relationship between isomer spectra
and melting : the 20- and 55-atom silver and gold
clus-ters cases
†
Mathias Rapacioli,⇤aFernand Spiegelman,aand Nathalie Tarrat⇤b
The present work highlights the links between melting properties and structural excitation spec-tra of small gold and silver clusters. The heat capacity curves are computed for Ag20, Au20,
Ag55, Au55and their ions, using a Parallel-Tempering Molecular Dynamics scheme to explore the
Density Functional based Tight Binding (DFTB) potential energy surfaces and the multiple his-togram method. It is found that clusters having very symmetric lowest energy structures (Au20,
Ag55 and their ions) present sharp or relatively sharp solid-to-liquid transitions and large melting
temperatures, important structural excitation energies and a discrete isomer spectrum. Opposite trends are observed for less ordered clusters (Ag20, Au55and their ions). Regarding the structural
evolution with temperature, very symmetric clusters encounter minor evolution up to the starting melting temperature. The present study also highlights that, in contrast with the case of Au20, a
single electron excess or default is not determinant regarding the melting characteristics, even quantitatively, for clusters containing 55 atoms, for gold as for silver.
1 Introduction
One of the originalities of clusters, as finite systems, is their melt-ing behaviour. Early studies evidenced the size evolution of the solid to liquid melting and showed that the melting temperature decreases with size in the nanoparticle regime1,2. Moreover,
while in macroscopic bulk, transitions are sharp and occur at a well defined temperature, phase transitions in finite systems occur over a finite range of temperatures. These mechanisms of phase transitions in clusters were investigated some years ago by several authors3–5, who demonstrated the inequivalence of the
thermodynamical ensembles for finite systems, in analogy with other finite systems such as nuclei and the major role of phase coexistence at the transition. A number of these pioneering stud-ies were conducted using model Lennard-Jones potentials4,6,7.
In the case of metal clusters, several experimental8–17 and
theoretical18–33 investigations were achieved to evidence the
specific features of finite size melting with a description of the interatomic forces more realistic than the simple Lennard-Jones potentials.
aLaboratoire de Chimie et Physique Quantiques LCPQ/IRSAMC, UMR5626, Université
de Toulouse (UPS) and CNRS, 118 Route de Narbonne, F-31062 Toulouse, France. Tel: 33 5 6155 8318; E-mail: mathias.rapacioli@irsamc.ups-tlse.fr
bCEMES, Université de Toulouse, CNRS, 29, rue Jeanne Marvig, 31055 Toulouse,
France. Tel: 33 5 6752 4347; E-mail: nathalie.tarrat@cemes.fr
† Electronic Supplementary Information (ESI) available: [Details on the parameter-ization of the DFTB method for gold and silver]. See DOI: 00.0000/00000000.
While a continuous behaviour of their properties can be ex-pected for relatively large sizes and in the nanoparticle size do-main (N>100-1000 depending on the species), a discrete evolu-tion is exhibited for small sizes down to the microcluster domain. Such finite size effects clearly affects the structure and energetics of clusters with the occurrence of the so-called magic numbers. It also affects the thermodynamical properties28,29,34–38. The
pioneering experimental study on small sodium clusters in the range N=20-147, reported by Haberland et al.8, showed
particu-lar particu-large melting temperature for specific size around N=55 and N=147, and strong finite size effects were also observed on the la-tent heats. The underlying mechanisms of phase transitions were unraveled by a number of authors12,24,25,27,30,31,34,36,38–41,
de-tailing the melting process in finite systems to initial isomerisation and finally melting as the number of accessible isomers at a given energy/temperature increases yielding a fluctuating state of the system. Thus, the density of isomers becomes a key property in describing melting at the microscopic level. While the equilibrium geometries in themselves are not supposed to influence melting, the potentials energy landscape is obviously determinant. Never-theless, the gaps between the lowest energy equilibrium geometry and the lowest isomers can be related to the particular stability of the former, e.g its magic character. It has been shown in a number of simulations that clusters with a magic character often present a large gap to isomerisation, and therefore a higher melting tem-perature with also a sharper peak in the caloric curve than its
immediate non-magic neighbors8,42. Obviously, the magic
char-acter of a given size can stem either from geometric stability or electronic stability, as it is the case in metal clusters. Both types of stabilities can also interfere and even combine, like in the specific clusters Au20 (see32and references therein) or Al
32 particularly
stable and exhibiting sharp caloric curves17,31. Not only size but
also charge can influence the caloric properties of relatively small metal clusters17,31,32, since charge changes the filling of the
elec-tronic shells.
We will hereafter focus on gold and silver clusters. Their structural and melting properties have been investigated us-ing various experimental setups34,40,43,44 and theoretical
ap-proaches19,20,24–28,28–30,33,35,36,41,45–49, mostly with empirical
potentials. The most stable structures reported for different clus-ter sizes exhibit either very regular shape (e.g. Au20 or Ag55) or amorphous patterns50. As an example, it has been reported
that Au55could present cavities below its outer shell33,48,51and
a competition between ordered and disordered geometries has been evidenced in the case of Au14733,52. Beyond the search for
the most stable isomer, studies have been conducted to identify structural excited isomers26,45,47,51. In small clusters, a
premelt-ing involvpremelt-ing transition towards these secondary minima has been reported24–26,35,46,49. For large clusters, another possible
pre-melting mechanism has been suggested in the literature involving a melting of the cluster shell prior to the the cluster core19,36,41.
The melting temperature was reported to increase with the metal nanoparticle size for large clusters27,34,43, confirming the pioneer
observation of Buffat and Borel2. For small clusters, the melting
temperature evolution with size is non-monotonous36and the
ad-dition or removal of an atom can lead to drastic variation of the melting temperature28–30,45. Moreover, for such small sizes, the
melting temperature may also depend on the charge state32.
The present work is devoted to a detailed comparative study of melting between isovalent noble metal gold and silver clusters for the intermediate sizes 20 and 55, which can be considered as the low limit of the transition between clusters and nanopar-ticles. It extends a previous work restricted to the influence of chargeon the melting of Au2032. While isovalent, silver and gold exhibit quite different properties due to the strong relativistic in-fluence in the electronic structure of gold53,54. The size choice
was made because because N=20 is a double magic number for gold (geometrically a symmetric pyramid associated with a 20 electron closing of its outer electronic shells55), while N=55 is
not magic for gold. In contrast, Ag55 was found in many theo-retical studies as an icosahedron with two complete geometrical shells. Note that as far as we are aware of, the only investiga-tions of the caloric curves for gold and silver cluster clusters with size N=55 were done in the framework of EAM potentials26,56.
We analyze the different thermodynamical behavior of the silver and gold clusters, based on the correlation between the density of isomers, the isomerization gaps and the characteristic of the solid-to-liquid transition. The influence of the charge of the clus-ter on the density of isomers for such inclus-termediate sizes is also illustrated. The multiple histogram method to obtain the melt-ing curves from DFTB simulations involvmelt-ing Parallel Tempermelt-ing Molecular Dynamics is now standard and briefly summarized in
the section 2. Section 3 presents the caloric curves for Au( ,0,+)20 , Ag( ,0,+)20 , Au( ,0,+)55 and Ag( ,0,+)55 and the discussion about the underlying microscopic aspects of the transitions. Finally a con-clusion is given in section 4.
2 Computational details
In the present work, we have used the Density Functional based Tight Binding (DFTB) scheme57,58, in its second order
formula-tion (also known as Self-Consistent Charge DFTB59), to compute
the potential energy surfaces for neutral, anionic and cationic gold and silver clusters. In a previous work60,61, we adapted (see
supplementary materials for more details) existing gold62and
sil-ver parameters63and validated their use to properly model these
metals from cluster to bulk sizes.
The exploration of the PES has been done using a Parallel-Tempering Molecular Dynamics (PTMD) scheme64, as
imple-mented in the deMonNano code65,66. In this scheme, several
trajectories are run in parallel in the canonical ensemble at dif-ferent temperatures. In practice, 60 trajectories were computed, corresponding to 60 temperatures following an exponential dis-tribution between 50 K and 2000 K. The trajectory time lengths were progressively increased in order to ensure convergence of the heat capacity curves (between 1 and 6 ns). The timestep was 1.5 fs and the temperature was controlled by a Nose-Hoover chain67,68of 5 thermostats coupled to the system through a
fre-quency of 80 cm 1. In order to increase ergodicity, exchanges of
temperatures between the different trajectories were attempted each 1.2 ps using a metropolis criterion.
Although heat capacities can in principle be build from the po-tential energy distribution obtained for the different simulated temperatures, we have used the multiple histogram approach, as formulated by Labastie and Whetten4which reduces the
statisti-cal noise and extrapolates heat capacity values for temperatures not included in the PTMD simulation.
3 Results and discussion
The structural aspects for neutral, cationic and anionic Ag20, Au20, Ag55 and Au55 within the DFTB approach were discussed in details in a previous work51 from global exploration (PTMD
complemented by quenching). The lowest energy isomers for Au20, Au+
20and Au20were found to be very symmetric structures,
namely a Td pyramid fort the neutral cluster and a Td pyramid
with small Jahn-Teller deviations for the anion, in agreement with previous experimental and theoretical works69–71. In contrast,
the lowest energy structures of Ag20 and its ions are essentially
based on pentagonal arrangements and have lower symmetry, namely C3for the neutral and the cation, Csfor the anion. For size
N=55, the results are interchanged. The lowest energy structures of Ag55neutral and ions all result from small Jahn-Teller distor-sions of the very symmetric (Ih) double icosahedron (D2h, D5dand
D3dfor the neutral, the cation and the anion respectively), while
the low energy isomers of Au( ,550,+)have more disordered shapes with cavities inside the cluster.
Fig. 1 Structures of the DFTB lowest-energy isomers of Ag20, Au20, Ag55 and Au55.
Figure 1 only displays the lowest energy equilibrium structures of the neutral clusters. The equilibrium structures of the charged clusters presenting only small deformations of the neutral ones, the details would not be discernible at the figure scale. For more information, we refer the reader to our previous publication51.
Note that the presence of cavities in Au55 gold clusters has been recently confirmed by two other DFT studies33,48. In itself, the
fact that the structures are symmetric or disordered is not directly influential on the thermodynamical properties which result from averages at a given temperature. However, very symmetric structures often correspond to particularly stable equilibrium structures and may therefore be associated with larger structural excitation energies and higher melting temperatures than the disordered ones. The variability of the isomer spectrum is thus determinant on the thermodynamic properties21,26,45 and will
be analyzed in the discussion.
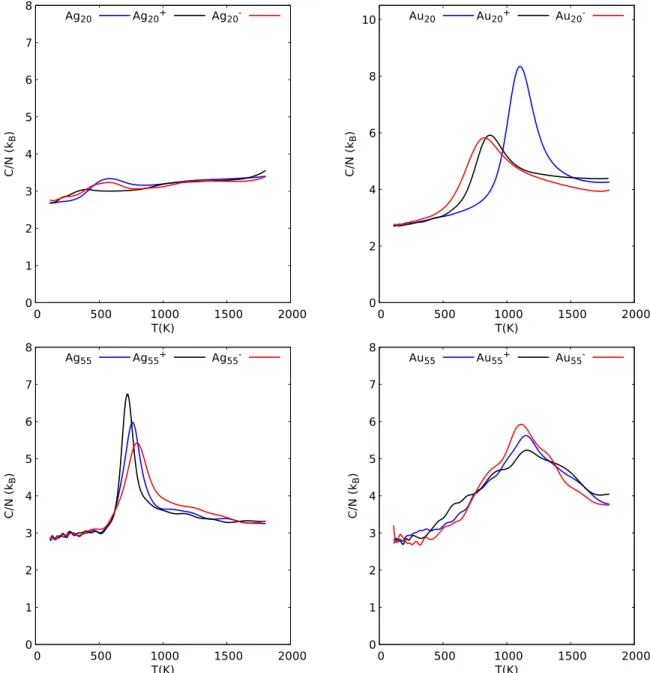
The heat capacity curves as a function of the canonical tem-perature are shown in figure 2 in the temtem-perature range of the solid-liquid transition. The case of Au20 was already discussed
with respect to charge effects32and is given here for comparison.
The first observations concern the temperature widths of the transitions and the heights of the associated peaks.In the case of neutral Au20 and Ag55, the transition is rather well defined, with peak heights around C/N = 8 and 6 kB respectively and with
half-widths around 300 K and 180 K respectively (taken as the widths at the peaks half heights).The situation is quite different in the case of Ag20 which exhibits an extremely smooth and flat transition and in the case of Au55 for which the width of the transition extends almost over the whole temperature domain investigated with a roughly linear increase, up to the well defined peak maximum. The characteristic temperatures of the heat capacity curves are given in table 1. The transition temperatures Tmelt are taken as the peak maxima. We also give the inflexion
temperatures Tin f lex, which are usually interpreted as the starting
melting temperatures. However, in some cases, e.g. Ag20 and Au55, the inflexion points of the caloric curves are uncertain, and
we have alternatively defined the starting temperature Tstart as
the left temperature at half width. The melting temperatures Tmelt for neutral Ag20, Ag55, Au20 and Au55, are 581 K, 763 K,
1101 K and 1154 K respectively. One can observe that while the addition or removal of a single electron may quantitatively change the position of the heat capacity peaks (see for instance Au20and its ions), it does not significantly change the qualitative aspects of the heat capacity curves.
Tstart Tin f lex Tmelt
Ag20 359 - 574 Ag20 411 418 581 Ag+ 20 215 - 398 Au20 646 691 822 Au20 978 1017 1101 Au+ 20 717 763 867 Ag55 685 730 795 Ag55 672 717 763 Ag+ 55 665 685 724 Au55 795 - 1115 Au55 808 - 1154 Au+ 55 678 - 1160
Table 1 Starting melting temperatures Tstart, inflexion point temperatures
Tin f lexand melting temperatures Tmeltin K (±3K) for Ag( ,0,+)20 , Au( ,0,+)20 ,
Ag( ,0,+)55 and Au( ,0,+)55 .
In a previous references32,51, the structural excitation energies
of all isomers found below 1 eV within the PTMD /quenching ex-ploration scheme were reported. Important energy gaps between the lowest energy isomers and the first excited ones were found in the case of the symmetric clusters, namely Au20and Ag55(0.64
eV for neutral Au20and 0.51 eV for Ag55for instance). Conversely, in the less ordered systems Ag20and Au55, small gaps were found
(0.12 eV for Ag20, almost no gap in the case of Au55). This fin-gerprints could still be observed in the ions, with finite well es-tablished gaps (somewhat reduced) in Au( ,+)
20 and Ag( ,+)55 and
very small or vanishing gaps in Ag( ,+)
20 and Au( ,+)55 . More
thor-ough insight can be reached from the features of the global iso-mer spectra given in figure 3. One can observe that the sharpest transitions, corresponding to the most ordered clusters Au20and Ag55 are related to cases where there is a significant isomer gap between the lowest energy structure and the higher ones. Let us note that in the case of Au20, the isomer spectrum shows several
isomers lying at extremely low energies close to that of the best structure, which are isomers corresponding to slight Jahn-Teller distortions of the symmetric Tdstructure. Since the present work
does not include quantum effect nor vibrational zero point energy effects, we do not discuss those isomers which moreover do not bring any visible features in the heat capacity curve at low tem-perature. As mentioned above, the gaps are particularly large for Au20 and Ag55, and the isomer spectrum keeps a discrete nature up to 1 eV. This is at strong contrast with Ag20for which the iso-mer spectrum still exhibits lines corresponding to various isoiso-mers, however lying close-by. In Au55, the isomer spectrum is so con-gested that it appears as a quasi continuum above 0.15 eV. These high densities of low-energy isomers are associated with flat or
0 1 2 3 4 5 6 7 8 0 500 1000 1500 2000 C/ N ( kB ) T(K) Ag20 Ag20+ Ag20 0 2 4 6 8 10 0 500 1000 1500 2000 C/ N ( kB ) T(K) Au20 Au20+ Au20 0 1 2 3 4 5 6 7 8 0 500 1000 1500 2000 C/ N ( kB ) T(K) Ag55 Ag55+ Ag55 0 1 2 3 4 5 6 7 8 0 500 1000 1500 2000 C/ N ( kB ) T(K) Au55 Au55+ Au55
very broad transition features. Several oscillations appear in the raise of the caloric curve. We checked that the visited structures do not include a few specific isomers only but a large number of noticeably different amorphous structures, consistently with the almost continuous isomer spectrum. It is thus not possible to as-sign those features to uniquely defined isomerization. We now consider the ions. In the case of Au20and Au+
20, the gaps are
re-duced to 0.35 eV and 0.27 eV respectively, and a larger number of isomers appear in the range 0.3-1 eV. This provides an explana-tion for a broadening of the transiexplana-tion peak and a shift of the melt-ing to lower temperatures, namely 822 and 867 K respectively. Ag55is a larger cluster in which the addition or the removal of an electron is less influential. Its isomer spectrum is not significantly changed, characterized by first structural excitation gaps of 0.45, 0.46 and 0.46 eV for the neutral, the anion and the cation respec-tively. The isomer gap in Ag+
20 is about the same as that of the
neutral, while its isomer spectrum becomes strongly congested in the range 0.18-0.38 eV, which may explain the almost flat aspect of its heat capacity curve, the melting temperature indicated in table 1 being to be taken with extreme caution. In Ag20, the first structural energy gap is strongly reduced and a very smooth heat capacity is obtained with two shoulders. The isomer spectrum of Au55is even more congested than the spectrum of the correspond-ing neutral cluster. Concerncorrespond-ing Au+
55, a lower density of isomers
is observed between 0.1 and 0.3 eV. Finally, an important obser-vation is that, while in Au20and Ag20the effect of a single charge
on the melting temperature may result in shifts in the range 200-300K, this effect almost vanishes for the largest clusters Au55and Ag55where the shifts are only in the range 30-50 K.
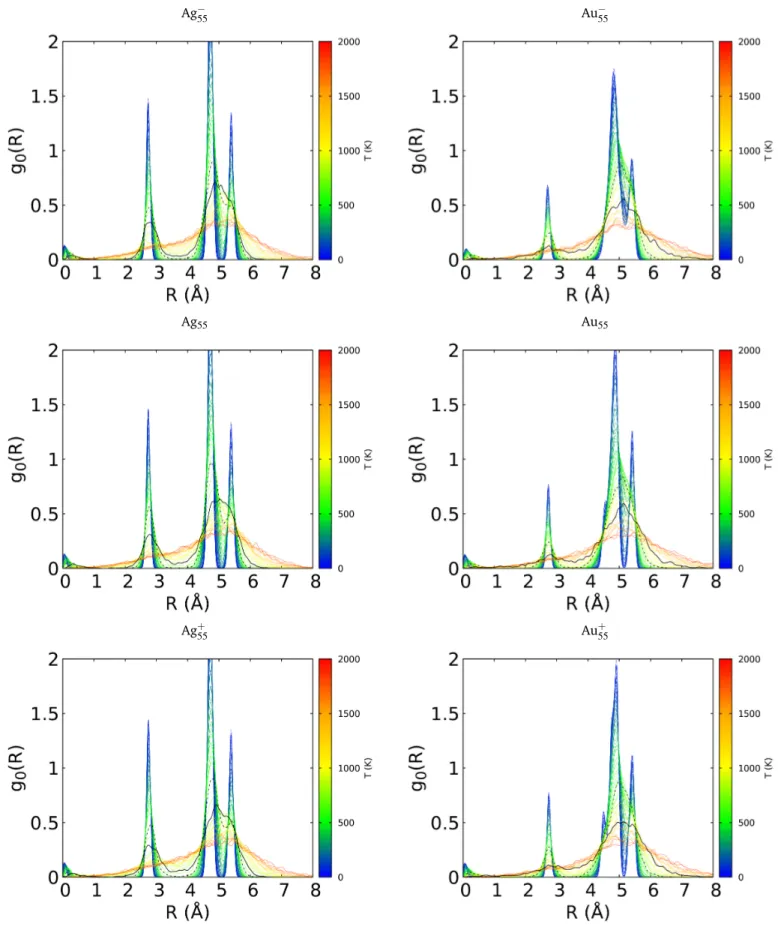
In order to get further insight in the structural order changes along the melting process, we have also analyzed the cluster structures by computing the averaged Radial Distribution func-tions (RDF) at a given temperature defined as
g0(r,T ) =<N1 N
Â
i 1 p 2pse (r0i r)2 2s2 >T (1)where index 0 stands for the center of mass of the cluster and i a current atom. The average concerns all the cluster configura-tions at a given temperature. The gaussian smoothing was used (s=0.05 Å) to reduce the noise, especially at low temperature. Temperature-dependent RDFs are reported in Fig. 4 for Ag( ,0,+)20 and Au( ,0,+)20 , and in Fig. 5 for Ag( ,0,+)55 and Au( ,0,+)55 . On these figures, the RDF at the melting temperature Tmelt is depicted as
solid black lines and the one at Tstartas dashed black lines. Clearly,
due to their high symmetry, the RDF of Au20and Ag55at low tem-perature both have only a few characteristic and rather narrow peaks, corresponding respectively to the pyramidal structure and to the icosahedron. Obviously when the temperature increases, the atomic fluctuations induce a broadening of the RDF peaks. One can observe on the Au20spectrum that the evolution of the RDF between Tstartand Tmeltis quite significant. At Tstart, the peak
structure in the RDF is still clearly identifiable and still associated to a given structure perturbed by vibrational fluctuations. Alter-natively, at the meting temperature, even though the RDF is not
flat, the peaks at 1.8 and 4.8 Å have almost disappeared and the RDF has almost completely lost its structuration. A similar situa-tion can be observed in Ag55, except that the two-shell structure seems to be still preserved within the two-maxima feature of the RDF around 2.8 and 4.9 Å. Let us note that, above the melting temperature, some distances are now recorded between the two shells in the range 3-4 Å, fingerprinting exchanges between the shells. Again, the situation is significantly different in the case of Ag20and Au55. In Ag20, the peak structure is still slightly visible,
however considerably smeared. In Au55, the RDF at Tstarthas lost
its initial structure, the two peaks of the RDF at 4.8 and 5.4 Å being merged. Moreover, there is no strong difference between the RDFs at Tstartand Tmelt, which is clearly related to the
temper-ature width and the smoothness of transition for these clusters. The same differential behaviour of the RDF is seen for the ions Au( ,+)20 and Ag( ,+)55 on one side (sharp transition), Ag( ,+)20 and Au( ,+)
55 on the other side (smooth transition). From the above
analysis, it appears that the melting temperature can be inferred from the RDF evolution in the case of ordered clusters such as Au20and Ag55, while the continuous evolution of the RDF in dis-ordered cases prevents such determination.
A number of previous theoretical studies have determined the caloric curve of gold and silver clusters (mainly neutrals), either for small sizes or in the nanoparticle regime up to a few thou-sands of atoms19,20,24–28,28–30,33,35,36,41,45–47,49. First-principles
calculations were used to investigate the thermal properties of small gold clusters up to N⇡2428,29,45,47, with a special focus on
Au20and its neighbours. The thermal stability of small gold cages was examined by Chandrachud et al.45. Most of the other studies
were conducted using EAM-type potentials. In large clusters and nanoparticles, emphasis was put on the occurrence of a surface premelting19,36,41,49. In gold, specific studies were concerned
with a solid-to-solid transformation into metastable icosahedral shape35,46.
Mainly two studies, both using EAM-type potentials, have investi-gated the melting of gold and silver clusters for size N=55. Hamid et al. conducted an EAM-type study on several metal clusters em-phasizing the crossover between icosahedral Ihand f cc Oh
mor-phologies and determined the caloric curves56. For Au 55, they
found a melting temperature close to 400K, quite far from the one determined in the present study (Tmelt = 1154K). For
refer-ence, the bulk melting temperature of gold is 1337K72. It is to
be noticed that neither the Ihnor the Oh structures are the
low-est energy structures, neither in the EAM study of Hamid et al. nor in the present study. Finally, let us mention that the melting temperature of Au20 in the present DFTB approach is 1101K to be compared with 770K in the DFT/LDA study of Krishnamurty et al.29. This was discussed in a previous article32as related to
different isomer gaps (0.64 eV with DFTB, 0.75 with DFT/TPSS71
and 0.44 with DFT/LDA29).
In the case of Ag55, Mottet et al.26 found a melting at 570 K,
starting from 530 K. Both this latter result and our present melt-ing temperature (Tmelt = 763K) are significantly lower than that
of the bulk (1232 K73). In the two studies, the first
Ag20 Ag20 Ag+ 20
0 0.2 0.4 0.6 0.8 1
E(eV) 0 0.2 0.4E(eV) 0.6 0.8 1 0 0.2 0.4E(eV) 0.6 0.8 1
Au20 Au20 Au+
20
0 0.2 0.4 0.6 0.8 1
E(eV) 0 0.2 0.4E(eV) 0.6 0.8 1 0 0.2 0.4E(eV) 0.6 0.8 1
Ag55 Ag55 Ag+
55
0 0.2 0.4 0.6 0.8 1
E(eV) 0 0.2 0.4E(eV) 0.6 0.8 1 0 0.2 0.4E(eV) 0.6 0.8 1
Au55 Au55 Au+
55
0 0.2 0.4 0.6 0.8 1
E(eV) 0 0.2 0.4E(eV) 0.6 0.8 1 0 0.2 0.4E(eV) 0.6 0.8 1
Ag20 Au20
Ag20 Au20
Ag+
20 Au+20
Fig. 4 Temperature-dependent Radial Distribution Functions for Ag( ,0,+)20 and Au( ,0,+)20 . The temperature color code is indicated on the right. RDF at Tstart: dashed black line. RDF at Tmelt: solid black line.
Ag55 Au55
Ag55 Au55
Ag+
55 Au+55
Fig. 5 Temperature-dependent Radial Distribution Functions for Ag( ,0,+)55 and Au( ,0,+)55 . The temperature color code is indicated on the right. RDF at Tstart: dashed black line. RDF at Tmelt: solid black line.
completely sufficient to characterize the transition. Clearly, the differences between the melting temperatures are to be related to the different potentials used and the specific isomer densities above the first gap in the two respective studies.
We have addressed here some specific cases, either ordered clus-ters presenting a large gap between a single lowest isomer and the next one, or disordered clusters presenting almost no gap at all. Clearly, other sizes may exhibit a different energy landscape with two or more low energy isomers, where the temperature evolution would start as a structural isomerization to a hot solid prior to melting. In such case, the isomer spectrum would exhibit two or more well identified low energy lines and might induce a shoulder or a peak in the capacity curve below the main one (see for instance the case of Al+
11538, Ga+8011 and previous
dis-cussions12,31,38,74). Let us mention that the identification of a
second isolated isomer well separated from the higher ones does not necessarily induce any premelting feature in the caloric curve, as evidenced in the case of Au20in our previous work32.
4 Conclusion
We have determined the heat capacity curves for Ag20, Au20, Ag55, Au55and their ions associated with the solid-to-liquid
tran-sition. The present work highlights the direct links between the structural excitation spectra and the melting properties of small gold and silver clusters. Clusters exhibiting very symmetric low energy structures, such as Au20and Ag55and their ions, display large structural excitation energies and a discrete nature of their isomer spectra below 1 eV. They present sharp or relatively sharp solid-to-liquid transitions and rather large melting temperatures, relatively to their respective sizes. A relatively minor evolution of their structure is observed up to the starting melting tem-perature. Conversely, less ordered clusters, such as Ag20, Au55
and their ions, have small or vanishing structural energy gaps, isomer spectra almost continuous above low energies and they undergo a much smoother transition. Moreover, the evolution of the RDF of Au55 shows a loss of structuration significantly below the melting temperatures associated with a transition within a broad temperature range. The identification of these very different structural and thermodynamic characteristics for clusters of similar size composed of the isovalent metals gold and silver completes the picture of dissimilar properties for those two elements. The correlation between the thermodynamical behaviour and the isomer spectrum observed in the present work also gives credit to the description of the onset of disorder at phase changes in the spirit developed in the early works of Rose and Berry75and concerned with the topologies of the energetic
and entropic high-dimensional landscapes of clusters and the role of amorphous basins vs ordered configurations. Note that, relatively to our previous work on the influence of the charge on the caloric properties of Au2032, this study also shows that a
single electron default or excess is much less determinant, even quantitatively, for size N=55, than for size N=20.
Conflicts of interest
There are no conflicts to declare.
Acknowledgements
This work was granted access to the HPC resources of CALMIP (Grants p18009, p0059 and p1303). It was supported by the CNRS-GDR EMIE and through the EUR grant NanoX no
ANR-17-EURE-0009 in the framework of the "Programme des Investisse-ments d0Avenir".
Notes and references
1 P. Pawlow, Z. Phys. Chem., 1909, 65, 1–35.
2 P. Buffat and J.-P. Borel, Phys. Rev. A, 1976, 13, 2287–2298. 3 R. S. Berry, Sci. Am., 1990, 263, 50–56.
4 P. Labastie and R. L. Whetten, Phys. Rev. Lett., 1990, 65, 1567–1570.
5 D. Wales, Energy Landscapes: Applications to Clusters, Biomolecules and Glasses, Cambridge University Press, 2004.
6 S. Weerasinghe and F. G. Amar, Z. Phys. D - Atoms Molec.
Clus-ters, 1991, 20, 167–171.
7 J. D. Honeycutt and H. C. Andersen, J. Phys. Chem., 1987, 91, 4950–4963.
8 M. Schmidt, R. Kusche, B. von Issendorff and H. Haberland,
Nature, 1998, 393, 238–240.
9 G. A. Breaux, R. C. Benisrchke, T. Sugai, B. S. Kinnear and M. F. Jarrold, Phys. Rev. Lett., 2003, 91, 215508.
10 G. A. Breaux, D. A. Hillman, C. M. Neal, R. C. Benirschke and M. F. Jarrold, J. Am. Chem. Soc., 2004, 126, 8628–8629. 11 G. A. Breaux, B. Cao and M. F. Jarrold, J. Phys. Chem. B, 2005,
109, 16575–16578.
12 G. A. Breaux, C. M. Neal, B. Cao and M. F. Jarrold, Phys. Rev.
Lett., 2005, 94, 173401.
13 F. Chirot, P. Feiden, S. Zamith, P. Labastie and J.-M. L’Hermite, J. Chem. Phys., 2008, 129, 164514.
14 J. Boulon, I. Braud, S. Zamith, P. Labastie and J.-M. L’Hermite, J. Chem. Phys., 2014, 140, 164305.
15 A. A. Shvartsburg and M. F. Jarrold, Phys. Rev. Lett., 2000, 85, 2530–2532.
16 B. Cao, A. K. Starace, O. H. Judd and M. F. Jarrold, J. Chem.
Phys., 2009, 130, 204303.
17 A. K. Starace, C. M. Neal, B. Cao, M. F. Jarrold, A. Aguado and J. M. López, J. Chem. Phys., 2009, 131, 044307.
18 R. Poteau, F. Spiegelmann and P. Labastie, Z. Phys. D - Atoms
Molec. Clusters, 1994, 30, 57–68.
19 L. J. Lewis, P. Jensen and J.-L. Barrat, Phys. Rev. B, 1997, 56, 2248–2257.
20 I. L. Garzón and J. Jellinek, Z. Phys. D - Atoms Molec. Clusters, 1991, 20, 235–238.
21 F. Calvo and J. P. K. Doye, Phys. Rev. B, 2004, 69, 125414. 22 F. Calvo and F. Spiegelman, J. Chem. Phys., 2004, 120, 9684–
9689.
23 Manninen, K., Rytkönen, A. and Manninen, M., Eur. Phys. J.
D, 2004, 29, 39–47.
24 M. Ati¸s, H. Akta¸s and Z. B. Guvenç, Model Simul Mat Sci Eng, 2005, 13, 1411–1432.
26 C. Mottet, G. Rossi, F. Baletto and R. Ferrando, Phys. Rev. Lett., 2005, 95, 035501.
27 J. C. Ruiz Gómez and L. Rincón, Rev. Mex. Phys., 2007, 53, 208–211.
28 B. Soulé de Bas, M. J. Ford and M. B. Cortie, J. Phys.: Condens.
Matter, 2006, 18, 55–74.
29 K. Krishnamurty, G. S. Shafai, D. G. Kanhere, B. Soulé de Bas and M. J. Ford, J. Phys. Chem. A, 2007, 111, 10769–10775. 30 E. K. Yildirim, M. Atis and Z. B. Guvenc, Phys. Scr., 2007, 75,
111–118.
31 A. Aguado and J. M. López, J. Phys. Chem. Lett., 2013, 4, 2397–2403.
32 M. Rapacioli, N. Tarrat and F. Spiegelman, J. Phys. Chem. A, 2018, 122, 4092–4098.
33 D. Schebarchov, F. Baletto and D. J. Wales, Nanoscale, 2018,
10, 2004–2016.
34 T. Castro, R. Reifenberger, E. Choi and R. P. Andres, Phys. Rev.
B, 1990, 42, 8548–8556.
35 C. L. Cleveland, W. D. Luedtke and U. Landman, Phys. Rev. B, 1999, 60, 5065–5077.
36 S. Zhao, S. Wang and H. Ye, J. Physical Soc. Japan, 2001, 70, 2953–2957.
37 M. Asoro, J. Damiano and P. Ferreira, Microsc. Microanal., 2009, 15, 706–707.
38 A. Aguado and M. F. Jarrold, Annu. Rev. Phys. Chem., 2011,
62, 151–172.
39 F. Calvo and F. Spiegelmann, J. Chem. Phys., 2000, 112, 2888. 40 J. Adekoya, O. Olurotimi, T. Siyanbola, E. Dare and N. Re-vaprasadu, in Band Structure, Morphology, Functionality,
and Size- Dependent Properties of Metal Nanoparticles, DOI:
10.5772/intechopen.72761 In book: Noble and Precious Metals - Properties, Nanoscale Effects and Applications, DOI:10.5772/intechopen.72761, 2018.
41 H. A. Alarifi, M. Ati¸s, C. Ozdogan, A. Hu, M. Yavuz and Y. Zhou, J Phys. Chem. C, 2013, 117, 12289–12298.
42 K. G. Steenbergen, D. Schebarchov and N. Gaston, J. Chem.
Phys., 2012, 137, 144307.
43 O. A. Yeshchenko, I. M. Dmitruk, A. A. Alexeenko and A. V. Kotko, Nanotechnology, 2010, 21, 045203.
44 M. Asoro, D. Kovar, J. Damiano and P. Ferreira, Microsc.
Mi-croanal., 2010, 16, 1802–1803.
45 P. Chandrachud, K. Joshi, S. Krishnamurty and D. G. Kanhere,
Pramana – J. Phys., 2009, 72, 845–855.
46 C. L. Cleveland, W. D. Luedtke and U. Landman, Phys. Rev.
Lett., 1998, 81, 2036–2039.
47 M. J. Ford, B. Soulé de Bas and M. B. Cortie, Mater. Sci. Eng.
B, 2007, 140, 177 – 181.
48 M. Van den Bossche, J. Phys. Chem. A, 2019, 123, 3038–3045. 49 Y. Wang, S. Teitel and C. Dellago, Chem. Phys. Lett., 2004,
394, 257 – 261.
50 F. Baletto, J. Phys.: Condens. Matter, 2019, 31, 113001. 51 N. Tarrat, M. Rapacioli, J. Cuny, J. Morillo, J.-L. Heully and
F. Spiegelman, Comput. Theor. Chem., 2017, 1107, 102–114. 52 N. Tarrat, M. Rapacioli and F. Spiegelman, J. Chem. Phys.,
2018, 148, 204308.
53 H. Häkkinen, M. Moseler and U. Landman, Phys. Rev. Lett., 2002, 89, 033401.
54 H. Häkkinen, M. Moseler, O. Kostko, N. Morgner, M. A. Hoff-mann and B. v. Issendorff, Phys. Rev. Lett., 2004, 93, 093401. 55 L. Cheng, X. Zhang, B. Jin and J. Yang, Nanoscale, 2014, 6,
12440–12444.
56 I. Hamid, M. Fang and H. Duan, AIP Advances, 2015, 5, 047129.
57 D. Porezag, T. Frauenheim, T. Köhler, G. Seifert and R. Kaschner, Phys. Rev. B, 1995, 51, 12947–12957.
58 G. Seifert, D. Porezag and T. Frauenheim, Int. J. Quantum
Chem., 1996, 58, 185–192.
59 M. Elstner, D. Porezag, G. Jungnickel, J. Elsner, M. Haugk, T. Frauenheim, S. Suhai and G. Seifert, Phys. Rev. B, 1998,
58, 7260–7268.
60 L. F. L. Oliveira, N. Tarrat, J. Cuny, J. Morillo, D. Lemoine, F. Spiegelman and M. Rapacioli, J. Phys. Chem. A, 2016, 120, 8469–8483.
61 J. Cuny, N. Tarrat, F. Spiegelman, A. Huguenot and M. Rapa-cioli, J. Phys.: Condens. Matter, 2018, 30, 303001.
62 A. Fihey, C. Hettich, J. Touzeau, F. Maurel, A. Perrier, C. Köh-ler, B. Aradi and T. Frauenheim, J. Comput. Chem., 2015, 36, 2075–2087.
63 B. Sz˝ucs, Z. Hajnal, R. Scholz, S. Sanna and T. Frauenheim,
Appl. Surf. Sci., 2004, 234, 173–177.
64 Y. Sugita and Y. Okamoto, Chem. Phys. Lett., 1999, 314, 141– 151.
65 T. Heine, M. Rapacioli, S. Patchkovskii, J. Cuny, J. Frenzel, A. Koster, P. Calaminici, H. A. Duarte, S. Escalante, R. Flores-Moreno, A. Goursot, J. Reveles, D. Salahub and A. Vela, de-MonNano, http://demon-nano.ups-tlse.fr/, 1st Sept 2016. 66 L. F. L. Oliveira, J. Cuny, M. Moriniere, L. Dontot, A. Simon,
F. Spiegelman and M. Rapacioli, Phys. Chem. Chem. Phys., 2015, 17, 17079–17089.
67 S. Nosé, J. Chem. Phys., 1984, 81, 511.
68 W. G. Hoover, Phys. Rev. A, 1985, 31, 1695–1697.
69 F. Furche, R. Ahlrichs, P. Weis, C. Jacob, S. Gilb, T. Bierweiler and M. M. Kappes, J. Chem. Phys., 2002, 117, 6982–6990. 70 P. Gruene, D. M. Rayner, B. Redlich, A. F. G. van der Meer, J. T.
Lyon, G. Meijer and A. Fielicke, Science, 2008, 321, 674–676. 71 A. Lechtken, C. Neiss, J. Stairs and D. Schooss, J. Chem. Phys.,
2008, 129, 154304.
72 G. Kaye and T. Laby, Tables of physical and chemical constants,
Longman, London, UK, 15th edition, 1993.
73 J. Akella and G. C. Kennedy, J. Geophys. Res., 2019, 76, 4969– 4977.
74 K. L. Pyfer, J. O. Kafader, A. Yalamanchali and M. F. Jarrold,
The Journal of Physical Chemistry A, 2014, 118, 4900–4906.
75 J. P. Rose and R. S. Berry, Z. Phys. D - Atoms Molec. Clusters, 1993, 26, 178–180.