WOOD RESEARCH
59 (2): 2014335-342
CHARACTERIZATION OF ALGERIANS OAK WOOD BY
X-RAY TOMOGRAPHIC SCANNER AND FREE SOFTWARE
IMAGE-J
Kennouche Salim, Zerizer Abdelatif, Sitouah Nourdine, Aknouche Abdelhamid Université M’hamed Bougara, Unité De Recherche
Matériaux-Procédé-Environnement Boumerdès, Algéria
Frederic Mothe
Name Laboratoire D’etude Des Ressources Forêt Bois Nancy, France
(Received May 2013)
ABSTRACT
The main objective of this work is the determination of the density variation in nine samples oak wood analysed at various depth thickness. The wood materials tested are taken from Yakouren forest situated in the north of Algeria, samples used for the evaluation were of oak Zeen and oak Afares trees, samples are preciously prepared by catting operation in the longitudinal and tangential direction. The analysis based on the absorption of X-rays generated by tomographic scanner, as the trails parameters could be appropriate in order to obtain a high resolution of images. After the images were analyzed by a specific free software image (Image J), this was done by reconstructing images taken on each depth scan in three different area of the samples, at the high, middle and low area. The results showed density distribution in all samples areas analyzed, even at different depth. the statistical investigation of results confirmed the anisotropy of the species wood analyzed, in addition the density distribution were strongly correlated in the three areas anlyzed with slight difference, and the evolution of density were noted as nonlinear in the two species oak studied.
KEYWORDS: Wood, tomographic analysis, density, Image-J.
in 1972 by Godfrey Hounsfield (Longuetaud 2005), and was applied in many research field, such as medicine (Fu and Kuduvalli 2008), mineralogy (Taina et al. 2008), hydrology (Wildenschild et al. 2002), plant physiology (Lee and Kim 2008), and wood materials (Charline et al. 2009). The aim of this technical analysis based on interaction and multidirectional analysis between X-rays with material, by sending radiation through the object and receiving it on the other side the object (Cristian 2002), a series of images is taken using a reconstruction algorithm by the X-ray attenuation phenomenon of the incident radiation on the depth samples analyzed (Longuetaud 2005), according to the theory of Radon (1917). The value of voltage current used was in general 120 kV in order to obtain a acceptable resolution (Benson - Cooper et al. 1982, Lindgren 1991), even a number of authors have noted the influence of moisture and chemical composition on the attenuation of radiation, while a comparative studies between the green wood and drying samples, were conclude to estimate the content of water in samples analyzed Benson-Cooper et al. (1982), also relationship was noted between the Hounsfield index and density, that is used as calibration tool to determine the density of wood analyzed as the equasion:
Density = 0.91×IH + 1002
In addition, the density estimate with tomography calibration and gravimetrically measurement were correlated to the energy levels of the X-ray source variation, a good correlation value (R2 = 0.94) (Macedo et al. 2002). In the other hand, samples seizes affect density profile distribution were it decreases with small samples sizes (Marashdeha et al. 2012). Even a linear correlation was found between the attenuation coefficient and density of several materials scanned (Davis and Wells 1992).
Density of tropical wood was measured by X-ray scanner, and with nondestructive method on samples with the size 3 × 3 × 3 cm, conclude rapidly to map density of samples analyzed, even density values were strongly correlated (R2 = 0.99), comparing the two methods used, even opens very interesting perspectives for estimations of the biomass distribution within trees (Charline et al. 2009).
Wood density characteristic of trees have a good impact on industrial uses such as the wood construction and paper pulp productivity, too it is considered as an important parameter to judge the quality because it is strongly bonded to the physical and mechanical properties of wood, even the ultimate strength and wood shrinkage (Polge 1966).
In the context of climate change, the biomass estimation can indicate the production of energy from forest resources, due to wood is considered as a primary resource from sustainable energy, so density estimation is important not only to estimate the amount of biomass, it is also proportional to calorific value, and the evaluation of carbon storage in trees and wood products. The biomass estimates can be obtained by direct models or indirect approaches with combining the volume and wood density in trees (Vallet 2005).
In addition, several recent studies have been conducted, concluding the development of algorithms that detect automatically and measure nodes present in the wood, with detection rates ranging from 71 to 100 % in wood material, with exploration of images token by of X-ray scans, (Longuetaud et al. 2012. Using open-source software Image J developed by the National Institutes of Health (NIH), which based on Java program, and compatible with plug-in codes such as to meet the specific requirements of any applications (Rasbad and Image 2011).
Vol. 59 (2): 2014
MATERIAL AND METHODS
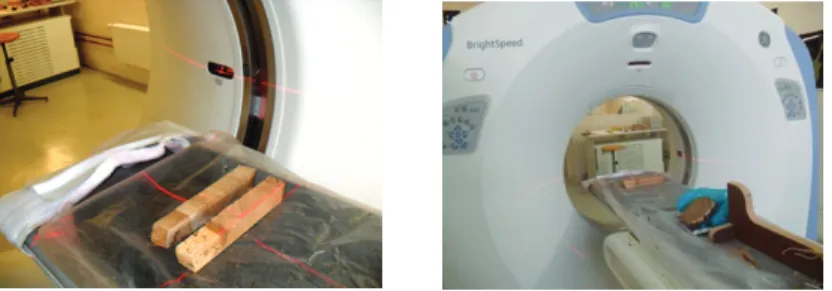
Sampling is done in the YAKOURANE forest (Tizi Ouzou, Algeria) on oak trees of spices (Quercus canariensis Willd.) and Afares oak (Quercus afares Pomel). The samples have a rectangular form with the size 2 × 2 × 18 cm were cut in the longitudinal direction. The samples are firstly placed in the area of analysis of X-ray scanner (Fig. 1), the scan parameters are adjusted to obtain thicknesses analyses value at 0.2 mm, hence obtaining 9 images for each sample. The X-ray scanner is based on the reconstruction of images from the attenuation of X-ray beams analyzed at different orientations in a plane passing through the studied volume. In this study, a 3rd generation scanner was used, this apparatus is composed for an X-ray source able to rotate and a set of receivers arranged in a semicircle (Fig. 1). The source generates photons at the opening broad with multiple projections at different angles, even width and energy can be varied, in order to include all the volume of the wood samples studied.
Fig. 1: Photos of the X-ray scanner, and the samples analyzed.
In this work, the analysis is based on radiation, a series of images is taken from samples of oak wood under study, and automatic reconstruction of images is done after the scan operation.
Analysis of the images process is realized by the tool free digital Image-J, the processing is apply on three separate areas, the upper area (1) median (2), and low (3) of the samples tested over the volume in the nine surfaces analysis (Fig. 2).
L R 1 2 3 T
Fig. 2: Diagram representative sample of oak analyzed.
RESULTS
A measurement method with scanner X-ray and analysis using free software Image-J has been developed, and some results about measurement are briefly presented here.
1036.17 kg.m-3 in oak Afares species, were the results obtained after analysis are summarized in the graphs in Fig. 3a and 3b. Also, the differences in density changes computed as the variation of linear distance area analyzed even the density variation was improved in over the samples depth section studied as shown in the Fig. 3.a and b below.
a b
Fig. 3: a.) Distribution of the average density in the different samples, b.) Analysis with Image-J.
DISCUSSION
The results show values density slightly higher in the upper area of the samples analyzed, compared to the middle and lower zones analyzed of the oak Zeen Afares samples scanned, this can be explained by the direction from which the trees were exposed in their growing area, either the sides exposed to the north, receive more light energy than who exposed to the south. Even the analysis improve that the density of oak Afares is higher than oak’s Zeen species, which can be explained by the presence of moisture in the samples analyzed by X-ray tomography (Benson-Cooper 1982).
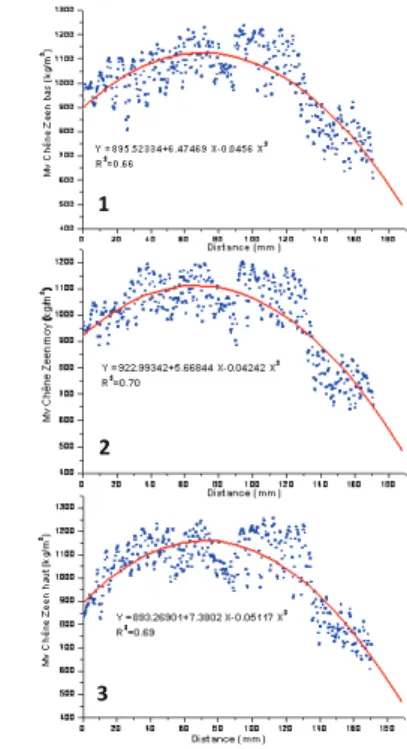
In an attempt to improve the correlation between density values in each area of zone, a statistical analysis shows that the density distribution varies as a non-linear polynomial function with second order in the case of the two species oak analyzed, as the determination coefficients R2, which estimated between 0.66 and 0.70 (Fig. 5), with an 13 % estimated error in the case of oak Zeen, were R2 was estimated at 0.80 to 0.84 (Fig. 4) in the case of oak Afares species, that explains the anisotropic of wood material, the effect of other environments, even the altitude growth trees can also affect the density distribution, that the oak Afarès trees grows in height places, but the Zeen oak trees that grow in the lower area of the forest. Also a strong correlation was improved between the density distribution of Afares and Zeen oak samples scanned, this variation is estimated as linear model, in the three areas analyzed, with a determination coefficient R2 who varies from 0.58 to 0.68, with an estimated error value 28 % in the case of Zeen oak, while R2 was 0.85 to 0.87, by means of estimate error value 16 %. This results are considered too, as a good indicator to predict the mechanical characteristics of Algerian oak wood, over the existence of relationship between the density and mechanical properties which are proportional, even a possible technology transformation of this oak wood species can be realized with chosen an appropriate cutting tools and, as we know the density of wood material indicate the cutting forces used. In the other hand the oak wood can be considered as an interesting energy fuel, due to their hit density.
Vol. 59 (2): 2014 1 2 3
1 2 3
Fig. 4: Distribution of density in the samples of oak afares..1 - Lower area; 2 - area median 3 - area high.
Fig. 5: Distribution of density in the samples of oak Zeen.1 - Lower area; 2 - area median 3 - area high.
CONCLUSIONS
Density distribution analyzes of Algerian oak wood species, realized in the laboratory for studies and research on wood material, using X-ray scanner, improved the density distribution map on samples studied. Also, the statistical analysis showed a strong correlation between the density of each area species analyzed, even interesting values of determination coefficients R2, estimated from 0.58 to 0.93, also nonlinear distribution of density values as the variation of the linear distance on the analyzed area in different zone, this distribution is strongly correlated in the case of oak Affares comparing to Zeen oak species. Oak Algerian wood can be industrialized with the chosen the technical parameters and can be an interesting fuel due to their hit density.
REFERENCES
1. Benson-Cooper, D.M., Knowles, R.L., Thompson, F.J., Cown, D.J., 1982: Computed tomographic scanning for the detection of defects within logs. Forest Research Institute,
2. Christian, T., 2008 : Tomographie à rayons X, technique de l’ingénieur traité analyse et caractérisation. Commissariat à l'énergie atomique. Direction des applications militaries (CEA). Doc 950: 1-24 (in French).
3. Davis, J., Wells, P., 1992: Computed tomography measurements on wood. Ind. Metrol. 2(3-4): 195-218.
4. Freyburger, C., Longuetaud, F., Mothe, F., Constant, T., Leban, J.M., 2009: Measuring wood density by means of X-ray computer tomography. Ann. For. Sci. 66(8): 1-9, article number 804, INRA, LERFoB, France
5. Fu, D.S., Kuduvalli, G., 2008: A fast, accurate, and automatic 2D-3D image registration for image-guided cranial radiosurgery. Med. Phys. 35(5): 2180-2194.
6. Joyet, P., Aléon, D., 1998: Drying and non-symmetric drying of semi-industrial 13 and 27 mm thick solid wood pieces. Rapport d’avancement du projet OAK-KEY CT95 0823 « New silvicultural alternatives in young oak forests. Consequences on high quality timber production. Sub-task 33, 7 pp.
7. Lee, S.J., Kim, Y., 2008: In vivo visualization of the water-refilling process in xylem vessels using X-ray micro-imaging. Ann. Bot. 101(4): 595-602.
8. Lindgren, L.O., 1991: Medical CAT-scanning: X-ray absorption coefficients, CT- numbers and their relation to wood density. Wood Science and Technology 25(5): 341-349. 9. Longuetaud, F., 2005 : Détection et analyse non destructive de caractéristiques internes
de billons d’Epicéa commun (Picea abies L.) Karst.) par tomographie à rayons X. Thèse de doctorat, Ecole Nationale du Génie Rural des Eaux et Forêts, Sciences Forestières et du Bois. Pp 50-58 (in French).
10. Longuetaud, F., Mothe, F., Kerautret, B., Krähenbühl, A., Hory, L., Leban, J.M., Debled-Rennesson, I., 2012: Automatic knot detection and measurements from X-ray CT images of wood: A review and validation of an improved algorithm on softwood samples. Computers and Electronics in Agriculture 85: 77-89.
11. Macedo, A., Vaz, C.M.P., Pereira, J.C.D., Naime, J.M., Cruvinel, P.E., Crestana, S., 2002: Wood density determination by X- and gamma-ray tomography. Holzforschung 56(5): 535-540.
12. Marashdeha, M.W., Baukb, S., Tajuddina, Hashim, R., 2012: Measurement of mass attenuation coefficients of Rhizophora spp. Binderless particleboards in the 16.59–25.26 keV photon energy range and their density profile using x-ray computed tomography. Applied Radiation and Isotopes 70(4): 656-662.
13. Polge H., 1966: Establishment of variation curves of wood density by densitometric scanning of radiographs auger samples from living trees - Applications in technological and physiological domains. (Etablissement des courbes de variation de la densité du bois par exploration densitométrique de radiographies d'échantillons prélevés à la tarière sur des arbres vivants - Applications dans les domaines technologique et physiologique). Thèse de Doctorat en Sciences Appliquées, Université de Nancy I, Station de Recherches sur la Qualité des Bois, INRA-CRF, Nancy – Champenoux, France, 215 pp (in French). 14. Polge, H., 1973 : Ecological factors and quality of wood. Research station on the quality of
wood. National Forest Research Centre, INRA. (Facteurs écologiques et qualité du bois. Station de Recherches sur la Qualité des Bois, Centre national de Recherches forestières, I. N. R. A., Champenoux 54370 Einville), Ann. Sci. Forest. 30(3): 307-328 (in French). 15. Radon, J., 1917: Über die Bestimmung von funktionen durch ihre integralwerte längs
gewisser mannigfaltigkeiten. Berichte Sächsische Akademie der Wissenschaften, Leipzig, Math.-Phys. Kl., Vol. 29: 262-277.
Vol. 59 (2): 2014
16. Rasband, W.S., Image, J., 2011: U.S., National Institutes of Health, Bethesda, Maryland, USA, 1997 Available at: http://imagej.nih.gov/ij/, (Accessed September 2011).
17. Stewart, H.A., Polak, D.J., 1985: Relating specific gravity and mechanical properties of hardwoods to machining defects. Forest Prod. J. 35(10): 69-72.
18. Taina, I.A., Heck, R.J., Elliot, T.R., 2008: Application of X-ray computed tomography to soil science: A literature review. Can. J. Soil Sci. 88(1): 1-20.
19. Vallet, P., 2005: Impact de différentes stratégies sylvicoles sur la fonction « puits de carbone » des peuplements forestiers. Modélisation et simulation à l’échelle de la parcelle. Doctoral thesis, École Nationale du Génie Rural, des Eaux et des Forêts, France. Pp 25-47 (in French).
20. Wildenschild, D., Hopmans, J.W., Vaz, C.M.P., Rivers, M.L., Rikard, D., Christensen, B.S.B., 2002: Using X-ray computed tomography in hydrology: Systems, resolutions, and limitations. J. Hydrol. 267: 285-297.
Kennouche Salim, Zerizer Abdelatif, Sitouah Nourdine, Aknouche Abdelhamid Université M’hamed Bougara
Unité De Recherche Matériaux-Procédé-Environnement Avenue De L’indépendance 35000 Boumerdès Algéria Phone: 213 24 91 29 51
Corresponding author: kennouchesalim@yahoo.fr Frederic Mothe
Name Laboratoire D’etude Des Ressources Forêt Bois Inra 54280 Champenoux
Nancy France