Contents lists available atScienceDirect
Phytochemistry
journal homepage:www.elsevier.com/locate/phytochem
Biochemical and biophysical characterization of water-soluble pectin from
Opuntia
ficus-indica and its potential cytotoxic activity
Khalef Lefsih
a,d,∗, Daniela Giacomazza
b, Rosa Passantino
b, Maria Assunta Costa
b,
Donatella Bulone
b, Maria Rosalia Mangione
b, Valeria Guarrasi
b, Francesco Mingoia
c,
Pier Luigi San Biagio
b, Khodir Madani
aaLaboratoire de Biomathématiques, Biophysique, Biochimie et Scientométrie, Faculté des Sciences de la Nature et de la Vie, Université de Bejaia, 06000, Bejaia, Algeria bIstituto di Biofisica, Consiglio Nazionale delle Ricerche, Palermo, Italy
cIstituto per lo Studio dei Materiali Nanostrutturati, Consiglio Nazionale delle Ricerche, Palermo, Italy
dDépartement de Biochimie et Microbiologie, Faculté des Sciences Biologiques et des Sciences Agronomiques, Université de Tizi ouzou, 15000, Tizi ouzou, Algeria
A R T I C L E I N F O
Keywords:
Opuntiaficus-indica (Cactaceae) Pectin Heat-modified pectin Rhamnogalacturonan Alditol-acetates TMS-Glycosides PMAA Light scattering Cytotoxicity A B S T R A C T
This work aims tofill the gap in the present knowledge about the structure of pectin from Opuntia ficus-indica. The water-soluble pectin (WSP) fraction, extracted with the Microwave Assisted Extraction (MAE), was further deproteinated (dWSP) and analyzed through several biophysical and biochemical techniques. HPSEC, light scattering and FTIR data showed that dWSP is low methylated high molecular weight pectin. The biochemical structure of dWSP, after methanolysis, silylation, carboxyl reduction showed that dWSP belongs to rhamnoga-lacturonan I class. Then, dWSP was heat-modified (HM) to obtain small-molecular weight deproteinated fraction (HM-dWSP). Both species, dWSP and HM-dWSP, were tested in LAN5 and NIH 3T3 model cells to study their biological effect. Results indicated that both dWSP and HM-dWSP exerted cytotoxic activity affecting selectively LAN5 cancer cells, without any effect on NIH 3T3 normal cells.
1. Introduction
An important non-cellulosic matrix polysaccharides in plants is pectin (Tanczos et al., 2003). It is a complex polysaccharide composed of α-1,4-linked D-galacturonic acid (GalA) backbone and segments
consisting of alternating sequences ofα-(1,2)-linkedL-rhamnosyl and
α-1,4-linked D-galacturonosyl residues ramified with side chains
com-posed mainly of arabinose, mannose and galactose (de Vries et al., 1983; Niaounakis, 2013). The carboxyl groups of the constituent ga-lacturonic acid molecules are esterified to varying extents, and pectins are mainly described as high- or low-methoxyl (HMP and LMP re-spectively), the latter having less than 50% of possible carboxyl groups esterified (Judd and Truswell, 1982). Pectin can be classified according to their molecular weight (Mw) into pectin with high Mw or low Mw (Zhang et al., 2015).
Pectin has lubricating and cementing functions. It is degraded during attack by plant pathogens and oligogalacturonides function as elicitor in the host-pathogen interaction (Albersheim et al., 1981). Commercial pectin is extracted from citrus, apple, or other higher plants, and is used as a stabilizer, thickener, gelling agent, emulsifier,
and drug vehicle in the food and pharmaceutical industries (Wicker et al., 2014). Applications of pectin in cancer therapy, antitumor ac-tivity of modified pectin and its application as an excipient for anti-tumor drugs have been reported (Zhang et al., 2015). Pectin and other sources of dietaryfibers are associated with gastrointestinal health, glucose tolerance, lipid digestion and weight management (Dikeman and Fahey, 2006). Many researches are carried out on the effects of what is called‘heat-modified’ (HM) pectin or ‘pectin oligosaccharides’ (POS), in which the native molecules have been broken down into smaller fragments that, in theory, can be absorbed by our organism. Action mechanisms against cancer are still unclear but evidence sug-gests that small pectin fragments can bind to the carbohydrate re-cognition domain on the pro-metastatic protein galectin-3 (Gal3) and may block its interactions with other proteins and peptides, inhibiting Gal3 ability to promote cell adhesion and migration, and to prevent apoptosis. This raises the possibility to use HM pectin and POS as po-tentially safe, non-toxic approach for preventing or reducing carcino-genesis (Maxwell et al., 2012). The modified commercial pectin was mainly used to explore its bioactivity. It is possible that other plant sources, in combination with alternative extraction procedures, may
https://doi.org/10.1016/j.phytochem.2018.06.015
Received 6 March 2018; Received in revised form 23 June 2018; Accepted 26 June 2018
∗Corresponding author. Laboratoire de Biomathématiques, Biophysique, Biochimie et Scientométrie, Faculté des Sciences de la Nature et de la Vie, Université de Bejaia, 06000, Bejaia,
Algeria.
E-mail address:klefsih@yahoo.fr(K. Lefsih).
0031-9422/ © 2018 Elsevier Ltd. All rights reserved.
afford more functional and bioactive products.
Despite enormous efforts that have been made in the search for novel drugs and treatments, cancer continues to be a major public health problem. Moreover, the emergence of resistance to cancer che-motherapy often prevents complete remission. Researchers have thus turned to natural products mainly from plant origin to circumvent bacterial resistance. Pectin and pH-modified or heat-modified (HM) pectin have demonstrated chemo-preventive and antitumor activities against some aggressive and recurrent cancers. In the present work, the deproteinated chemical structures of water soluble pectin (dWSP) fraction from Opuntia ficus-indica, a widespread plant in the Mediterranean area, was determined by biochemical and biophysical methods. Furthermore, to the best of our knowledge, for thefirst time the effect of dWSP and its heat-modified derivative (HM-dWSP) were tested on human neuroblastoma LAN5 and normalfibroblast NIH 3T3 model cells. We report that both molecular species are able to cause significantly slowdown of the cellular grow rate only in cancer cells without affecting normal ones.
2. Results and discussion 2.1. WSP deproteination
To avoid any interference during chemical derivatization for bio-chemical and structural analysis of the extracted WSP, a deproteination step seems to be of great importance. Proteins were removed using a modified Sevag method (York et al., 1986). Samples were scanned in the 240–400 nm wavelength range. A great decrease in protein con-centration was observed after protein removal procedure, pointed out by the reduction of the absorption at 260–280 nm. Purification of the crude polysaccharide by Sevag method is based on the precipitation of protein with chloroform and n-butanol (Sevag et al., 1938).
In WSP the proteins total amount is 0.66% and it reduces to 0.063% after the Sevag deproteination steps. This means that the deproteination extent is about 90.50%. A loss of pectin is observed if Sevag deprotei-nation is repeated many times. In fact, proteins cannot be completely eliminated because they are tightly connected to some pectic sites (Liu et al., 2008;Xie et al., 2011), particularly to the low molecular pectic fraction (Goycoolea and Cárdenas, 2003).
2.2. Molecular weight and size analysis
HPSEC analysis of WSP was already done in previous work (Lefsih Khalef et al., 2017). It is constituted of high molecular weight pectin appeared in the elution volume between 11 and 16 mL, while a smaller molecular weight proteinaceous fraction eluted between 18 and 20 mL. This last fraction was eliminated by Sevag deproteination step. The DLS measurements were done to check the effect of heat treatment on the degradation of dWSP into oligosaccharides. The electricfield correla-tion funccorrela-tions, measured on dWSP before and after applying the de-gradation protocol (heat treatment), were analyzed by cumulant
method (Koppel, 1972). The values of the hydrodynamic radius and polydispersity index for dWSP were 114 nm and 0.59, while those of HM-dWSP were 44 nm and 0.58 (Supplementary Information Fig. S1). This is an evidence that the heat treatment at 120 °C/20min reduced of about three times the average size of pectin molecules without chan-ging the polydispersity index.
2.3. Monosaccharides composition of dWSP
Five standard alditol-acetates, prepared in our laboratory, were employed to ensure accurate identification of the monosaccharide's GC peaks observed during the analysis of dWSP samples. GC retention times (RT) of the alditol standards are provided as Supplementary Information (Fig. S2).
GC chromatogram stemming from dWSP, and retention times of detected alditol-acetates are displayed inTable 1. Six different acety-lated alditols have been detected, rhamnitol, arabinitol, xylitol, glucitol and galactitol with relative contents of 6.20%, 15.07%, 2.89%, 11.40% and 23.10%, respectively.
It is well known that the decarboxylation of GalA, under reductive conditions, gives arabinose (Avigad et al., 1961;Conrad, 1931). So, we can say that the presence of arabinose is mainly stemming from the decarboxylation of GalA. This suggestion is confirmed by both TMS-derivatization and PMAA as we can see later.
Generally, there are very few studies showing that glucose (Glc) is part of the pectin structure.Zhang et al. (2013)have reported glucose as the second most abundant component of apple pectin (28.7%), which was ascribed to remnant soluble sugar that was not completely removed during the processing of pectin. However,Nunes et al. (2012) have shown the occurrence of GalA substituted by glucose, and Glc- β-(1-4)–Glc as structural features occurring in pectic polysaccharides, which could account for the glucose found in the composition of pectic ma-terial. Furthermore, glucose content might also be from non-pectic polysaccharides that were also extracted. Thesefindings were probably due to the intensive binding of some proteins to polysaccharides and the existence of glycoprotein or proteoglycan. These binding proteins couldn't be easily eliminated by Sevag method (Chen et al., 2012).
The mass spectra of the analyzed carbohydrates were dominated by fragment ions at m/z 73, 117, 147, 204, 217, 361, 437, and 451. The RT were constant at the GC conditions with the derivatization procedures performed in this study. Fragments are typically produced by cleavage of the alditol chain (primary fragments) or by elimination of ions (secondary fragments) such as acetoxy group (m/z59), acetic acid (m/ z60), formaldehyde (m/z 30) and ketene (m/z 42) (Biermann and McGinnis, 1988). The interpretation of the mass fragmentation for glucitol-hexaacetate, mannitol-hexaacetate and galactitol-hexaacetate is complex because they are stereoisomers having similar fragmenta-tions. Significant ions such as m/z 145 (cleavage between C-2 and C-3), m/z 218 (cleavage between 3 and 4), m/z 289 (cleavage between C-4 and C-5) and m/z 361 (cleavage between C-5 and C-6) indicate pre-sence of glucitol-hexaacetate.
Table 1
Monosaccharides composition detected as alditol-acetates and their relative concentrations.
Alditol Retention time (min) Relative Concentration (%) Significant ions (m/z) Neutral sugars Rhamnitol 18.90 06.20 115 > 99 > 129 > 159 > 70 > 145 > 201 > 217 Arabitol 19.25 15.07 129 > 171 > 115 > 99 > 157 > 87 Xylitol 19.74 02.89 129 > 171 > 115 > 157 Glucitol 26.93 11.40 115 > 145 > 103 > 128 > 187 > 170 > 217 Galactitol 27.18 23.10 115 > 139 > 187 > 157 > 103 > 259 > 217 Uronics acids Galacturonic acida / 41.25 /
a The content of GalA (41.25%) has been calculated from the following equation derived from calibration curve of GalA in 3-phenylphenol microassay. GalA % = (DO–
The mass fragmentation pattern for galactitol-hexaacetate, glucitol-hexaacetate and mannitol-glucitol-hexaacetate can be distinguishable due to difference in the intensity and significance of the m/z peaks. The dif-ference between the spectra of glucitol-hexaacetate and mannitol-hex-aacetate was in the intensity of the m/z 139, m/z 187 and m/z 145 fragments. It is well known that under the usual EI mass spectroscopic conditions, it is almost impossible to discriminate between stereo-chemical differences within one class of alditols acetates (Aspinall, 1982). Combination of the mass spectroscopic data with the GC re-tention times enhances the reliability of the assignments.
2.4. Cycle form analysis: TMS-derivatives
Very little difference can be seen between the α- and β-furanoside mass spectra in general. These anomers have to be identified based on the difference in retention time on the GC column. However, there is a large difference between the pyranoside compared to the furanoside. The main peak at m/z 217 in the furanoside form is reduced in the pyranoside form, and the peaks at m/z 204 and 191 (not present in the furanoside spectrum) appear in the pyranoside form (Medeiros and Simoneit, 2007b).
This characteristic difference in the mass spectrum can be used to distinguish between furanoside and pyranoside forms of a sugar. The presence of only m/z 217 indicates the presence of a furanoside form of the sugar. The peak at m/z 73 is due to the trimethylsilyl compound that replaced all the active hydrogens in the–OH groups in the sugar during derivatization (Aspinall, 1982).
All the features in the GC-MS, obtained from the standards TMS-glycosides (SeeSupplementary Information Fig. S3), were used to help us to determine the structure of the monosaccharides in dWSP. Thus, GC retention times are valuable information for the correct identifica-tion of sugar compounds of our sample. The retenidentifica-tion times were checked repeatedly for all sugar compounds. Fifteen peaks were re-vealed in GC-MS analysis of dWSP (Table 2).
The mass spectra characteristics and features in the 15 sugars agreed completely with that of TMS derivatives described in literature (Medeiros and Simoneit, 2007a; Taylor and Conrad, 1972). The low concentration of arabinose determined here, confirm our previous suggestion stipulating most of arabitol acetate detected in AA method was arising from the decarboxylation of GalA. For its part, GalA is mainly detected asβ-Galp,1-methyl-6-deoxy-2,3,4-tris-O-TMS (20.02%) and β-Galf,methyl-6-deoxy-2,3,4-tris-O-TMS (3.66%), confirming an occurred decarboxylation. However, non-decarboxylated form is pre-sent as methylester, α-GalAf,1-methyl,2,3,5-tris-O-TMS,6-methylester and β-GalAf,1-methyl,2,3,5-tris-O-TMS,6-methylester, respectively.
Galactose is the principal monosaccharide detected mainly as β-Galp,1-methyl,2,3,4,6-tetra-O-TMS (50.01%) and α-Galp,methyl,2,3,4,6-tetra-O-TMS (2.87%), followed by glucose identified as α-Glup,1,2,3,4,6-penta-O-TMS (1.91%), Glup,1,2,3,4,6-Penta-O-TMS (1.06%), β-Glup,1-methyl,2,3,4,6-tetra-O-TMS (2.35%) and α-Glup,1-me-thyl,2,3,4,6-tetra-O-TMS (7.66%).
2.5. Linkage pattern: PMAA and carboxyl-reduced procedure
The methylation of carbohydrates and further derivatization to PMAA is a common method in sugar analysis to obtain unambiguous information regarding the position of linkages and to determine the extent of branching (Thevis et al., 2000). The positions of the various substituents are subsequently located by GC/MS in order to determine which of the hydroxyl groups were originally involved in bonding (Pettolino et al., 2012).
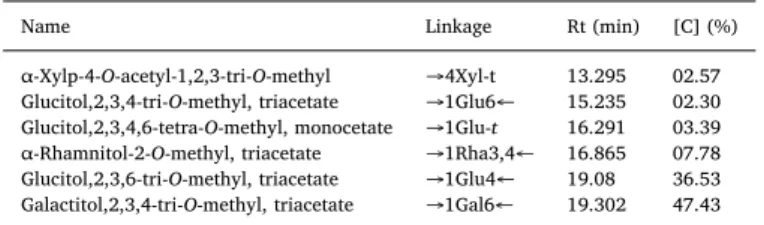
Table 3shows that six categories of partially methylated alditol acetates have been yielded, α-Xylp-4-O-acetyl-1,2,3-tri-O-methyl (02.57%), Glucitol, 2,3,4-tri-O-methyl-triacetate (02.30%), Glucitol, 2,3,4,6-tetra-O-methyl-monocetate (03.39%), α-Rhamnitol-2-O-methyl-triacetate (07.78%), Glucitol, 2,3,6-tri-O-methyl-α-Rhamnitol-2-O-methyl-triacetate (36.53%), Galactitol, 2,3,4-tri-O-methyl-triacetate (47.43%).
In the carboxyl-reduced procedure, the GalA residues undergo a carboxyl reduction in order to distinguish between the partially me-thylated galactitol acetate stemming from GalA and the other one arising from galactose residues naturally present in dWSP. The detec-tion of Galactitol,1,4,5-tri-acetate,2,3,6-tri-O-methyl deuterated at C6
position proves that it is emanating from GalA. Moreover, the positions of acetyl groups suggested that the GalA residues in dWSP have (1→ 4) linkage pattern.
It's worth noting that the chemical composition of polysaccharides extracted from of Opuntia cladodes have been described in several re-search works, with important inconsistencies in their results. For some authors, the polysaccharides were neutral with mainly galactose and arabinose residues (Malainine et al., 2003;Ribeiro et al., 2010). Others suggest the mucilage was acidic and containedL-arabinose,D-galactose,
L-rhamnose andD-galacturonic acid (Malainine et al., 2003).Parikh and Jones (1965)have reported that the mucilage of Opuntia fulgida con-sisted of a backbone ofβ(1 → 3)-linked galactose units with branches on carbon C-6 containingD-galacturonic acid,D-galactose,D-xylose,L
-rhamnose andL-arabinose units. The mucilage of O.ficus-indica was
analyzed byAmin et al. (1970)and they found that it was neutral and contained arabinose, galactose, rhamnose and xylose residues. How-ever, the mucilage of spineless O.ficus-indica contained both neutral and acidic fractions (Paulsen and Lund, 1979).Goycoolea and Cárdenas (2003), reported that the cactus pectin extract afforded by the alkaline process consists of 85.4% uronic acids and 14.6% of neutral sugars, Galactose and arabinose predominate as the main constituent neutral sugars with a minor presence of rhamnose and xylose, a profile that accounts for the presence of diverse species of arabinogalactans in the branched regions that are inserted along the homogalacturonan chain. Different neutral sugars occur exclusively in the side chains of pectins,L-rhamnose,D-galactose, andL-arabinose occur most frequently; D-xylose andD-glucose are found rarely (Thakur et al., 1997). In this
work, the acidic sugars content of the studied dWSP was lower than that Table 2
Total TMS-glycosides obtained from dWSP for Cycle form and anomery ana-lysis. TMS-glycoside Rt* [C]** (%) β-Araf,1-methyl 2,3,5-tris-O-TMS 17.39 2.43 β-Galf-methyl-6-deoxy-2,3,4-tris-O-TMS 18.016 3.66 α-Arap,1,2,3,4-Tetra-O-TMS 19.384 1.11 α-Rhap,1,2,3,4-tetra-O-TMS 19.834 1.78 β-Xylp,1,2,3,4-tetra-O-TMS 20.566 2.53 α-GalAf,1-methyl,2,3,5-tris-O-TMS,6- methylester 25.586 0.31 β-GalAf,1-methyl,2,3,5-tris-O-TMS,6- methylester 26.088 0.83 α-Glup,1-methyl, 2,3,4,6–tetra-O-TMS 26.686 7.66 α-Galp,methyl 2,3,4,6–tetra-O-TMS 27.714 2.87 β-Glup,1-methyl, 2,3,4,6-tetra-O-TMS 27.998 2.35 β-Galp,1-methyl, 2,3,4,6-tetra-O-TMS 28.542 50.01 α-Glup,1,2,3,4,6-penta-O-TMS 28.839 1.91 β-Galp,1-methyl-6-deoxy-2,3,4-tris-O-TMS 29.188 20.02 α-Xylp,1,2,3,4-tetra-O-TMS 29.436 1.43 β-Glup,1,2,3,4,6-pent-O-TMS 32.108 1.06
Rt*: Retention time in minutes. [C]** (%): relative concentration.
Table 3
Total PMMA obtained from dWSP for linkage pattern analysis.
Name Linkage Rt (min) [C] (%) α-Xylp-4-O-acetyl-1,2,3-tri-O-methyl →4Xyl-t 13.295 02.57 Glucitol,2,3,4-tri-O-methyl, triacetate →1Glu6← 15.235 02.30 Glucitol,2,3,4,6-tetra-O-methyl, monocetate →1Glu-t 16.291 03.39 α-Rhamnitol-2-O-methyl, triacetate →1Rha3,4← 16.865 07.78 Glucitol,2,3,6-tri-O-methyl, triacetate →1Glu4← 19.08 36.53 Galactitol,2,3,4-tri-O-methyl, triacetate →1Gal6← 19.302 47.43
reported for pectins sourced from other species comparatively with neutral sugars content. The important content of galactose together with the low rhamnose content, may suggest the existence of regions of long side chains of galactans. The important content of glucose may suggest that it is naturally occurring in our pectin or, most likely, it highlights the presence of hydrosoluble glucan interlinked with pectin. The combination of the results stemming from the different che-mical derivatisations, for structural analysis, are used to build a hypo-thetic structure of dWSP, which is made of a rhamnogalacturonan principal backbone, which is the case for the most known pectins. Side chains of glucan and galactan are connected to the main backbone through the rhamnosyl residues. In fact, the amount of side chains is, in occurrence, the percent ofα-Rhamnitol-2-O-methyl-triacetate (7.78%). So, we can conclude that dWSP belong to rhamnogalacturonan I class.
2.6. Degree of methylation (DM) analysis
Several methods used for qualitative analysis of DM of pectin in-clude colorimetry and chromatography (Barros et al., 2002) and ca-pillary electrophoresis (Zhong et al., 1998). However, measuring in-terferences in the colorimetric analysis and the complexity of chromatographic and electrophoretic methods are a real disadvantage. Hence, alternative methods have been proposed. Fourier Transform Infrared (FT-IR) spectroscopy, which determines the DM of pectin without hydrolyzing the ester linkage, has been applied (Kyomugasho et al., 2015;Monsoor et al., 2001;Zhong et al., 1998).
It is inferred that the ratio of the area of the band at 1740 cm−1 (corresponding to the number of esterified carboxylic groups) over the sum of the areas of the bands at 1740 cm−1and 1610 cm−1 (corre-sponding to the number of total carboxylic groups) should be propor-tional to the degree of methylation (DM) as given by equation (1) stemming from the calibration curve achieved with commercial pectin with a known DM as stated before. The DM determined here for dWSP is 8.46%. ⎜ ⎟ = × ⎛ ⎝ + ⎞ ⎠ + = DM A A A R (%) 84.75 1740 7.4( 0.9942) 1740 1610 2 (1) where A1740and A1610are the surface areas of the bands at 1740 cm−1
and 1610 cm−1respectively.
2.7. Growth inhibitory effects of dWSP and HM-dWSP on human neuroblastoma cells
The MTS cell viability assay was used to investigate the effects of dWSP and HM-dWSP on LAN5 human neuroblastoma and NIH-3T3 normalfibroblast cells. Cells were treated with different concentrations of dWSP and HM-dWSP for 24, 48 and 72 h. As shown inFig. 1, a dose-dependent reduction of cells viability is observed in LAN5 neuro-blastoma cells both with dWSP and with HM-dWSP.
Conversely, the NIH-3T3 normal cells were not affected. The most effective concentration, 2 mg/mL, reduced cell viability of about 80%. Nevertheless, the microscopic observation of LAN5 cells after 24 h of treatment did not confirm the MTS results showing any difference in cell morphology and density (data not shown).
To deeply investigate this apparent difference, we performed an-other assay for monitoring the cell viability, which is the Trypan Blue exclusion test. The higher concentration (2 mg/mL) of dWSP and HM-dWSP used in the MTS assay was applied to treat both LAN5 and NIH-3T3 cells for 24, 48 and 72 h. The results shown inFig. 2confirmed the MTS results in LAN5 cells after 48 and 72 h of treatment. After 24 h, the number of viable cells was comparable to control. Interestingly, both dWSP and HM-dWSP caused cytotoxic effect selectively in cancer cells, being the HM-dWSP more effective after 48 h.
To further investigate the viability of LAN5 cells after 24 h of treatment with 2 mg/mL of dWSP or HM-dWSP, nuclei were stained by
Fig. 1. Effects of dWSP and HM-dWSP on cell viability. LAN5 and NIH-3T3 cells were treated with dWSP or HM-dWSP at different concentrations (0.1, 0.5, 1, 2 mg/mL) for 24, 48 and 72 h. The effects were determined by the MTS assay. The data are shown as means ± SD. P < 0.05 vs. untreated control.
Fig. 2. Anti-proliferative activity of dWSP and HM-dWSP. LAN5 and NIH-3T3 cells were treated with dWSP or HM-dWSP at 2 mg/mL for 24, 48 and 72 h. The number of cells were determined by Trypan Blue exclusion test. The data are shown as means ± SD. P < 0.05vs. untreated control.
Hoechst 33342. Nuclear morphology of LAN5 cells was not modified by treatment (Fig. 3b and c), and comparable to untreated cells (Fig. 3a). Furthermore, also in the case of NIH-3T3 treated cells no difference was observed relatively to the control (Fig. 3d–f).
LAN5 cells after 48 and 72 h of treatment with 2 mg/mL of dWSP or HM-dWSP were also labeled with Annexin-V and Propidium Iodide (PI). In this assay, cells in early apoptosis are Annexin-V-positive (green signaling) and PI-negative, cells in late apoptosis are doubly positive to Annexin-V and PI (orange signaling), necrotic cells positive to PI (red signaling), whereas healthy cells are doubly negative to Annexin-V and PI. Fluorescence microscopy observation showed that in LAN5 cells treated or not, the number of apoptotic and/or necrotic cells were comparable both at 48 and 72 h of treatment (Fig. 4g–i panel A, l-n panel B). Moreover, bright field images show reduction of cellular density both at 48 and 72 h of treatment with dWSP or HM-dWSP with reference to the control (Fig. 4a–c panel A, d-f panel B).
We can conclude that 2 mg/mL of dWSP and HM-dWSP induce a remarkable and significant slowdown of cell growth rate in LAN5 human neuroblastoma cells already observable at 48 h of treatment. Induction of apoptotic cell death was not observed; nevertheless it is possible that higher concentrations of pectins are needed. It would be interesting to test these pectins on other types of cancer cells. Several in vitro and in vivo studies have shown that various forms of modified pectin have antitumor properties (for review seeLeclere et al. (2013)). This is thefirst report in which pectin from O. ficus-indica is tested for biological activity in in vitro experiments on human neuroblastoma cells never investigated with any pectin derived from other plant.
3. Experimental
3.1. List of chemicals
Pyridine (360570-500 ML-D), Galacturonic acid (48280-5G-F), Methanolic HCl (33355), N,O-Bis(trimethylsilyl)-trifluoroacet-amide + Trimethylchlorosilane (BSTFA + TMCS) (25561-30-2), tri-fluoroacetic acid (TFA) (299537), Glucose (G8270), Mannose (63579), Galactose (G0750), Arabinose (A3131), Rhamnose (W373011),
Dichloromethane (L090000), Sodium borodeuteride (NaBD4) (205591),
Acetic anhydride, Ethanol 96%, concentrated HCl, Bovine Serum Albumin, Dulbecco's Modified Eagle Medium (DMEM)-high glucose, fetal bovine serum (FBS), bovine calf serum (BCS), penicillin and streptomycin, Bovine Serum Albumin, Phenol were purchased from Sigma-Aldrich, (Milan, Italia). Bradford reagent was purchased from BioRad. MilliQ water was used for all preparations.
3.2. Plant materials
The plant material was collected, in June 2016, in the region of Bejaia in north Algeria with GPS coordinates (Latitude/Longitude): 36°45′0″ N and 5°4′60″ E. It's a region with a Mediterranean climate, characterized by a cold and rainy winter, and a hot and dry summer with temperatures between 0 °C and 38 °C. About 20 kg of fresh young cladodes were cut into small pieces and dried in ventilated oven at 60 °C overnight. Then, ground to getfine powder using an industrial grinder. Finally, a step of sifting is carried out and a powder offine granulo-metry (< 125μm) was recovered and stored in a hermetic bottle. 3.3. Water soluble pectin extraction and deproteination
Water Soluble Pectin (WSP) was extracted from 100 g of thefine granulometry powder of grinded and dried cladodes. WSP was ex-tracted with Microwave Assisted Extraction (MAE) in water under op-timized parameters (Lefsih Khalef et al., 2017). The optimum condi-tions of MAE were as follows: time = 2.16 min; microwave power = 517 W; pH = 2.26 and solid/water ratio 7% (w/v). The solu-tion was then cooled down at room temperature and centrifuged at 10,000 g for 15 min, supernatant was neutralized with 5 M NaOH. After neutralization, the supernatant was precipitated and centrifuged at 5,000 g/5min. The supernatant was micro-filtrated, concentrated, pre-cipitated with absolute ethanol96%, andfinally lyophilized.
The deproteination was accomplished with a modified Sevag method reported byFeng et al. (2010). Crude WSP solution (500 mL) was adjusted to pH 2 with 5 M HCl and heated at 120 °C/5 min. Then, the pH of the solution was adjusted to neutral by addition of 5 M NaOH Fig. 3. LAN5 and NIH-3T3 nuclear morphology. Fluorescence images of Hoechst staining after 24 h of treatment. (a, d) Untreated; (b, e) treated with dWSP; (c, f) treated with HM-dWSP. Original magnification x 20. Scale bar, 50 μm.
and the mixture was kept at 4 °C for 4 h. Sevag deproteination was carried out by adding 20 mL of Chloroform to the crude WSP solution (100 mL), followed by n-butanol (20 mL). The mixture was shaken and vortexed vigorously for 20 min and poured into a separating funnel. The denatured proteins were removed at the junction of the water and solvent layer. The Sevag procedure was repeated three times. Thefinal obtained solution contains the dWSP.
3.4. Heat modified water soluble pectin preparation
Heat-modified water soluble pectin (HM-dWSP) for biological tests was prepared by dissolving 3 g of dWSP in 100 mL of MilliQ water. The dispersion was then neutralized with 5 M NaOH and autoclaved at 120 °C for 30 min. A microfiltration was carried out with 0.45 μm Sartorius sterile microfilters.
3.5. Chemical and structural analysis
3.5.1. Neutral monosaccharides analysis: alditol-acetates derivatives Neutral monosaccharides were determined by the alditol-acetates method of Albersheim et al. (1967). The samples were hydrolyzed, reduced and acetylated. The resulted alditol-acetates were analyzed by GC-MS. An aliquot of dWSP (1 mg) and 50μg of myo-inositol were added to a clean glass tube and hydrolyzed in a solution of 2M TFA (2 ml) at 120 °C/2 h (Albersheim et al., 1967; Amelung et al., 1996). Once cooled down and dried under a constant stream of air, the sample was re-suspended in 300μL of 2-propanol and evaporated. The reduc-tion was done in excess of NaBD4(200μL, 10 mg/mL) in NH4OH
so-lution (1M) during 10 h. The reduced sample was neutralized with 150μL of acetic acid (30%) and dried with 100% methanol (200 μL, three times). Then, the acetylation was carried out with 50μL of acetic anhydride and 50μL of pyridine for 1 h at 100 °C vortexing at 20min of intervals. Once the sample cooled down at room temperature all sol-vents were evaporated under a gentle stream of nitrogen, followed by evaporation with 200μL of toluene. Sample was re-suspended in 4 mL of water and 1 mL of dichloromethane (DCM). Then, vortexed and centrifuged at 1000 g/2 min. The organic phase (bottom) was dried and
dissolved in 500μL of acetone and analyzed by GC-MS. Standards mixture was prepared in parallel as above, with the same steps and conditions.
The alditol-acetates derivatives were separated on a DB-5 capillary column (30 m × 0.25 mm, 0.25μm film thickness) and analyzed via their mass spectra using a Shimadzu GC-MS-QP2010 gas chromato-graph with EI (75eV) mass detection. Helium (flow rate of 1.2 mL/min) was the carrier gas. Samples were injected in the pulsed split mode with a split ratio of 1/17. The temperature of the GC was programmed to rise from 80 °C to 240 °C in the following way: held constant at 80 °C for 2 min; increased to 180 °C at a heating rate of 10 °C min−1; increased to 220 °C at a heating rate of 2 °C min−1; increased to 240 °C at a heating rate of 5 °C min−1, andfinally held at this temperature for 5 min. 3.5.2. Uronic acids content: 3-phenyphenol microassay
This method determines the content of galacturonic acid (GalA) in samples containing pectin, using a glass microtiter plate and microtiter plate-reading equipment with standard interferencefilters. The assay is a modification of a procedure involving the hydrolysis of pectin in 80% sulfuric acid at 80 °C followed by a coloring step with 3-phenylphenol reagent at room temperature (Blumenkrantz and Asboe-Hansen, 1973; Luzio, 2004). Different concentrations of GalA were prepared, 8, 16, 32 and 64μg/mL, respectively. 100 μL of each concentration were trans-ferred in test tubes (13 × 100 mm). 3 mL of sulfuric acid (96%), con-taining 0.1% of NaCl, was added to each tube and immediately vor-texed for 10 s. Then, 160μL were pipetted from each tube into the wells of microtiter plate and heated at 80 °C for 15min. Finally, 40μL of 3-phenylphenol solution 0.2% in glacial acetic acid was added to each well and absorbance was measured at 450 nm.
3.5.3. Cycle form: trimethylsilyl (TMS)-derivatives
Acid methanolysis was accomplished by adding 1 mL of 2 M HCl/ methanol to 1 g of dWSP sample in the pear-shapedflasks fitted with Teflon seals (Walford, 2010). Standard mixture was prepared in par-allel, with the same steps and conditions. After adding 50μg of myo-inositol, as internal standard, the samples were kept in an oven at 80 °C/16 h. The samples were cooled down at room temperature, Fig. 4. Annexin-V and Propidium Iodide (PI) labelling. Fluorescence microscopy observation at 48 and 72 h of treatment (g-i panel A, l-n panel B). Brightfield images at 48 and 72 h of treatment with dWSP or HM-dWSP with reference to the control (a-c panel A, d-f panel B).
200μL of methanol were added to destroy methanolic HCl. Then, the sample brought to dryness under nitrogenflush. Next, the samples were re-N-acetylated by addition of 4/1/1 methanol/pyridine/acetic anhy-dride to afinal volume of 200 μL. The tubes were tightly capped and incubated at 100 °C for 1 h. Then, the samples were cooled down again at room temperature and dried using dry nitrogenflush. Finally, sam-ples were derivatized with BSTFA + TMCS reagent (300μL)/20min/ 80 °C. Derivatized samples were dried and re-suspended in 1 mL of hexane. 2μL of silylated sugars were analyzed by GC-MS. Shimadzu GCMS-QP2010 gas chromatograph with mass detection was used with a ZB5 column (30 m × 0.25 mm × 0.25μm film thickness). Helium was used as carrier gas. Identification of the constituents was done through analysis of their retention times with respect to those of the standards and confirmed on computer matching against commercial NIST library mass spectra.
3.5.4. Linkage analysis: PMAA
The derivatization of a polysaccharide for methylation analysis in-cludes conversion of all free hydroxyl groups into methoxyls followed by acid hydrolysis. Acidic hydrolysis of the resulting poly-methyl-ethers only cleaves the inter-glycosidic linkages and leaves the methyl-ether bonds intact. The hydrolyzed monomers are reduced and acetylated to give volatile products, i.e., partially methylated alditol acetate (PMAA), which can be identified and quantitatively determined by gas-liquid chromatography equipped with a mass spectroscopic detector (GC-MS). The substitution pattern of the O-acetyl groups on the PMAA reflects the linkage patterns and ring sizes of the corresponding sugar in the original polymer (York et al., 1986). Experimentally, the reaction of conversion of the hydroxyl groups into methoxyls requires an alkaline environment and a methyl group provider. Permethylation has been carried out by using a sodium hydroxide suspension in dry dimethyl sulfoxide (DMSO) (Ciucanu and Kerek, 1984;Dell, 1990). A procedure adapted from Ciucanu's method. A prerequisite for the methylation reaction is the complete solubilization of polysaccharides in DMSO. This solubilization can be achieved by constant stirring and/or ultra-sonic treatment. Dry sodium hydroxide (20 mg) was added, and the mixture was stirred for 3 h at room temperature (22 °C). The mixture was stirred for further 2.5 h after addition of 0.3 mL of methyl iodide. The methylated polysaccharide was then extracted with 1 mL methy-lene chloride (DCM). The organic extract was passed through a sodium sulphate column to remove water, and then evaporated by a stream of nitrogen. The dried methylated polysaccharide was hydrolyzed in 0.5 mL of 4M TFA, in a sealed test tube at 100 °C for 6 h and the TFA was removed by evaporation under a stream of nitrogen and dissolved in 0.3 mL MilliQ water. The hydrolysate was reduced, using NaBD4and
acetylated with acetic anhydride (0.5 mL). Aliquots of the resultant partially methylated alditol acetates (PMAA) in DCM were injected on DB-5 capillary column (30 m × 0.25 mm, 0.25μm film thickness) and analyzed GC/MS with the same settings used for alditol-acetates. 3.5.5. Carboxyl reduction procedure
When polysaccharides contain uronic acids, such as rhamno-ga-lacturonans of plant pectins or other acidic polysaccharides, methyla-tion analysis becomes more difficult. The alkaline condimethyla-tions used for methylation analysis could causeβ-elimination. In addition, the uronic acids are generally resistant to acid hydrolysis; as a result, the linkage information of uronic acid and the neutral sugars to which they are attached could be lost during methylation analysis. This potential problem is avoided by a chemical reduction of the carboxyl group (York et al., 1986).
The reduction of the uronic acid was conducted following a proce-dure described byTaylor and Conrad (1972)andYork et al. (1986)with slight modifications. Pectin sample (10 mg) was dissolved in deuterium oxide (5 mL) and 100 mg of 1-cyclohexyl-3-(2-morpholinoethyl)-car-bodiimidemethyl-p-toluenesulfonate (CMC, Sigma) were added. The pH was adjusted and maintained at 4.75, using 0.1M HCl in deuterium
oxide. After 1 h, 1 g of sodium borodeuteride solved in 5 mL of deu-terium oxide was added over a period of 30 min, maintaining the re-action mixture at pH 7.0 using 2.0 M HCl in deuterium oxide during the reduction reaction.
The reaction was allowed to continue with constant stirring for 30 min at pH 7.0, after the addition of sodium borodeuteride. After ti-tration of the solution to pH 4.0, the reduced polysaccharide was se-parated from salts by dialysis against distilled water over night at room temperature (3500 molecular weight cut off), and the solution was lyophilized. The polysaccharide was dissolved in 0.5 mL of distilled water and 10% acetic acid in methanol was added to remove boric acid. 0.5 mL methanol were added and then evaporated. The last step was repeated three times. The mixture was dried with a stream of nitrogen. Finally, the carboxyl-reduced dWSP undergoes PMAA derivatization as described above.
3.6. HPSEC analysis
An aliquot (100μL) of dWSP (0.5 mg/mL) solution was analyzed with two columns coupled in series: Phenomenex Biosep (SEC S 2000, 300 × 7.8 mm) and Shodex SB HQ 806 (300 × 8.0 mm) thermostated at 20 °C with a Knauer oven and connected to a modular Prominence Shimadzu HPLC device equipped with a mobile phase degasser (DGU-20As), a quaternary pump (LC-2010 AT), a photodiode array detector (SPD-M20A), a manual injector (rheodyne steel) mounting a 50μL sample loop. The Prominence System was connected to a refractive index detector (Smartline RI 2300 Knauer). Refractive index signal was acquired by LC Solution software (Shimadzu). Samples were eluted with 0.02% sodium azide solution at 0.5 mL/min.
3.7. Dynamic light scattering (DLS)
Samples were placed into a thermostatic cell compartment of a Brookhaven Instruments BI200-SM goniometer. The temperature was controlled to within 0.1 °C using a thermostatic recirculating bath. The light scattered intensity and time autocorrelation function were mea-sured at 90° scattering angle by using a Brookhaven BI-9000 correlator and a 100 mW solid-state laser tuned atλ = 532 nm. The correlator operated in the multi-τ mode and the experimental duration was set to have at least 2000 counts on the last channel of the correlation func-tion. Data werefit by using the cumulant method (Koppel, 1972), to derive a z-averaged translational diffusion coefficient, which was con-verted to an average apparent hydrodynamic radius of an equivalent sphere, Rh, through the stoke-Einstein relationship Dz= kT/6πηRh(k:
Boltzmann's constant, T: absolute temperature,η: viscosity Dz:
trans-lational diffusion coefficient).
Before DLS measurements, all the solutions (1 mg/mL) werefiltered through 1.2μm cellulose acetate (Millipore) syringe filters to remove gross contaminants. To ascertain the absence of multiple-scattering effect, the sample turbidity was checked by measuring the apparent absorbance of pectin solutions in the visible range by using a Jasco UV-VIS Spectrophotometer V-530.
3.8. Determination of the degree of methylation (DM)
Samples were dissolved in D2O at the concentration of 5% (w/v%)
for FT-IR analysis. Infrared measurements on the samples were carried out with a Bruker Vertex 70 spectrometer equipped with a DTGS (Doped Triglycine Sulfate) detector, in a sample compartment, under continuum purging in dried N2atmosphere. The dWSP solutions were
loaded into a liquid cell equipped with CaF2windows 2 mm thick; a
25μm Teflon spacer was used. Measurements were performed in transmission mode, in the 400-4000 cm−1 frequency range. Every measurement is the sum of 256 interferograms at 4 cm−1resolution. Commercial pectins with DM of 34, 59, 65 and 78% were used for calibration curve. Pectins of known DM were solubilized in deionized
water and the pH adjusted to 6.0 with KOH. Considering that pKa of polygalacturonic acid is 3.38, this procedure guarantees the total io-nization of the carboxylic groups (Ravanat and Rinaudo, 1980).
3.9. Biological tests 3.9.1. Cell culture
The human malignant neuroblastoma LAN5 (ACC-673–DSMZ) and murine NIH 3T3 (SIGMA-ALDRICH)cell lines were cultured in Dulbecco's Modified Eagle Medium (DMEM)-high glucose supple-mented with 10% fetal bovine serum (FBS) and 10% bovine calf serum (BCS), respectively, 1% penicillin and streptomycin (10,000 U/mL and 10,000μg/mL, respectively) at 37 °C and 5% CO2humidified air.
3.9.2. MTS viability assay
The effects of dWSP and HM-dWSP on cell proliferation were ex-amined by MTS assay. LAN5 and NIH-3T3 cells were seeded into 96-well plates at a density of 4 × 10⁴and 1 × 10⁴/well, respectively. After 24 h, cells were treated with 0.1, 0.5, 1 or 2 mg/mL of dWSP or HM-dWSP and incubated for 24, 48 h and 72 h. At the end of the treatments, 20μL of CellTiter 96®AQueous One Solution Reagent (PROMEGA) were pipetted into each well of the 96-well assay plate. The plates were in-cubated at 37 °C for 4 h in a humidified 5% CO2 atmosphere.
Absorbance was read at 490 nm using a multi-well plate reader (BioRadiMarkTMMicroplate Reader). The effects of the treatment were
quantified as percentage of cell viability using untreated cells as a control.
3.9.3. Trypan blue exclusion test
Cell death was evaluated by Trypan blue (0.5% EuroClone), the most common stain used to distinguish viable cells from nonviable ones. In brief, LAN5 and NIH 3T3 cells were seeded into 96-well plates at a density of 4 × 10⁴and 1 × 10⁴/well in 200μL culture medium,
respectively. Cultures were incubated 24 h after which dWSP or HM-dWSP were added to obtain a final concentration of 2 mg/mL. Cells were harvested after 24, 48 and 72 h of treatment, diluted 1:1 in Trypan blue and counted under normal light microscopy using the Burker chamber. The effects of the treatment were quantified as percentage of viable cells using untreated cells as a control and as viable cells growth.
3.9.4. Hoechst nuclear staining
LAN5 and NIH 3T3 cells were plated on an 8-well Nunc Lab-Tek II chamber slide at a density of 8.8 × 10⁴and 2.2 × 10⁴/well in 400μL
culture medium, respectively, for 24 h and then treated with 2 mg/mL of dWSP or HM-dWSP for 24 h. After incubation, cells werefixed with 4% p-formaldehyde in PBS at room temperature for 20 min. Then, rinsed twice with PBS and stained with Hoechst 33342 fluorescent DNA-binding dye at 0.01 mg/mL at room temperature for 10 min. After rinsing three times with PBS, the chamber was removed and the slide sealed for the microscopic inspection. The nuclear morphology was observed using a DAPI filter (4,6-Diamidino-2-phenylindole: blue emitting DNA dye) for Hoechst on a Nikon Eclipse 80i microscope equipped for epifluorescence and recorded by a digital camera system. 3.9.5. Propidium Iodide (PI) and Annexin-V labeling
LAN5 and NIH 3T3 cells were plated on an 8-well Nunc Lab-Tek II chamber slide at a density of 8.8 × 10⁴and 2.2 × 10⁴/well in 400μL culture medium, respectively, for 24 h and then treated with 2 mg/mL of dWSP or HM-dWSP for 48 and 72 h. At the end of treatment, the medium was removed, washed once with culture medium (200μL) and washed twice with incubation buffer (100 μL). After removing cham-bers, slide was covered with Annexin-V-FLUOS labelling solution (100μL/chamber) containing Annexin-V-fluorescein and Propidium io-dide according to manufacturer's instructions (Annexin-V-Fluos Staining Kit-Roche). Next, coverslip was put on slide and incubated for 10 min at room temperature. Labelling cells were analyzed by
fluorescent microscope (Nikon Eclipse 80i microscope). 3.10. Statistical analysis
Values obtained for the cellular analysis were reported as the mean of three independent experiments ± standard deviation (SD). Results were compared using one way analysis of variance, ANOVA, with pairwise comparisons among treatments made using Tukey's HSD test. The analyses were performed using the OriginPro 8.1 statistical pro-gram (OriginLab Corp., Northampton, MA, USA), and the level of sig-nificance was set to P ≤ 0.05.
4. Conclusion
dWSP belong to rhamnogalacturonan I pectin class. In fact, bio-chemical and structural analysis of dWSP demonstrate that it is con-stituted of the main polyrhamnogalacturonate backbone with different side chains made up of neutral sugars, mainly glucan and galactan. dWSP and HT-dWSP exhibit an interesting cytotoxic activity inducing a significant slowdown of cell growth rate in LAN5 human neuroblastoma cells. No cytotoxicity effect was observed in NIH-3T3 normal cells.
Since pectin is ready available from O.ficus-indica, it can be func-tionalized and modified with other techniques. Cytotoxicity test can also be performed on other types of cancer cells to elucidate the anti-tumor efficacy and the molecular mechanisms of pectin action. Furthermore, in vivo tests can be conducted on mice and rabbits to get more insight into its biocompatibility. It may be useful biomaterial for nanogels, microencapsulation and drug delivery as well.
Acknowledgement
We infinitely thank the IBF-CNR laboratory, in Palermo, for funding this work and for providing us with all conditions.
Appendix A. Supplementary data
Supplementary data related to this article can be found athttp://dx. doi.org/10.1016/j.phytochem.2018.06.015.
References
Albersheim, P., Nevins, D.J., English, P.D., Karr, A., 1967. A method for the analysis of sugars in plant cell-wall polysaccharides by gas-liquid chromatography. Carbohydr. Res. 5, 340–345.
Albersheim, P., Darvill, A.G., McNeil, M., Valent, B.S., Hahn, M.G., Lyon, G., Sharp, J.K., Desjardins, A.E., Spellman, M.W., Ross, L.M., Robertson, B.K., Aman, P., Franzen, L.E., 1981. Structure and function of complex carbohydrates active in regulating plant-microbe interactions. Pure Appl. Chem. 53, 79.
Amelung, W., Cheshire, M.V., Guggenberger, G., 1996. Determination of neutral and acidic sugars in soil by capillary gas-liquid chromatography after trifluoroacetic acid hydrolysis. Soil Biol. Biochem. 28, 1631–1639.
Amin, E.S., Awad, O.M., El-Sayed, M.M., 1970. The mucilage of Opuntiaficus-indica mill. Carbohydr. Res. 15, 159–161.
Aspinall, G.O., 1982. The Polysaccharides, vol. 1 Academic Press.
Avigad, G., Asensio, C., Amaral, D., Horecker, B.L., 1961. Galacto-dialdose production with an enzyme from the mold polyporuscircinatus. Biochem. Biophys. Res. Commun. 4, 474–477.
Barros, A.S., Mafra, I., Ferreira, D., Cardoso, S., Reis, A., Lopes da Silva, J.A., Delgadillo, I., Rutledge, D.N., Coimbra, M.A., 2002. Determination of the degree of methyles-terification of pectic polysaccharides by FT-IR using an outer product PLS1 regres-sion. Carbohydr. Polym. 50, 85–94.
Biermann, C.J., McGinnis, G.D., 1988. Analysis of Carbohydrates by GLC and MS. Taylor & Francis.
Blumenkrantz, N., Asboe-Hansen, G., 1973. New method for quantitative determination of uronic acids. Anal. Biochem. 54, 484–489.
Chen, Y., Xie, M., Li, W., Zhang, H., Nie, S., Wang, Y., Li, C., 2012. An effective method for deproteinization of bioactive polysaccharides extracted from lingzhi (Ganoderma atrum). Food Sci. Biotechnol. 21, 191–198.
Ciucanu, I., Kerek, F., 1984. A simple and rapid method for the permethylation of car-bohydrates. Carbohydr. Res. 131, 209–217.
Conrad, C.M., 1931. The decarboxylation of d-galacturonic acid with special reference to the hypothetical formation of l-arabinose. J. Am. Chem. Soc. 53, 2282–2287.
Structural features of the neutral sugar side chains of apple pectic substances. Carbohydr. Polym. 3, 193–205.
Dell, A., 1990. [35] Preparation and desorption mass spectrometry of permethyl and peracetyl derivatives of oligosaccharides. Methods Enzymol. 193, 647–660.
Dikeman, C.L., Fahey, G.C., 2006. Viscosity as related to dietaryfiber: a review. Crit. Rev. Food Sci. Nutr. 46, 649–663.
Feng, L., Jia, X.-B., Shi, F., Chen, Y., 2010. Identification of two polysaccharides from Prunella vulgaris L. and evaluation on their anti-lung adenocarcinoma activity. Molecules 15, 5093.
Goycoolea, F.M., Cárdenas, A., 2003. Pectins from Opuntia spp.: a short review. J. Prof. Assoc. Cactus Dev. 5, 17–29.
Judd, P.A., Truswell, A.S., 1982. Comparison of the effects of high- and low-methoxyl pectins on blood and faecal lipids in man. Br. J. Nutr. 48, 451–458.
Koppel, D.E., 1972. Analysis of macromolecular polydispersity in intensity correlation spectroscopy: the method of cumulants. J. Chem. Phys. 57, 4814–4820.
Kyomugasho, C., Christiaens, S., Shpigelman, A., Van Loey, A.M., Hendrickx, M.E., 2015. FT-IR spectroscopy, a reliable method for routine analysis of the degree of methy-lesterification of pectin in different fruit- and vegetable-based matrices. Food Chem. 176, 82–90.
Leclere, L., Van Cutsem, P., Michiels, C., 2013. Anti-cancer activities of pH-or heat-modified pectin. Front. Pharmacol. 4.
Lefsih Khalef, Giacomazza, D., Dahmoune, F., Mangione, M.R., Bulone, D., San Biagio, P.L., Passantino, R., Costa, M.A., Guarrasi, V., Madani, K., 2017. Pectin from Opuntia ficus indica: optimization of microwave-assisted extraction and preliminary char-acterization. Food Chem. 221, 91–99.
Liu, F., Zhu, X.H., Liu, M., Zhou, J., Che, X.P., Han, R.F., 2008. [Study on deproteinization and decoloration in extraction of polysaccharides from Rabdosia rubescens]. Zhong Yao Cai 31, 751–753.
Luzio, G.A., 2004. Determination of galacturonic acid content of pectin using a microtiter plate assay. Proc. Fla. State Hortic. Soc. 117, 416–421.
Malainine, M.E., Dufresne, A., Dupeyre, D., Mahrouz, M., Vuong, R., Vignon, M.R., 2003. Structure and morphology of cladodes and spines of Opuntiaficus-indica. Cellulose extraction and characterisation. Carbohydr. Polym. 51, 77–83.
Maxwell, E.G., Belshaw, N.J., Waldron, K.W., Morris, V.J., 2012. Pectin– an emerging new bioactive food polysaccharide. Trends Food Sci. Technol. 24, 64–73.
Medeiros, P.M., Simoneit, B.R., 2007a. Analysis of sugars in environmental samples by gas chromatography–mass spectrometry. J. Chromatogr. A 1141, 271–278.
Medeiros, P.M., Simoneit, B.R.T., 2007b. Analysis of sugars in environmental samples by gas chromatography-mass spectrometry. J. Chromatogr., A 1141, 271–278.
Monsoor, M., Kalapathy, A., Proctor, U., 2001. Improved method for determination of pectin degree of esterification by diffuse reflectance Fourier transform infrared spectroscopy. J. Agric. Food Chem. 49, 2756–2760.
Niaounakis, M., 2013. Biopolymers: Reuse, Recycling, and Disposal. William Andrew.
Nunes, C., Silva, L., Fernandes, A.P., Guiné, R.P., Domingues, M.R.M., Coimbra, M.A., 2012. Occurrence of cellobiose residues directly linked to galacturonic acid in pectic polysaccharides. Carbohydr. Polym. 87, 620–626.
Parikh, V., Jones, J., 1965. Oxidation of sugars with ruthenium dioxide-sodium periodate: a simple method for the preparation of substituted keto sugars. Can. J. Chem. 43, 3452–3453.
Paulsen, B.S., Lund, P.S., 1979. Water-soluble polysaccharides of Opuntiaficus-indica cv “Burbank's spineless”. Phytochemistry 18, 569–571.
Pettolino, F.A., Walsh, C., Fincher, G.B., Bacic, A., 2012. Determining the polysaccharide composition of plant cell walls. Nat. Protoc. 7, 1590–1607.
Ravanat, G., Rinaudo, M., 1980. Investigation on oligo- and polygalacturonic acids by potentiometry and circular dichroism. Biopolymers 19, 2209–2222.
Ribeiro, E. M. d. O., Silva, N. H. d., Lima Filho, J. L. d., Brito, J. Z. d., Silva, M. d. P. C. d., 2010. Study of carbohydrates present in the cladodes of Opuntiaficus-indica (fodder palm), according to age and season. Food Sci. Technol. 30, 933–939.
Sevag, M., Lackman, D.B., Smolens, J., 1938. The isolation of the components of strep-toeoeeal nueleoproteins in serologieally active form. J. Biol. Chem. 124, 425–436.
Tanczos, I., Schwarzinger, C., Schmidt, H., Balla, J., 2003. THM-GC/MS analysis of model uronic acids of pectin and hemicelluloses. J. Anal. Appl. Pyrol. 68–69, 151–162.
Taylor, R.L., Conrad, H., 1972. Stoichiometric depolymerization of polyuronides and glycosaminoglycuronans to monosaccharides following reduction of their carbodii-mide-activated carboxyl group. Biochemistry 11, 1383–1388.
Thakur, B.R., Singh, R.K., Handa, A.K., Rao, M., 1997. Chemistry and uses of pectin—a review. Crit. Rev. Food Sci. Nutr. 37, 47–73.
Thevis, M., Opfermann, G., Schänzer, W., 2000. Mass spectrometry of partially methy-lated alditol acetates derived from hydroxyethyl starch. J. Mass Spectrom. 35, 77–84.
Walford, S., 2010. GC-ms as a tool for carbohydrate analysis in a research envirnoment. Proc. Int. Soc. Sugar Cane Technol. 27.
Wicker, L., Kim, Y., Kim, M.-J., Thirkield, B., Lin, Z., Jung, J., 2014. Pectin as a bioactive polysaccharide– extracting tailored function from less. Food Hydrocolloids 42, 251–259 Part 2.
Xie, L.Y., Zhang, Y., Peng, W.H., Gan, B.C., 2011. [Study on methods of deproteinization from Phellinus baumii polysaccharide]. Zhong Yao Cai 34, 293–295.
York, W.S., Darvill, A.G., McNeil, M., Stevenson, T.T., Albersheim, P., 1986. Isolation and characterization of plant cell walls and cell wall components. Methods Enzymol. 118, 3–40.
Zhang, H., Zhang, F., Wu, J., 2013. Physically crosslinked hydrogels from polysaccharides prepared by freeze–thaw technique. React. Funct. Polym. 73, 923–928.
Zhang, W., Xu, P., Zhang, H., 2015. Pectin in cancer therapy: a review. Trends Food Sci. Technol. 44, 258–271.
Zhong, H.-J., Williams, M.A.K., Goodall, D.M., Hansen, M.E., 1998. Capillary electro-phoresis studies of pectins. Carbohydr. Res. 308, 1–8.