HAL Id: cea-00307623
https://hal-cea.archives-ouvertes.fr/cea-00307623
Submitted on 29 Jul 2008
HAL is a multi-disciplinary open access
archive for the deposit and dissemination of
sci-entific research documents, whether they are
pub-lished or not. The documents may come from
teaching and research institutions in France or
abroad, or from public or private research centers.
L’archive ouverte pluridisciplinaire HAL, est
destinée au dépôt et à la diffusion de documents
scientifiques de niveau recherche, publiés ou non,
émanant des établissements d’enseignement et de
recherche français ou étrangers, des laboratoires
publics ou privés.
deviating gene expressions.
Séverine A Degrelle, Christelle Hennequet-Antier, Hélène Chiapello, Karine
Piot-Kaminski, Francois Piumi, Stéphane Robin, Jean-Paul Renard, Isabelle
Hue
To cite this version:
Séverine A Degrelle, Christelle Hennequet-Antier, Hélène Chiapello, Karine Piot-Kaminski, Francois
Piumi, et al.. Amplification biases: possible differences among deviating gene expressions.. BMC
Genomics, BioMed Central, 2008, 9 (46), pp.46. �10.1186/1471-2164-9-46�. �cea-00307623�
Open Access
Research article
Amplification biases: possible differences among deviating gene
expressions
Séverine A Degrelle
1, Christelle Hennequet-Antier
2,5, Hélène Chiapello
2,
Karine Piot-Kaminski
2,6, Francois Piumi
3,7, Stéphane Robin
4,
Jean-Paul Renard
1and Isabelle Hue*
1Address: 1Biologie du Développement et Reproduction UMR 1198; ENVA; CNRS, FRE 2857, Institut National de la Recherche Agronomique,
F-78350 Jouy-en-Josas, France, 2Mathématique, Informatique et Génome UR1077, Institut National de la Recherche Agronomique, F-78350
Jouy-en-Josas, France, 3Radiobiologie et Etude du Génome UMR INRA/CEA, Institut National de la Recherche Agronomique, F-78350 Jouy-en-Josas,
France, 4Mathématiques et Informatique Appliquées UMR INAPG/ENGREF/INRA 518, F-75005 Paris, France, 5Station de Recherches Avicoles,
Institut National de la Recherche Agronomique, F-37380 Nouzilly, France, 6Modélisation et Ingénierie des Systèmes Complexes pour le Diagnostic
FRE3009 CNRS/BIO-RAD, F-34184 Montpellier Cedex 4, France and 7Biologie des Champignons Filamenteux UFR ESIL, F-13288Marseille Cedex
09, France
Email: Séverine A Degrelle - [email protected]; Christelle Hennequet-Antier - [email protected]; Hélène Chiapello - [email protected]; Karine Piot-Kaminski - [email protected];
Francois Piumi - [email protected]; Stéphane Robin - [email protected]; Jean-Paul Renard - [email protected]; Isabelle Hue* - [email protected]
* Corresponding author
Abstract
Background: Gene expression profiling has become a tool of choice to study pathological or developmental questions but in
most cases the material is scarce and requires sample amplification. Two main procedures have been used: in vitro transcription (IVT) and polymerase chain reaction (PCR), the former known as linear and the latter as exponential. Previous reports identified enzymatic pitfalls in PCR and IVT protocols; however the possible differences between the sequences affected by these amplification defaults were only rarely explored.
Results: Screening a bovine cDNA array dedicated to embryonic stages with embryonic (n = 3) and somatic tissues (n = 2), we
proceeded to moderate amplifications starting from 1 μg of total RNA (global PCR or IVT one round). Whatever the tissue, 16% of the probes were involved in deviating gene expressions due to amplification defaults. These distortions were likely due to the molecular features of the affected sequences (position within a gene, GC content, hairpin number) but also to the relative abundance of these transcripts within the tissues. These deviating genes mainly encoded housekeeping genes from physiological or cellular processes (70%) and constituted 2 subsets which did not overlap (molecular features, signal intensities, gene ID). However, the differential expressions identified between embryonic stages were both reliable (minor intersect with biased expressions) and relevant (biologically validated). In addition, the relative expression levels of those genes were biologically similar between amplified and unamplified samples.
Conclusion: Conversely to the most recent reports which challenged the use of intense amplification procedures on minute
amounts of RNA, we chose moderate PCR and IVT amplifications for our gene profiling study. Conclusively, it appeared that systematic biases arose even with moderate amplification procedures, independently of (i) the sample used: brain, ovary or embryos, (ii) the enzymatic properties initially inferred (exponential or linear) and (iii) the preliminary optimization of the protocols. Moreover the use of an in-house developed array, small-sized but well suited to the tissues we worked with, was of real interest for the search of differential expressions.
Published: 28 January 2008
BMC Genomics 2008, 9:46 doi:10.1186/1471-2164-9-46
Received: 9 August 2007 Accepted: 28 January 2008 This article is available from: http://www.biomedcentral.com/1471-2164/9/46
© 2008 Degrelle et al; licensee BioMed Central Ltd.
This is an Open Access article distributed under the terms of the Creative Commons Attribution License (http://creativecommons.org/licenses/by/2.0), which permits unrestricted use, distribution, and reproduction in any medium, provided the original work is properly cited.
Background
Several years ago gene expression profiling has emerged as a tool of choice to study developmental kinetics [1] and is now widely used to study mammalian oocytes or embryos (mouse: [2]; bovine: [3,4], human [5], porcine [6]) including questions on cell lineage differences [7]. How-ever intermingled cells within complex tissues, biopsies, early embryos or single cells give rise to ng or pg amounts of RNA so that amplification has become a prerequisite, coupled sometimes to laser capture micro-dissection (for example [8]).
Two amplification methods have been reported in the 90ties [9,10], a linear procedure based on the use of In Vitro Transcription (IVT) and an exponential procedure based on the use of the Polymerase Chain Reaction (PCR). These exponential and linear definitions have been based on the dynamics of the corresponding enzy-matic reactions with no implicit reference to their intrinsic pitfalls. However, it has quickly become "obvious" that the linear process was a high-fidelity process which guar-anteed the conservation of the initial transcript abun-dances [11]. It thus became the tool of choice for gene profiling studies on cDNA and oligo-nucleotide arrays [12]. In the meantime, global PCR amplification proce-dures have been optimised and claimed better than IVT for array screening when starting from the sub-pg quanti-ties of RNA isolated from single cells [7,13]. As a conse-quence, numerous reports have compared the performance of PCR and IVT on decreasing amounts of starting material. Some of these extended the comparison to mRNA or total RNA as un-amplified standards although these standards appeared debatable [14]. Since their first use, both linear and exponential amplifi-cation processes became commercially available (reviewed in [14,15]) and evolved into 8 to 10 different protocols. The original IVT protocol [16] has been worked out by Baugh et al. [17] to make it more specific, by Moll et al. [18] to make it more efficient and by Schlingemann et al. [19] to adapt it to oligo-arrays composed of sense oriented oligonucleotides. Similarly, the original PCR protocol has evolved into a new amplification process known as the SMART protocol [20]. Several reports com-pared SMART amplified targets to IVT [21] and/or global PCR [22]. Improvements of the original Brady's protocol have also been worked out and compared to total RNA [7]. At last, alternatives to IVT or PCR have also been pro-posed such as a PCR step followed by an IVT step, an IVT step followed by a PCR step, the use of single-stranded cDNA instead of double-stranded cDNA (ribo-SPIA pro-tocol) or the use of subtraction prior to RNA amplification (STAR protocol). These recent procedures have also been compared to IVT or total RNA and sound promising
(reviewed in [14,15]). They fall beyond the scope of this paper.
In all these studies fidelity, reproducibility and linearity of RNA amplification has been a major concern and increas-ingly refined statistics have been used accordincreas-ingly (corre-lation, fold change, T-test, ANOVA; [23]) to identify amplification biases through deviating expression pat-terns between amplified and un-amplified material. How-ever, the possible differences between the sequences affected by PCR and IVT amplification defaults were only rarely explored. We thus aimed at studying the biases of moderate amplification protocols as well as their major characteristics, using an in-house developed protocol for the global PCR amplification [24,25] and taking into account in-house criteria linked to our biological pur-poses. We thus decided to use a small set of in vivo elon-gating embryos, recovered after uterus flushing, to screen different arrays with the same embryonic material (this study, [26,27]). Second, we chose a bovine array dedi-cated to these bovine stages rather than a larger Affymetrix array where sequences from this embryonic repertoire were not present. Third, we preferred moderate amplifica-tions to intense ones, as routinely practiced on oocytes and earlier embryonic stages, since intense amplifications cost more and have drawbacks too.
On this basis, we showed that deviating expressions affected 16% of the array after PCR or IVT amplifications, formed 2 gene subsets which did not overlap (molecular features, signal intensities, gene ID) and corresponded to housekeeping genes from physiological or cellular proc-esses. Nevertheless, differential expressions were relevant and displayed relative expression levels which were bio-logically similar, though not identical, between amplified and unamplified samples.
Results
Experimental design
Our purpose was to analyse moderate amplifications on tissues of similar but also different molecular complexities to analyse the relevance and biases in gene profiling stud-ies following RNA amplification. To this aim, we selected two protocols (IVT one round and global PCR) and five tissues: three embryonic tissues of equivalent molecular complexities as revealed by SAGE data on ovoid, tubular and filamentous stages in pig [28] and two adult tissues of different complexities (brain and ovary) as described by human SAGE and EST data [29].
To focus the design on technological variability, we reduced the biological variability as much as we could (Fig. 1). For example, the tissues (embryos, brain and ova-ries) were collected on a limited number of pregnant cows. Total RNA from brain and ovary was extracted from
different pieces of tissue and pooled thereafter to get a sin-gle RNA pool for each tissue. Similarly, RNA from individ-ual embryos was extracted and pooled per stage since biological pooling was acceptable there due to our meth-odological focus [30]. Global PCR or IVT one round was then applied to 1 μg of total RNA from each tissue. Con-comitantly, poly A+ RNA from brain and ovary was puri-fied from the corresponding pools of total RNA and used in slot-blots to assess the biological quality of the ampli-fied material. This has not been done on embryos due to a limited amount of material. We chose slot-blots instead of real-time PCR to assess the quality of the amplified material since a validation of a global PCR by a PCR did not seem reasonable to us due to similar enzymatic draw-backs.
Amplified material from each tissue (brain, ovary, ovoid embryos, tubular embryos and filamentous embryos) was indirectly labelled using "random" hexamers. As advised [31] replicates were emphasized and deliberately focused on technical points. Three or two independent targets for each tissue and each protocol (target replicates) were thus generated and hybridised to 4 replicates of the same array (array replicates), so that 48 measurements per probe were generated for somatic (3 targets × 2 tissues × 2 proto-cols × 4 arrays) and embryonic samples (2 targets × 3 tis-sues × 2 protocols × 4 arrays). To find out gene expression
differences between protocols or embryonic stages, appro-priate statistical analyses have been applied on each set of data.
RNA amplifications: optimisation and quality
Since drawbacks were reported for both IVT and PCR based protocols which could originate from a too long IVT (degradation effect reported by Spiess [32]) or too many cycles of PCR (saturation effect reported by Cha or Nagy [33,34]), we first challenged our protocols on our tissues to define optimal amplification conditions. The protocols were tested using increasing in vitro transcription time or PCR cycle number, with a special look at 5 transcripts: 3 endogenous and 1 exogenous transcripts in brain and ovary, 1 endogenous transcript in developing embryos. Transcripts encoding EF1α, L23a and Cytochrome oxidase III were selected as somatic controls because of a differen-tial expression between brain and ovary, an easy detection on slot blots with poly A+ RNA and a different length: 1.7, 0.9 and 0.7 kb, respectively (preliminary data, not shown). As a result, an in vitro transcription of 10 h and 2 rounds of 12 PCR cycles on 1/10 of the reverse transcrip-tion looked optimal since (i) the size of the "spiking" transcripts was conserved (ii) no shortage or degradation of the amplified material was observed and (iii) the amount of spiking transcripts had increased linearly with the time of the IVT or the number of cycles in the PCR [see Additional file 1].
Comparing the 3 amplified targets generated on the somatic tissues, it appeared that the anti-sense RNA (or aRNA) obtained after IVT corresponded to molecules of 0.1 to 4 kb with a mean size of 600 bp while the cDNA fragments generated by global PCR were reduced in size: 0.1 to 1 kb, with a mean size of 150 bp [see Additional file 2A–B]. Interestingly cDNA populations were similar for brain and ovary (panel B) whereas aRNA populations dis-played slightly different patterns (panel A). However, the 3 aRNA targets generated from brain or ovary were similar [see Additional file 2C]. These results underlined a good reproducibility in the production of target replicates, a slightly different distribution of RNA species between tis-sues with IVT and a more homogeneous pattern between tissues with PCR.
To further assess the quality of the amplified material gen-erated on each tissue by IVT or PCR, we took advantage of the endogenous and exogenous transcripts which were used to calibrate the protocols and studied their expres-sion in amplified versus un-amplified material (somatic samples: Fig. 2A, embryonic samples, Fig. 2B). The L23a mRNA, slightly more expressed in ovary than in brain according to poly A+ RNA, kept the same profile after amplification (IVT or PCR). Conversely, the stronger expression of EF1α in the ovary was either increased (IVT)
Experimental design Figure 1
Experimental design. Description of the technical steps
involved in the experiments designed to analyse the rele-vance and biases occurring in our gene profiling studies fol-lowing moderate RNA amplification: IVT one round or global PCR (details on the protocol in the Methods). In this design technical replicates included both target replicates (inde-pendently amplified targets) and array replicates (identical copies of the array).
RNA Isolation
polyA+ 1µg total RNA
Slot blots (Fig. 2A) PCR Amplification Linear Amplification
cDNA Synthesis cDNA Synthesis
T7 In Vitro Transcription
(1 round)
PCR 1
(1/10 RT)
500ng 500ng
Random Radioactive Labelling
Hybridization on 4 array replicates PCR 2
(1/4 PCR1)
or attenuated (PCR) whereas the stronger expression in brain of the Cytochrome Oxidase III mRNA was weak-ened after IVT and abolished after PCR. Interestingly enough the exogenous mRNA, which was equally added in the RNA from brain and ovary (see Methods), appeared more expressed in the ovary after IVT but not after PCR. Using the Interferon-tau transcript as endogenous control for bovine developing embryos (Fig. 2B) we showed that the amount of this sequence increased from the ovoid to the filamentous stage after amplification (IVT or PCR) as it does in vivo (reviewed in [35]). On this very small set of transcripts it was obvious that under and over representa-tions occurred during amplification, but to which extent and with which impact on gene expression differences? Global features of somatic and embryonic hybridisations As previously advised by N'Guyen [36], we first deter-mined the amount of labelled target to be used for each hybridisation so that no additional signal appeared but the intensity of the positive signals increased when the amount of target did (50, 125, 250 and 500 ng for aRNA or cDNA labelled targets; data not shown). On this basis, 125 ng of each target has been hybridised to each array with no particular focus on the relative amplification rates and the subsequent equivalence between these targets.
Considering the somatic hybridisations, PCR amplified targets gave a double amount of valid signals as compared to IVT amplified ones (Fig. 3A), when valid meant observed on 2 thirds of the arrays. In this case, common signals represented 90% of the IVT signals but only 45% of the PCR ones. This however was not true when valid meant detected on all the arrays with intensities 2 times over the background. Indeed, such a stringent calculation gave similar numbers of signals with IVT or PCR amplifi-cations: 112 versus 96 with brain and 167 versus 146 with ovary, respectively. Conversely, embryonic targets (Fig. 3B) displayed similar numbers of signals at each stage but 2 to 3 times more signals than somatic ones, as expected from an array enriched in embryonic probes. Moreover, common signals between embryonic targets represented 70 to 80% of the signals generated by IVT and PCR ampli-fications.
When analysed per protocol, the technical replicates (tar-get replicates: 3 for the somatic tissues; 2 for the embry-onic stages; array replicates: 4 per target) proved to be nicely correlated as evidenced by the corresponding scat-ter plots (Fig. 4A–B). Briefly, the coefficients of correlation were between 0.85–0.97 for the hybridisations after PCR or IVT amplification: 0.85 to 0.96 for the somatic signals and 0.95 to 0.97 for the embryonic ones (Fig. 4D). How-ever, the correlation between PCR and IVT amplified products was much lower (0.39 to 0.67 for somatic hybridisations; 0.58 to 0.67 for embryonic ones; Fig. 4C– D). The scatter plots revealed additionally a large number of signals with a very low coefficient of correlation which corresponded to signals of high intensity with PCR ampli-fications but low intensity with IVT and vice versa (Fig. 4C). These signals generated a crab-like figure of high interest with respect to amplification distortions.
We thus confirmed a high correlation within methods, an intermediate correlation between methods and evidenced a divergence between methods for at least a subset of the array. We thus aimed at its characterisation.
Amplification distortions in somatic and embryonic hybridisations
Gene expression differences between amplification meth-ods (global PCR and IVT one round) were identified with the TMEV 3.0 software. Analysing the whole array (1920 EST), 341 gene expression differences were identified whatever the tissues. Interestingly most of them were localised into the "crab claws" previously identified in the scatter plots between PCR and IVT amplified samples (Fig. 5A). Before any other analysis this result suggested that these differences were amplification discrepancies. Repeating the analysis on the core array (987 EST, see Methods), 154 gene expression differences appeared sig-nificant between PCR and IVT amplified samples. These
Quality of the somatic and embryonic amplified products Figure 2
Quality of the somatic and embryonic amplified products. 125 ng of each amplified material (aRNA or
cDNA) has been spotted onto a membrane and hybridised with DNA probes encoding exogenous (CG03) or endog-enous controls (somatic: EF1α, L23a, cytochrome oxidase III; embryonic: IFN-tau). Each replicate (1 to 3) has been gener-ated independently with each protocol (IVT or PCR) on each tissue (A: brain, ovary; B: ovoid, tubular and filamentous bovine embryos). PolyA+ RNA was used as standard for somatic tissues only (A).
0 100000 200000 300000 400000 500000 600000 700000 800000 900000 1000000 ovo id_1 ovo id_2 tubul ar_1 tubu lar_ 2 fila mentou s_1 fila ment ous_2 aRNA c DNA cDNA aRNA 1 2 1 2 1 2 ov oid tu bu lar fila me nto us A B A
ones localised differently (Fig. 5B), showing that the crab claws were mostly due to the mitochondrial sequences (among which 12SrRNA) which were largely redundant (33%) within the whole array. Though biologically not challenging, this drawback (due to the fact that the embry-onic library was neither normalised nor sequenced when arrayed) highlighted a specific PCR bias towards 12SrRNA sequences which could not be visualised on arrays con-taining highly selected cDNAs. Reverse transcription being mostly achieved on total RNA, this however was of
methodological interest since those sequences incorpo-rate a part of the isotope during the labelling.
Applying a clustering analysis to the relevant differences identified between amplified samples from embryonic and somatic tissues (n = 154), 109 appeared at first glance attributable to IVT and 45 to PCR (Fig. 6A). However, in the absence of unamplified standards such as mRNA tar-gets or total RNA tartar-gets, one cannot distinguish higher IVT expressions due to IVT induced over-expressions or
Venn diagrams on somatic (A) and embryonic (B) hybridisations Figure 3
Venn diagrams on somatic (A) and embryonic (B) hybridisations. Only valid signals were displayed here after
hybrid-isation on the array. A signal was considered "valid" when the Imagene software did not flag it (flag = 0) and when the same sig-nal was observed on 2 thirds of the arrays, namely: 8 out of 12 for the somatic ones and 5 out of 8 for the embryonic ones.
PCR induced under-expressions, and vice versa. We thus named these groups of genes Panel 1 and Panel 2 instead of IVT and PCR. Most of these deviating expressions cor-responded to genes involved in similar processes: 75% and 71% in physiological and cellular processes, respec-tively (Fig. 6B). As expected from the clustering results, the deviating gene differences from Panel 1 fell into the high-est intensities of the IVT data and lowhigh-est intensities of the PCR data whereas those from Panel 2 showed the oppo-site distribution (Fig. 6C). Obviously, the density of these deviating genes over unamplified data would have been of high interest to sort out the part of IVT and/or PCR defaults in these deviating expression differences. 64 and 32 genes referenced in the Unigene Bos taurus index were respectively identified within Panel 1 and Panel 2 [see Additional files 3 and 4]. In Panel 1, the endogenous con-trols encoding RPL23a and EF1α were recognised thus confirming that some of the deviating expressions we observed on Fig. 6 were due to IVT induced over-expres-sions (see Fig. 2). To further know whether molecular
fea-tures such as transcript size, GC content or presence of hairpins could partly explain such deviations, we explored these features on the amplification affected sequences from both Panels.
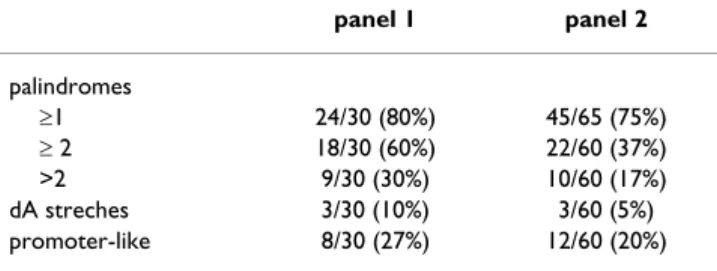
We first found (Fig. 7A–E) that the sequences from Panel 2 (i) displayed a reduced size as compared to those from Panel 1: 200 pb against 350 pb (ii) corresponded to sig-nificantly smaller sized cDNAs: 850–950 pb against 900– 1800 pb (iii) were more frequently located in the 3' end of the cDNAs: 25 to 50% of the Bt. length and (iv) dis-played a lower GC content. Nevertheless, this last differ-ence stopped being significant when the full length cDNAs were compared (Fig. 7D–E) likely due to a "buff-ering" effect of the coding regions where the GC contents are often closer to 45%. Considering hairpins as potential pausing sites, dA stretches as internal oligo-dT priming sites and promoter-like sequences as alternative RNA polymerase initiating sites, we then observed that sequences from Panel 2 contained also more hairpins
Scatter plots between hybridisations with bovine adult brain (A-C) and correlations within the whole design (D) Figure 4
Scatter plots between hybridisations with bovine adult brain (A-C) and correlations within the whole design (D). Signal mean intensities were calculated for each amplified target on 4 arrays and plotted pair-wise per replicate. For
exam-ple, PCR-amplified: replicate 1 versus replicate 2 (A) and IVT-amplified: replicate 1 versus replicate 2 (B). Similar results were obtained for the 4 other pairs (1 versus 3 and 2 versus 3). Signal mean intensities per protocol were calculated on 12 arrays (4 arrays per replicate × 3 replicates) and plotted pair-wise per protocol (C): PCR-amplified versus IVT-amplified. Similar results were obtained for the ovary and the embryos (ovoid, tubular and filamentous stages). Correlation factors between hybridisa-tion profiles (D).
A
B
C
D
PCR amplified PC R am plified IV T am plified PC R am plified(60% versus 37%) and A stretches (10% versus 5%) than those from Panel 1. They displayed however similar con-tents of promoter-like sequences (Table 1).
Conclusively, it appeared that systematic biases arose dur-ing both amplification procedures independently of (i) the sample used: brain, ovary or embryos, (ii) the enzy-matic properties initially inferred (exponential or linear) and (iii) the preliminary optimisation of the protocols. These distortions affected 16% of the core array (154/ 987) and involved different subsets of genes (Panels 1 and 2) which harboured different molecular properties.
Gene expression differences between embryonic stages Knowing from above that systematic biases arose during amplification (global PCR and IVT one round) and affected 16% of the core array (987 EST), we wondered whether gene expression differences identified between embryonic stages with amplified samples could be both reliable and relevant.
49 gene expression differences were identified between stages (ovoid, tubular and filamentous) with PCR ampli-fied samples and 28 with IVT ampliampli-fied ones. Among these, 14 were IVT specific, 35 PCR specific and 14 were
Evidence for gene expression differences between PCR and IVT amplified samples Figure 5
Evidence for gene expression differences between PCR and IVT amplified samples. Signal mean intensities per
pro-tocol were calculated on 24 arrays (4 arrays per target × 3 targets × 1 tissue = brain) and plotted pair-wise per propro-tocol: PCR-amplified versus IVT-PCR-amplified using either the whole set of data (A) or its biological core (B). Coloured, the signals identified as significant gene expression differences between protocols whatever the tissues (n = 154; red: global PCR; blue: IVT one round).
IVT amplified IVT amplified
IVT amplified IVT amplified PC R am plified PC R am plified PC R am plified PC R am plified
commonly identified (Fig. 8A). The common ones (n = 14 EST) encoded 4 genes referenced in the Unigene Bos tau-rus index and corresponded to transcripts identified in another study using IVT amplified samples only [26]. We showed therein that c12, c93, c88 and TKDP1 transcripts
were differentially expressed among these stages (c12, c93: Northern blots; TKDP1 [37]). The IVT specific differ-ences (n = 14) encoded 8 genes referenced in the Bos tau-rus index, 4 of which were known as reliable differential expressions: IFN-tau (our endogenous control for
Characterisation of PCR and IVT amplification biases Figure 6
Characterisation of PCR and IVT amplification biases. Unsupervised hierarchical clustering of the significant gene
expression differences (n = 154) identified between PCR and IVT amplified samples whatever the tissues (A). Biological proc-esses concerned by these gene expression distortions as defined by a search through Gene Ontologies (B). Representations of the deviating gene expressions on the core array: n = 987 EST as compared to the whole IVT and PCR datasets (C): the black lines correspond to the distribution of the intensities in each dataset; the red lines and the blue lines correspond respectively to densities of the deviating expressions from Panel 1 and 2.
A
B
%biological_process unknown 3% %behavior 4% %physiological process 46% %development 16% %cellular process 29% %regulation of biological process 2% %development 14% %cellular process 33% %biological_process unknown 10% %behavior 5% %physiological process 38% Panel 1 Panel 2C
Panel 1 Panel 2embryos, Fig. 2B), Cox2 [38], c12 and PAG11 [26]. Simi-larly, the PCR specific differences (n = 35) encoded 15 genes referenced in the Bos taurus index, 5 of which were also known as reliable differences: c12, c93, TKDP1, PAG11 and IFN-tau. Surprisingly, they were not identified as common differences between PCR and IVT amplified samples. Looking in more details at the corresponding EST it appeared clearly that, although located in the same Bt., they did not overlap. Extending this analysis to the list of specific differences (n = 49; 35 +14) we found that the EST from the PCR group were frequently located at the 3'end of the referenced cDNAs (or Bt.), as compared to those from the IVT group (Fig. 8B), and displayed reduced sizes (Fig. 8C). Last but not least, a few differences
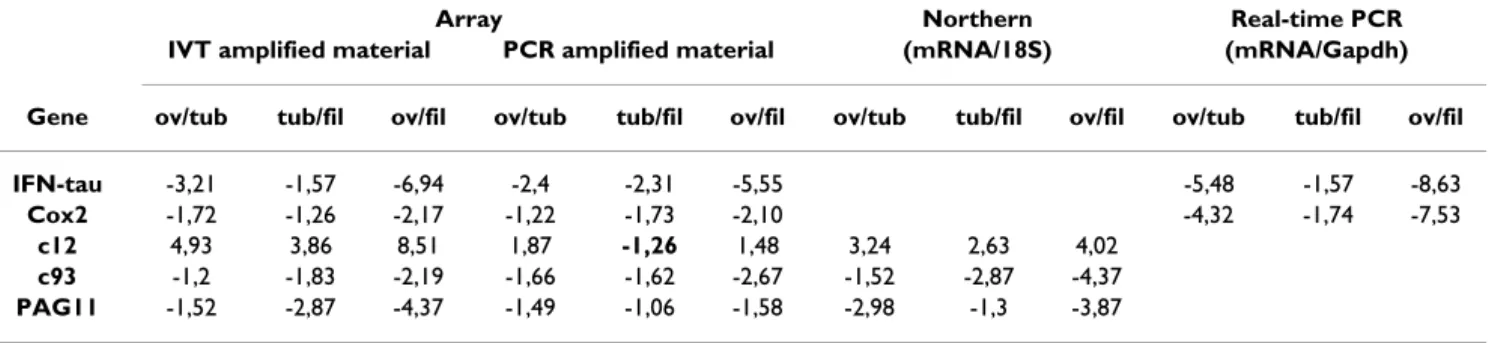
identi-fied between embryonic stages with PCR ampliidenti-fied sam-ples (2 Bt./15) matched with those identified in Panel 2 (2 Bt./32) whereas no intercept was detected with Panel 1. Since these differential patterns were detected with ampli-fied embryonic targets, we compared their relative expres-sion ratios between amplified and unamplified RNA (Table 2). We thus quantified c12, c93 and PAG11 expres-sion levels between stages as revealed by former Northern blots [26] and performed Real-Time PCR on 2 new tran-scripts: Cox2 (identified only by IVT targets) and IFN-tau (identified by IVT and PCR targets through non overlap-ping EST). From these results, one clearly sees that the dif-ferential ratios between stages were biologically similar,
Molecular features of the gene subsets affected by amplification defaults Figure 7
Molecular features of the gene subsets affected by amplification defaults. The EST from Pane1 1 (n = 109) and Panel
2 (n = 45) were compared to the EST of the core array (or 1 K array; n = 987) whenever interesting. The distributions of EST size, Bt. size and EST positions within the referenced transcripts from the Bos taurus Unigene index (or Bt.) were represented by box plots (A-C). Sizes were expressed in base pairs. Positions within the Bt. were expressed as % of the whole Bt. size, starting from the 5' end which is defined here as 0. The GC content in these subsets and in the corresponding Bt. was also rep-resented by box plots (D-E). Boxes from the box-plots extended from the 25th percentile to the 75th percentile with a
horizon-tal bar representing the median. Statistical significance between median EST size, Bt. size, EST positions and GC contents has been estimated with T tests (null hypothesis: no differences). (*) means significant (P < 0.05) and (***) highly significant (P < 0.01).
EST size Bt size EST position within Bt
EST GC content Bt GC content
* ***
***
***
1K array Panel 2 Panel 1 Panel 2 Panel 1 Panel 2 Panel 1
Panel 2 Panel 1 1K array Panel 2 Panel 1
A
D
Ba se par is Ba se par is Po urcent age 5’ positi on 3’ Po urcent ageB
C
E
though not identical. Indeed, the differential ratios for Cox2 looked smaller at some stages with IVT targets whereas the differential ratios of IFN-tau, c12 and PAG11 appeared smaller with PCR targets. Nevertheless, only one inverted ratio appeared between IVT and PCR: the c12 ratio between tubular and filamentous stages.
As a final view, gene expression differences identified between embryonic stages with amplified samples were both reliable (tiny intersect with deviating expressions) and relevant (biologically valid). In addition, the molecu-lar features observed on the differential EST identified by IVT or PCR amplifications suggest that global PCR favoured the representation of short cDNA harbouring rather low GC contents.
Discussion
This work illustrated the questions frequently asked since 2002 about RNA amplification and showed that even with optimised and reproducible protocols deviating gene expressions affected 16% of our array and appeared what-ever the tissue. These biases, linked to the abundance or the molecular features of the sequences affected by ampli-fication defaults, corresponded mainly to housekeeping genes from physiological and cellular processes. Differen-tial expressions, however, were found reliable and rele-vant with biologically similar expression ratios between amplified and unamplified material.
Similar biases were reported in previous studies using also moderate IVT and PCR amplifications. They evidenced either contradictory expression ratios or missing spots [39,40] but also a vast majority of expression patterns which differed only in the magnitude of the differential expression [41]. In our study, only one gene out of the five tested showed an inversed ratio at one stage after PCR
amplification, whereas most of them showed ratios which differed only in their magnitudes. All of them however were relevant as confirmed by Northern blots or Real-Time PCR. Interestingly, the deviating genes from our study corresponded mainly to housekeeping genes whereas those identified by van Haaften (genes lost dur-ing IVT amplification) rather included transcription fac-tors. As an alternative to minimise distortions, Real-Time detection of amplified products has been proposed to pre-vent over-amplification in PCR-based protocols [34] and a similar approach has been used before and after IVT amplifications to discriminate between well and badly amplified samples [40]. This has also been used to follow IVT amplifications on bovine oocytes and early embryos (Robert & Sirard, personal communication).
The possible differences between the sequences affected by amplification defaults were however rarely explored. Van Haaften observed that the reporters that disappeared after IVT amplification (20% of them) had a GC content
Differential expressions between embryonic stages Figure 8
Differential expressions between embryonic stages.
Venn diagrams on gene expression differences identified between embryonic stages with PCR and IVT amplified sam-ples (A). The distribution of the EST positions within the ref-erenced transcripts from the Unigene Bos taurus index (or Bt.) and the distribution of the EST size were represented by box plots (B, C). Positions within the Bt. were expressed as % of the whole Bt. size, starting from the 5' end which is defined here as 0 (B). Sizes were expressed in base pairs (C). Boxes from the box-plots extended from the 25th percentile
to the 75th percentile with a horizontal bar representing the
median. Statistical significance between median EST size or EST positions has not been evaluated.
14 14 35 n=49 EST n=19 Bt n=28 EST n=12 Bt
A
B
200 40 0 6 00 800 IVT intersect PCR EST size 0 2 04 06 08 0 IVT intersect PCREST position within Bt
4 8 15 5’ positi on 3’ Ba se par is
C
GLOBAL PCR IVT ONE ROUND Table 1: Additional features on the gene subsets affected by
amplification defaults. Hairpins, A stretches and promoter like sequences have been investigated. The parameters were the following: hairpins (minimal length: 10 nucleotides, maximal length: 100, maximal gap: 50), A stretches (size: 18A, maximal gap: 3), promoter of the T7 RNA polymerase (forward sequence: CCCTATAGTGAGTCGTATTA and reverse sequence, maximal gap: 6). Results on Panel 1 and 2 are summarised here. Statistical significance between subsets or features has not been evaluated. panel 1 panel 2 palindromes ≥1 24/30 (80%) 45/65 (75%) ≥ 2 18/30 (60%) 22/60 (37%) >2 9/30 (30%) 10/60 (17%) dA streches 3/30 (10%) 3/60 (5%) promoter-like 8/30 (27%) 12/60 (20%)
of about 54% and displayed more hairpins of longer sizes than the other reporters (80%). A higher GC content has also been observed in deviating genes after PCR amplifica-tion with the SMART protocol [21]. The authors correlated this feature to the temperature of the enzymatic reaction (68 to 72°C for the Taq Polymerase) and to the GC con-tent of their plant genome. This was surprising to us since GC rich fragments are often difficult PCR templates, requiring sometimes DMSO or betaine addition. In our study, we could not assign the distortions from Panel 1 and Panel 2 to IVT or PCR defaults since, without a stand-ard, it was impossible to distinguish IVT over-expression from PCR under-expression and vice versa. It was clear however that these 2 gene subsets did not overlap: differ-ent molecular features, differdiffer-ent signal intensities and dif-ferent gene ID. EST from Panel 2 displayed reduced sizes, were more frequently located in the 3'end of the cDNAs and displayed a lower GC content than those from Panel 1. They also contained more hairpins (60% versus 37%) and A stretches (10% versus 5%) than those from Panel 1 but displayed similar contents of promoter-like sequences. Since EST corresponding to true differential expressions identified by PCR targets were frequently located at the 3'end of the referenced cDNAs and dis-played reduced sizes (as compared to IVT specific ones), one would suggest that deviating genes from Panel 2 could display a PCR signature.
Conclusion
From this work, it was not really possible to favour PCR over IVT amplification or vice versa. Both generated distor-tions and revealed true differential expressions between embryonic stages (minor intersect between differential patterns and biases), so that one would rather advise (i) using only one protocol to keep amplification factors and biases equal (ii) monitoring the amplification process as offered now through Real-Time PCR and (iii) searching for protocol specific expression differences or gene-proto-col interactions before any differential analysis on a new
dataset or a new array. Obviously, the choice between those protocols is also a question of total RNA input, time, cost and available arrays since amplified targets enriched in 3'end fragments will not hybridise to SSH fragments or 5'positioned oligos. Last but not least, know-ing that Taq Polymerases make more mistakes than RNA polymerases do, IVT may be favoured over PCR to hybrid-ise highly discriminating oligo-arrays or arrays from other species.
Methods
Bovine tissuesEstrus synchronized heifers of the Charolais breed were inseminated (day 0) and day 12 to day 17 blastocysts were collected by non surgical flushing in warm PBS. Ovoid blastocysts (1–12 mm) came from collects at 12 dpi (day post insemination) whereas tubular and early filamen-tous stages (50–60 mm and 140–160 mm) were obtained at 14 to 15 and 16 to 17 dpi, respectively. Brain and ova-ries were collected on Day-50 pregnant cows. To take adult somatic tissues, animals were humanly put down in the accredited experimental slaughterhouse of INRA under the supervision of veterinary services.
RNA extraction
Total RNA from ovoid (n = 4), tubular (n = 4) and fila-mentous (n = 4) embryos was extracted with RNA-Plus™ (QBioGene). RNA quality was first verified by intact ribos-omal bands on a 1% agarose gel (28S and 18S) and A260/ 280 absorbance ratios. Total RNA from brain and ovary was isolated in the same way. RNA quality was also veri-fied by intact ribosomal bands on a 1% agarose gel (28S and 18S) and A260/280 absorbance ratios. A spiking mRNA was then added to brain and ovary as 1% of the estimated polyA+ amount to test whether highly expressed genes can be biased through amplification. This CG03 mRNA from A. thaliana was in vitro synthesized (with a T7 Megascript kit, Ambion) from the c554 con-taining plasmid, given to us by H. Hofte (LBC, INRA
Ver-Table 2: Comparison of the differential expression ratios observed between embryonic stages using amplified and unamplified material. The expression ratios observed with amplified targets (IVT and PCR) come from the array datasets presented in this study. Those originating from Real-Time PCR come from the gene specific validations (IFN-tau, Cox2) we performed on unamplified RNA from each stage. Those originating from Northern blots (c12, c93, PAG11) come from previous results on unamplified RNA from each stage [26].
Array Northern Real-time PCR IVT amplified material PCR amplified material (mRNA/18S) (mRNA/Gapdh)
Gene ov/tub tub/fil ov/fil ov/tub tub/fil ov/fil ov/tub tub/fil ov/fil ov/tub tub/fil ov/fil
IFN-tau -3,21 -1,57 -6,94 -2,4 -2,31 -5,55 -5,48 -1,57 -8,63
Cox2 -1,72 -1,26 -2,17 -1,22 -1,73 -2,10 -4,32 -1,74 -7,53
c12 4,93 3,86 8,51 1,87 -1,26 1,48 3,24 2,63 4,02
c93 -1,2 -1,83 -2,19 -1,66 -1,62 -2,67 -1,52 -2,87 -4,37
sailles, France). Brain and ovary polyA+ RNA were further extracted using a Dynabeads mRNA purification kit (Dynal).
RNA amplification
Amplified RNA from each sample was synthesized with the MessageAmp™ aRNA Kit (Ambion) according to the manufacturer instructions. Briefly, 1 μg of total RNA was incubated with 500 ng of an anchored T7-(dT) primer in 12 μl (water) at 70°C for 10 min. The 1rst cDNA strand was synthesized by the addition of 2 μl first-strand buffer, 1 μl RNAse inhibitor, 4 μl dNTP mix and 1 μl reverse tran-scriptase mix and incubation at 42°C for 2 h. Second-strand synthesis was performed by the addition of 63 μl DEPC-treated water, 10 μl second-strand buffer, 4 μl dNTP mix, 2 μl DNA polymerase, 1 μl RNAse H- and incu-bation at 16°C for 2 h. DNA was extracted with phe-nol:chloroform:isoamyl alcohol and precipitated in ethanol with 20 μg glycogen (Ambion). In vitro transcrip-tion was carried out at 37°C for 10 h in a 20 μl reaction volume. 1 μl DNAse was added and incubated at 37°C for 30 min. RNA was purified on Mini Quick Spin RNA col-umns (Roche Diagnostic) and its quality verified on RNA 6000 lab-chips (BioAnalyser 2100; Agilent Technologies). RNA target labelling
aRNA was retro-transcribed and directly labelled with [
α-33P]dATP as described for polyA+RNA [42]. 500 ng of
aRNA was mixed with 500 ng of random hexamers in a volume of 25 μl. The mixture was incubated at 70°C for 10 min and chilled on ice. cDNA was synthesised by the addition of 5 μl 10× PCR buffer, 5 μl 25 mM MgCl2, 5 μl
0,1 mM DTT, 2,5 μl 10 mM mix dGTP, dCTP and dTTP,
2,5 μl water, 50 μCi [α-33P]dATP and 200 U Superscript II
(Invitrogen) at 42°C for 50 min. The RNA template was removed by the addition of 1 μl RNAse H- and incubation at 37°C for 20 min.
Global RT-PCR amplification
Amplified cDNA was prepared as described [24] with few modifications. Briefly, 1 μg total RNA was incubated with 1 μl 10 μM oligo(dT), 1 μl 10 mM dNTPs, 1 μl 10% NP40, 1 μl 20 mM DTT, 2 μl first-strand buffer 5×, 1 μl RNAse inhibitor (Ambion) at 65°C for 2 min, at room tempera-ture for 3 min and cooled on ice. cDNA was synthesised by the addition of 200 U Superscript II (Invitrogen) and 2 U AMV (Gibco BRL) and incubation at 42°C for 30 min. First-strand cDNA were poly(dG)-tailed by incubation with 1 μl 20 mM dGTP, 4 μl TdT buffer 5×, 2,5 μl water, 2,5 μl TdT enzyme (Promega) at 37°C for 1 h. The first PCR was performed in a volume of 50 μl using 1/10 of the RT and the second PCR was performed on 1/4 of the first PCR. Samples were incubated at 94°C for 10 min before the two rounds of PCR cycles (12 cycles each; 94°C for 2 min, 63°C for 50 sec and 72°C for 6 min). PCR products
were then purified using Qiaquick PCR purification (Qia-gen) and their quality verified on DNA 7500 lab-chips (BioAnalyser 2100; Agilent Technologies).
cDNA target labelling
PCR-amplified cDNA was labelled with [α-33P]dATP
using random hexamers and Klenow included in Atlas SMART Probe Amplification kit (Clontech). 500 ng of amplified cDNA was mixed with 500 ng random hexam-ers in a volume of 34 μl. The mixture was incubated at 98°C for 8 min and at 50°C for 3 min. After addition of 5 μl 10× buffer, 5 μl dNTPs for ATP label, 5 μl [α-33P]dATP
and 1 μl Klenow, the reaction mixture was incubated at
50°C for 30 min and stopped with 2 μl 0,5 M EDTA.
Labelled targets were then purified on Sephadex columns (G-50).
Quantitative Real time PCR
Real-time PCR was carried out in a final volume of 30 μl with 1 μl of diluted reverse transcriptions (1/100; 1/1000) in a 1× SYBR green Master Mix (Applied Biosystems) with 0.3 μM of gene-specific primers. Reactions were run on ABI Prism 7000 HT (Applied Biosystems). The presence of a specific and unique PCR product was checked by ABI Prism melting curves. The relative quantification of the initial amount of target was extrapolated from the appro-priate standard curve, which was generated simultane-ously while using serial dilutions of the corresponding PCR product. IFN-tau and Gapdh primers were as pub-lished [43,44] but Cox2 primers were a kind gift from G. Charpigny. Their sequences (unpublished so far) will be available upon request [email protected]. Slot-Blot
125 ng of polyA+RNA, aRNA or cDNA were spotted and cross-linked to HybondN+ membranes (Amersham) at 80°C for 2 h. DNA probes encoding IFN-tau, CG03, EF1α, RPL23a or Cytochrome oxidase III were [α-32
P]dCTP-labelled using the Ready-Prime kit (Amersham). Apart from CG03, those DNA probes originate from the array. Hybridisations were conducted at 65°C for 16 h and washes performed once in 2 × SSC, 0,1% SDS at 65°C for 30 min and twice in 0,1 × SSC, 0,1% SDS at 65°C for 10 min. Slot blots were then exposed to phosphor-imaging for 24 hours and signal intensities quantified with the ImageQuant 3.3 software (Molecular Dynamics).
Array description
The bovine embryonic array used here originates from a bovine cDNA library established at the ovoid stage, start-ing from 1.6 μg of RNA and using the Cap Finder cDNA kit from Clontech as described in Degrelle et al. [26]. Briefly, cDNA inserts from the arrayed library were ampli-fied by PCR using the flanking primers from the Cap Finder kit and selected for spotting after a short run on a
2.5% agarose gel. 1855 probes were then spotted and fixed (UV light, 1 min, 1200 J, twice) onto nylon N+ membranes (8 cm × 12 cm, Amersham Biosciences) with a 5 × 5 pattern (BioRobotics). This was achieved with the kind help of C. Matingou and G. Piétu at the Genexpress Laboratory headed by C. Auffray (CNRS FRE 2571, Ville-juif, France). The library has been called "bcai" and indexed in TGI and NCBI database as "#FJB" and "15979", respectively [45,46] and the array published as "INRA-BDR Bovine D14 Embryo 1K" (GPL6284) in NCBI Gene Expression Omnibus database [47]. Bacterial clones are available upon request at the CRB GADIE (INRA Jouy en Josas, France [48])
Array hybridization, image acquisition and quantification Each target was hybridized to 4 array replicates using ExpressHyb™ Hybridization Solution (Clontech) at 68°C overnight. Arrays were washed four times in 2 × SSC, 1% SDS and once in 0.1 × SSC, 0.5% SDS at 68°C for 30 min each. They were then exposed to phosphor-screens for 7 days. The hybridization signals were quantified with the Imagene 3.1 software from BioDiscovery (Proteigene) on the PICT plateform (INRA Jouy en Josas, France). These raw datasets are accessible in NCBI Gene Expression Omnibus database (experimental series "GSE9929" [47]). Internal controls within the array corresponded to 65 probes and either positive or negative controls were as expected in all the hybridizations. A signal was considered "valid" when the Imagene software did not flag it (flag = 0) and when the same signal was observed on 2 thirds of the arrays, namely: 8 out of 12 for the somatic targets and 5 out of 8 for the embryonic ones.
Gene expression analyses
All the plots (scatter plots, histograms) were performed on R environment [49].
Gene expression differences between protocols
These analyses were performed either on the whole array (1855 inserts plus 65 controls = 1920 probes) or on the biological core of the array also called 1 K array (1097 informative sequences submitted to the EBI – 110 mito-chondrial sequences = 987 probes). With 2 protocols, 5 tissues, 2 to 3 target replicates per protocol and 4 array replicates per target (as indicated in the experimental design, Fig. 1), these analyses involved 184 320 (1920*2*2*3*4+1920*2*3*2*4) and 94 752 (987*2*2*3*4+987*2*3*2*4) pieces of data, respec-tively. Statistical and clustering analyses were performed using TIGR MeV 3.0 (MultiExperiment Viewer software [50]). Before calculations, the data were log2 transformed and standardised within each protocol. Differences between PCR and IVT methods were assessed by a Stu-dent's t-test assuming an unequal variance (Welch approximation). The adjusted Bonferroni correction was
considered at P < 0.05. An unsupervised hierarchical clus-tering, based on Euclidean distance and complete linkage, was performed on the significant gene expression differ-ences between the 2 methods.
Gene expression differences between embryonic stages
These analyses were performed on the biological core of the array (987 probes). With 2 protocols, 3 embryonic stages, 2 target replicates per protocol and 4 array repli-cates per target (as indicated in the design), these analyses involved 47 376 (987*3*2*2*4) pieces of data. To iden-tify gene expression differences between stages, we used a set of SAS macros called AnovArray and performed an analysis of variance considering a homogeneous variance for all the genes (HOM option) and a multiple testing (False Discovery Rate) at the threshold 5% (details in [26,51]). AnovArray has been originally conceived to ana-lyse these datasets.
Bioinformatics
Biological processes were analysed through Gene Ontol-ogy annotations [52] considering the Indentation 1. EST size, GC content, EST position according to the referenced mRNA of the Bos taurus gene index [45] were performed using Perl scripts and box plot function from the R envi-ronment [49]. Presence of hairpins, dA stretches and sequences similar to RNA polymerase promoters was eval-uated using the palindrome and fuzznuc programs of the Emboss package [53].
Authors' contributions
SAD provided and analyzed the data. CHA, KPK, SR devel-oped AnovArray. HC contributed to bioinformatic analy-ses. FP took part to the 1 K array construction. JPR helped conceiving the study. IH, SAD designed the study and wrote the manuscript. All authors read and approved the final manuscript.
Additional material
Additional file 1
Optimisation of each amplification procedure. Southern (A) and
Northern (B) blots performed on cDNA (A) and aRNA (B) after increas-ing PCR cycle numbers or increasincreas-ing in vitro transcription times were hybridised with a 32 P-labelled DNA probe encoding the exogenous CG03
transcript. A band of the expected size (1 kb) was observed on southern blots after 9, 12 and 15 cycles for the 1rst and 2nd rounds of PCR
amplifi-cations (A). The negative controls including RT- and mock did not give any signal. A band of the expected size was also observed on Northern blots after 8, 10 or 12 h of in vitro transcription (B). Its intensity increased with the increasing transcription time. Only brain data are illustrated here, but similar results were obtained with ovary and embryos.
Click here for file
[http://www.biomedcentral.com/content/supplementary/1471-2164-9-46-S1.PDF]
Acknowledgements
The authors wish to thank Véronique Duranthon for introducing us to her protocol of global PCR amplification, Olivier Dubois for his precious help in Real-Time PCR experiments and Philippe Bardou from SIGENAE team for the submission of the "INRA-BDR Bovine D14 Embryo 1K" to the GEO database. This work was supported by the EEC (contract BOI4-CT95-0190) and INRA (AIP P00183). Degrelle S. A. was a MNERT fellow.
References
1. Ko MS, Kitchen JR, Wang X, Threat TA, Wang X, Hasegawa A, Sun T, Grahovac MJ, Kargul GJ, Lim MK, et al.: Large-scale cDNA anal-ysis reveals phased gene expression patterns during preim-plantation mouse development. Development 2000,
127(8):1737-1749.
2. Zeng F, Baldwin DA, Schultz RM: Transcript profiling during pre-implantation mouse development. Dev Biol 2004, 272(2):483-496.
3. Misirlioglu M, Page GP, Sagirkaya H, Kaya A, Parrish JJ, First NL, Memili E: Dynamics of global transcriptome in bovine matured oocytes and preimplantation embryos. Proc Natl
Acad Sci USA 2006, 103(50):18905-18910.
4. Mamo S, Sargent CA, Affara NA, Tesfaye D, El-Halawany N, Wim-mers K, Gilles M, Schellander K, Ponsuksili S: Transcript profiles of some developmentally important genes detected in bovine oocytes and in vitro-produced blastocysts using RNA ampli-fication and cDNA microarrays. Reprod Domest Anim 2006, 41(6):527-534.
5. Dobson AT, Raja R, Abeyta MJ, Taylor T, Shen S, Haqq C, Pera RA: The unique transcriptome through day 3 of human preim-plantation development. Hum Mol Genet 2004,
13(14):1461-1470.
6. Whitworth KM, Agca C, Kim JG, Patel RV, Springer GK, Bivens NJ, Forrester LJ, Mathialagan N, Green JA, Prather RS: Transcriptional
profiling of pig embryogenesis by using a 15-K member uni-gene set specific for pig reproductive tissues and embryos.
Biol Reprod 2005, 72(6):1437-1451.
7. Kurimoto K, Yabuta Y, Ohinata Y, Ono Y, Uno KD, Yamada RG, Ueda HR, Saitou M: An improved single-cell cDNA amplifica-tion method for efficient high-density oligonucleotide micro-array analysis. Nucleic Acids Res 2006, 34(5):e42.
8. Luo L, Salunga RC, Guo H, Bittner A, Joy KC, Galindo JE, Xiao H, Rog-ers KE, Wan JS, Jackson MR, et al.: Gene expression profiles of laser-captured adjacent neuronal subtypes. Nat Med 1999, 5(1):117-122.
9. Van Gelder RN, von Zastrow ME, Yool A, Dement WC, Barchas JD, Eberwine JH: Amplified RNA synthesized from limited quanti-ties of heterogeneous cDNA. Proc Natl Acad Sci USA 1990, 87(5):1663-1667.
10. Brady G, Billia F, Knox J, Hoang T, Kirsch IR, Voura EB, Hawley RG, Cumming R, Buchwald M, Siminovitch K: Analysis of gene expres-sion in a complex differentiation hierarchy by global amplifi-cation of cDNA from single cells. Curr Biol 1995, 5(8):909-922. 11. Wang E, Miller LD, Ohnmacht GA, Liu ET, Marincola FM:
High-fidel-ity mRNA amplification for gene profiling. Nat Biotechnol 2000, 18(4):457-459.
12. Affymetrix [http://affymetrix.com]
13. Iscove NN, Barbara M, Gu M, Gibson M, Modi C, Winegarden N: Representation is faithfully preserved in global cDNA ampli-fied exponentially from sub-picogram quantities of mRNA.
Nat Biotechnol 2002, 20(9):940-943.
14. Nygaard V, Hovig E: Options available for profiling small sam-ples: a review of sample amplification technology when com-bined with microarray profiling. Nucleic Acids Res 2006, 34(3):996-1014.
15. Peano C, Severgnini M, Cifola I, De Bellis G, Battaglia C: Transcrip-tome amplification methods in gene expression profiling.
Expert Rev Mol Diagn 2006, 6(3):465-480.
16. Eberwine J, Yeh H, Miyashiro K, Cao Y, Nair S, Finnell R, Zettel M, Coleman P: Analysis of gene expression in single live neurons.
Proc Natl Acad Sci USA 1992, 89(7):3010-3014.
17. Baugh LR, Hill AA, Brown EL, Hunter CP: Quantitative analysis of mRNA amplification by in vitro transcription. Nucleic Acids Res 2001, 29(5):E29.
18. Moll PR, Duschl J, Richter K: Optimized RNA amplification using T7-RNA-polymerase based in vitro transcription. Anal
Biochem 2004, 334(1):164-174.
19. Schlingemann J, Thuerigen O, Ittrich C, Toedt G, Kramer H, Hahn M, Lichter P: Effective transcriptome amplification for expres-sion profiling on sense-oriented oligonucleotide microar-rays. Nucleic Acids Res 2005, 33(3):e29.
20. Clontech [http://www.clontech.com]
21. Wadenback J, Clapham DH, Craig D, Sederoff R, Peter GF, von Arnold S, Egertsdotter U: Comparison of standard exponential and linear techniques to amplify small cDNA samples for microarrays. BMC Genomics 2005, 6(1):61.
22. Subkhankulova T, Livesey FJ: Comparative evaluation of linear and exponential amplification techniques for expression pro-filing at the single-cell level. Genome Biol 2006, 7(3):R18. 23. Cui X, Churchill GA: Statistical tests for differential expression
in cDNA microarray experiments. Genome Biol 2003, 4(4):210. 24. Pacheco-Trigon S, Hennequet-Antier C, Oudin JF, Piumi F, Renard JP, Duranthon V: Molecular characterization of genomic activi-ties at the onset of zygotic transcription in mammals. Biol
Reprod 2002, 67(6):1907-1918.
25. Revel F, Renard JP, Duranthon V: PCR-generated cDNA libraries from reduced numbers of mouse oocytes. Zygote 1995, 3(3):241-250.
26. Degrelle SA, Campion E, Cabau C, Piumi F, Reinaud P, Richard C, Renard JP, Hue I: Molecular evidence for a critical period in mural trophoblast development in bovine blastocysts. Dev
Biol 2005, 288(2):448-460.
27. Hue I, Degrelle SA, Campion E, Renard JP: Gene expression in elongating and gastrulating embryos from ruminants. Soc
Reprod Fertil Suppl 2007, 64:365-377.
28. Blomberg LA, Long EL, Sonstegard TS, Van Tassell CP, Dobrinsky JR, Zuelke KA: Serial analysis of gene expression during elonga-tion of the peri-implantaelonga-tion porcine trophectoderm (con-ceptus). Physiol Genomics 2005, 20(2):188-194.
Additional file 2
Characteristics of the amplified targets from brain and ovary. aRNA
and cDNA targets were analysed on RNA 6000 lab-chips and DNA 7500 lab-chips, respectively (BioAnalyser 2100; Agilent Technologies). These populations of amplified molecules displayed slightly different profiles of size distribution depending on the protocol (A, B) or the tissue (C). Each target replicate (1 to 3) has been amplified independently from the same pool of total RNA. The molecular ladders are represented in nucleotides (nt) on the x axis.
Click here for file
[http://www.biomedcentral.com/content/supplementary/1471-2164-9-46-S2.PDF]
Additional file 3
List of the 109 EST from Panel 1. Name of the EST from the 1 K array
(or core array), GenBank accession numbers (CR), identifiers in TIGR gene index (TC) and Unigene index (Bt.) as well as short names (Gene ID) are provided here.
Click here for file
[http://www.biomedcentral.com/content/supplementary/1471-2164-9-46-S3.PDF]
Additional file 4
List of the 45 EST from Panel 2. Name of the EST from the 1 K array
(or core array), GenBank accession numbers (CR), identifiers in the TIGR gene index (TC) and the Unigene index (Bt.) as well as short names (Gene ID) are provided here.
Click here for file
[http://www.biomedcentral.com/content/supplementary/1471-2164-9-46-S4.PDF]
Publish with BioMed Central and every scientist can read your work free of charge
"BioMed Central will be the most significant development for disseminating the results of biomedical researc h in our lifetime."
Sir Paul Nurse, Cancer Research UK
Your research papers will be:
available free of charge to the entire biomedical community peer reviewed and published immediately upon acceptance cited in PubMed and archived on PubMed Central yours — you keep the copyright
Submit your manuscript here:
http://www.biomedcentral.com/info/publishing_adv.asp
BioMedcentral
29. Huminiecki L, Lloyd AT, Wolfe KH: Congruence of tissue expres-sion profiles from Gene Expresexpres-sion Atlas, SAGEmap and TissueInfo databases. BMC Genomics 2003, 4(1):31.
30. Kendziorski C, Irizarry RA, Chen KS, Haag JD, Gould MN: On the utility of pooling biological samples in microarray experi-ments. Proc Natl Acad Sci USA 2005, 102(12):4252-4257.
31. Herwig R, Aanstad P, Clark M, Lehrach H: Statistical evaluation of differential expression on cDNA nylon arrays with replicated experiments. Nucleic Acids Res 2001, 29(23):E117.
32. Spiess AN, Mueller N, Ivell R: Amplified RNA degradation in T7-amplification methods results in biased microarray hybridi-zations. BMC Genomics 2003, 4(1):44.
33. Cha RS, Thilly WG: PCR Methods Appl 1993, 3:S18-29.
34. Nagy ZB, Kelemen JZ, Feher LZ, Zvara A, Juhasz K, Puskas LG: Real-time polymerase chain reaction-based exponential sample amplification for microarray gene expression profiling. Anal
Biochem 2005, 337(1):76-83.
35. Roberts RM, Ezashi T, Rosenfeld CS, Ealy AD, Kubisch HM: Evolu-tion of the interferon tau genes and their promoters, and maternal-trophoblast interactions in control of their expres-sion. Reprod Suppl 2003, 61:239-251.
36. Nguyen C, Rocha D, Granjeaud S, Baldit M, Bernard K, Naquet P, Jor-dan BR: Differential gene expression in the murine thymus assayed by quantitative hybridization of arrayed cDNA clones. Genomics 1995, 29(1):207-216.
37. MacLean JA 2nd, Chakrabarty A, Xie S, Bixby JA, Roberts RM, Green JA: Family of Kunitz proteins from trophoblast: expression of the trophoblast Kunitz domain proteins (TKDP) in cattle and sheep. Mol Reprod Dev 2003, 65(1):30-40.
38. Charpigny G, Reinaud P, Tamby JP, Creminon C, Martal J, Maclouf J, Guillomot M: Expression of cyclooxygenase-1 and -2 in ovine endometrium during the estrous cycle and early pregnancy.
Endocrinology 1997, 138(5):2163-2171.
39. Puskas LG, Zvara A, Hackler L Jr, Van Hummelen P: RNA amplifi-cation results in reproducible microarray data with slight ratio bias. Biotechniques 2002, 32(6):1330-1334. 1336, 1338, 1340. 40. van Haaften RI, Schroen B, Janssen BJ, van Erk A, Debets JJ, Smeets HJ, Smits JF, van den Wijngaard A, Pinto YM, Evelo CT: Biologically relevant effects of mRNA amplification on gene expression profiles. BMC Bioinformatics 2006, 7:200.
41. Laurell C, Wirta V, Nilsson P, Lundeberg J: Comparative analysis of a 3' end tag PCR and a linear RNA amplification approach for microarray analysis. J Biotechnol 2007, 127(4):638-646. 42. Decraene C, Reguigne-Arnould I, Auffray C, Pietu G: Reverse
tran-scription in the presence of dideoxynucleotides to increase the sensitivity of expression monitoring with cDNA arrays.
Biotechniques 1999, 27(5):962-966.
43. Bertolini M, Beam SW, Shim H, Bertolini LR, Moyer AL, Famula TR, Anderson GB: Growth, development, and gene expression by in vivo- and in vitro-produced day 7 and 16 bovine embryos.
Mol Reprod Dev 2002, 63(3):318-328.
44. Smith JL, Sheffield LG: Production and regulation of leptin in bovine mammary epithelial cells. Domest Anim Endocrinol 2002, 22(3):145-154.
45. The Gene Index database (TGI) [http://compbio.dfci.harvard.edu/tgi/]
46. National Center for Biotechnology Information (NCBI). . 47. Gene Expression Omnibus (GEO)
[http://www.ncbi.nlm.nih.gov/geo/]
48. Centre de Ressources Biologiques GADIE [http://www-crb.jouy.inra.fr/]
49. The R Project for Statistical Computing [http://www.r-project.org/]
50. MultiExperiment Viewer Software [http://www.tm4.org/mev.html]
51. Hennequet-Antier C, Chiapello H, Piot K, Degrelle S, Hue I, Renard JP, Rodolphe F, Robin S: AnovArray: a set of SAS macros for the analysis of variance of gene expression data. BMC Bioinformatics 2005, 6:150.
52. Gene Ontology Database [http://www.geneontology.org/] 53. Emboss package [http://emboss.sourceforge.net/]