HAL Id: hal-00860813
https://hal.archives-ouvertes.fr/hal-00860813
Submitted on 11 Sep 2013HAL is a multi-disciplinary open access archive for the deposit and dissemination of sci-entific research documents, whether they are pub-lished or not. The documents may come from teaching and research institutions in France or abroad, or from public or private research centers.
L’archive ouverte pluridisciplinaire HAL, est destinée au dépôt et à la diffusion de documents scientifiques de niveau recherche, publiés ou non, émanant des établissements d’enseignement et de recherche français ou étrangers, des laboratoires publics ou privés.
Combining a process based model with a functional
structural plant model for production partitioning and
visualization
F. Lu, J.C. Mailhol, H. Rey, Sébastien Griffon, D. Auclair, P. de Reffye
To cite this version:
F. Lu, J.C. Mailhol, H. Rey, Sébastien Griffon, D. Auclair, et al.. Combining a process based model with a functional structural plant model for production partitioning and visualization. 6th Interna-tional workshop on funcInterna-tional-structural plant models, Sep 2010, Davis, United States. p. 41 - p. 43. �hal-00860813�
Combining a process based model with a functional structural
plant model for production partitioning and visualization
Lu Feng
1,*, Jean-Claude Mailhol
2, Hervé Rey
1, Sébastien Griffon
1,
Daniel Auclair
3and Philippe De Reffye
1,41
CIRAD, UMR AMAP, F-34398, Montpellier, France
2
Cemagref, UMR G-eau, F-34096, Montpellier, France
3
INRA, UMR AMAP, F-34398, Montpellier, France
4
INRIA Saclay, EPI DigiPlante, F-34398, Montpellier, France
*Corresponding author,
[email protected]
Keywords: Process Based Model, Functional Structural Plant Model, Plant Architecture,
Crop Production, Visualization
Introduction
Process Based Models (PBM) are used to compute crop yield, they treat a field as a homogenous medium, total production is computed accurately, but there is little information on individual variability of plants, and number and size of organs. Functional Structural Plant Models (FSPM) simulate individual plant development and growth, they build plant architecture on the basis of biomass production and partitioning according to botanical rules, but generally lack the ability to upscale to the field level to address crop production. In the present study we combined crop biomass production of maize estimated by the PBM PILOTE with biomass partitioning and individual plant architecture generated by the FSPM GreenLab, in order to benefit from the field-level accuracy of the former and from the heterogeneity of individual architecture of the latter.
Model description and comparison
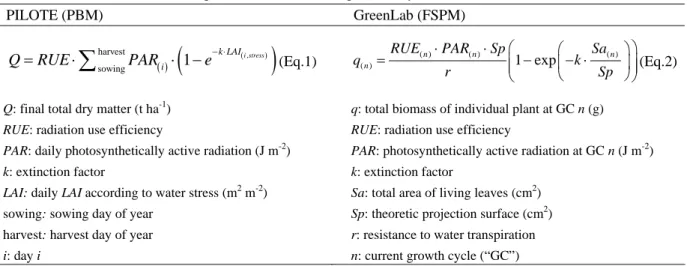
PILOTE (Mailhol et al., 1997) is a model designed for crop yield simulation. GreenLab (Guo et al., 2006) is an FSPM designed for individual plant architectural development and biomass partitioning. Although GreenLab and PILOTE address different scales, they take into account similar processes for biomass computation, based on Beer’s Law for light interception (Table 1).
Table 1. Comparison of biomass computation by PILOTE and GreenLab
PILOTE (PBM) GreenLab (FSPM)
,
harvest sowing 1 i stress k LAI iQRUE
PAR e (Eq.1) ( ) ( ) ( ) 1 exp ( )n n n n RUE PAR Sp Sa q k r S p (Eq.2)
Q: final total dry matter (t ha-1) q: total biomass of individual plant at GC n (g)
RUE: radiation use efficiency RUE: radiation use efficiency
PAR: daily photosynthetically active radiation (J m-2) PAR: photosynthetically active radiation at GC n (J m-2)
k: extinction factor k: extinction factor
LAI: daily LAI according to water stress (m2 m-2) Sa: total area of living leaves (cm2)
sowing: sowing day of year Sp: theoretic projection surface (cm2)
harvest: harvest day of year r: resistance to water transpiration i: day i n: current growth cycle (“GC”)
The differences between the two models come from different spatio-temporal scales: PILOTE addresses plant population per unit area, GreenLab addresses individual plants. PILOTE computation is on a daily basis, GreenLab computation is by growth cycle (GC), based on thermal time. LAI in GreenLab is optimized by Sa/Sp ratio for an individual plant: leaf area is estimated from the source-sink balance, and the projection surface Sp is computed by multi-fitting and Eq.2 inversion (Ma et al., 2008). If the field is homogeneous, the LAI and total biomass computed by both models should be identical; on the contrary, if the results are different, it could be explained by field heterogeneity.
41
Field experiment
Measurements were conducted in 2009 at the Cemagref experimental station (Montpellier, FR). Maize (Pioneer PR35Y65) was sown on April 23 at 75000 plants per ha. The irrigation protocol involved surface drip irrigation, irrigation dates were adjusted on the basis of tensiometer monitoring and neutron probe measurements to avoid drainage risk and supply a water amount of 350 mm. LAI was monitored weekly during the cropping cycle, using a LAI2000 (LI-COR). For PILOTE calibration, plant samples were collected after maturity for evaluating total above ground dry matter and grain yield. For GreenLab calibration, observations were made on May 25, June 8, June 25, July 15 and July 30, each time 6 plants were harvested. Fresh weights of all organs (blade, petiole, internode, tassel and spike) were measured for each phytomer.
Model Calibration Results
Grain yield and total dry mater were accurately simulated by PILOTE (Fig. 1), confirming the good performance of the model previously established by Khaledian et al. (2009). Based on phytomer
Fig. 1. Maize yield simulated by PILOTE Fig.2. Multi-fitting result of Maize by Gree
measurements, parameter fitting in GreenLab provided a satisfactory result (Fig. 2).
nLab
nalysis and Model Combination
mass and LAI simulated by both models were compared on the
GLa : GreenLab simulation
dates.
easurement and estimated leaf thickness.
5 10 15 20 25 30 0 100 200 300 400 500 600 b) Cob
Rank from bottom
5 10 15 0 2 4 6 8 10 12 14 16 18 a) Blade
Rank from bottom
B iom ass (g ) 0 5 10 15 20 25 30 0 5 10 15 20 25 30 Measured (Mg/ha) S im u la te d (M g /h a ) (b) RMSE = 0,35 Mg/ha A
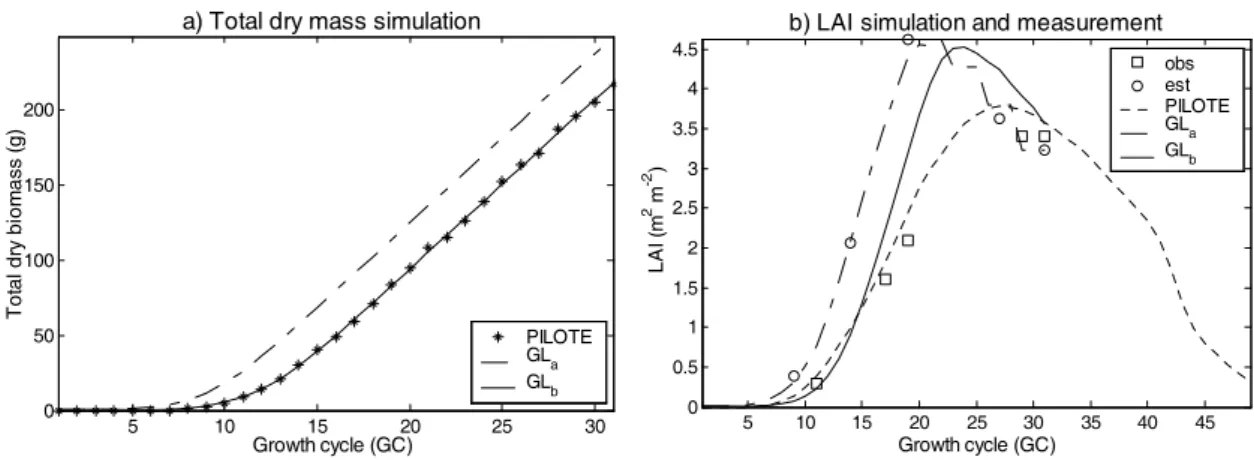
In a first step, the results of total bio
same scale (individual plant) and time step (growth cycle), all plants being assumed identical for GreenLab computation (Fig.3, PILOTE and GLa). The total biomass and LAI computed with
GreenLab (GLa) displayed an earlier start and a steeper slope compared to PILOTE results.
Fig. 3. Biomass and LAI output from PILOTE and GreenLab
with all plants identical. GLb : GreenLab simulation with different germination
obs : LAI observed from field measurement. est : individual LAI computed by fresh mass m
a) Total dry mass simulation b) LAI simulation and measurement
5 10 15 20 25 30 0 50 100 150 200 Growth cycle (GC) Tot al dr y bi om as s (g) PILOTE GLa GLb 5 10 15 20 25 30 35 40 45 0 0.5 1 1.5 2 2.5 3 3.5 4 4.5 obs est PILOTE GLa GLb Growth cycle (GC) LA I ( m 2 m -2 ) 42
Within a field, individual growth of plants is however known to be heterogeneous, in particular concerning seedling emergence (Pommel et al., 2002). In a second step we considered a heterogeneity in germination date. We modelled a distribution of germination date (ranging from 1 to 8 GC) with a beta law function, fitted by least squares method (Fig.4). The resulting growth curves were then very close (Fig.3, GLb). An example of architectural development of an individual maize plant is shown in
Fig. 5. 0 1 2 3 4 5 6 7 0 0.1 0.2 0.3 0.4 Germination date (GC) Pr ob ab ilit y ( 10 0% )
Fig. 4. Distribution of germination date
GC5 GC10 GC15 GC20 GC25 GC31
Fig. 5. Simulated maize architectural development
Discussion and Conclusion
PBMs and FSPMs both play important roles in agricultural studies and have their respective advantages, and cooperation between them can bring new opportunities in study methods and applications. In Fig. 3 there is still a slight discrepancy for leaf area estimation, despite the very good fit for total biomass. This can be attributed i) to the error in LAI measurement with a plant canopy analyzer, due to a heterogeneous plant cover, and ii) to the error in leaf thickness used for individual leaf area computation, which was done by allometry and not directly measured. Further work will seek to improve these estimations. Despite this uncertainty, the present work shows that the 3D architecture of a field can be successfully built based jointly on a PBM output and the knowledge and information from an FSPM. The former, offering a very good performance for total yield estimation, can help to calibrate the latter, which in return can account for individual spatial and/or temporal heterogeneity. From a crop production curve to plant individual 3D architecture according to growth stages, several opportunities in agricultural production optimization can be foreseen for the future, in addition to field and landscape visualization. Focusing on providing architectures for PBM from FSPM, this study will continue on other plants (wheat, sunflower, etc.), based on combination with other PBMs.
Acknowledgments
This study was funded by the China Scholarship Council and supported by CIRAD. References
Guo, Y., Ma, Y.T., Zhan, Z.G., Li, B.G., Dingkuhn, M., Luquet, D., De Reffye, P. (2006). Parameter optimization and field validation of the functional-structural model GreenLab for maize. Ann Bot 97, 89-92.
Khaledian, R.M., Mailhol, J., Ruelle, P., Rosique, P. (2009). Adapting PILOTE model for water and yield management under direct seeding system: The case of corn and durum wheat in a Mediterranean context. Agr Water Manage 96, 757-770.
Ma, Y.T., Wen, M.P., Guo, Y., Li, B.G., Cournede, P.H., De Reffye, P. (2008). Parameter optimization and field validation of the functional–structural model GreenLab for maize at different population densities. Ann Bot 101, 1185-1194.
Mailhol, J.C., Olufayob, A.A., Ruelle, P. (1997). Sorghum and sunflower evapotranspiration and yield from simulated leaf area index. Agr Water Manage 35, 167-182.
Pommel, B., Mouraux, D., Cappellen, O., Ledent, I.F. (2002). Influence of delayed emergence and canopy skips on the growth and development of maize plants: a plant scale approach with CERES-Maize. Eur J Agronomy 16, 263-277.
43