HAL Id: hal-01821483
https://hal.archives-ouvertes.fr/hal-01821483
Submitted on 31 May 2021
HAL is a multi-disciplinary open access
archive for the deposit and dissemination of
sci-entific research documents, whether they are
pub-lished or not. The documents may come from
teaching and research institutions in France or
abroad, or from public or private research centers.
L’archive ouverte pluridisciplinaire HAL, est
destinée au dépôt et à la diffusion de documents
scientifiques de niveau recherche, publiés ou non,
émanant des établissements d’enseignement et de
recherche français ou étrangers, des laboratoires
publics ou privés.
Distributed under a Creative Commons Attribution| 4.0 International License
effective prevention
Emmanuel Barankanira, Nicolas Molinari, Théodore Niyongabo, Christian
Laurent
To cite this version:
Emmanuel Barankanira, Nicolas Molinari, Théodore Niyongabo, Christian Laurent. Spatial analysis of
HIV infection and associated individual characteristics in Burundi: indications for effective prevention.
BMC Public Health, BioMed Central, 2016, 16 (1), �10.1186/s12889-016-2760-3�. �hal-01821483�
R E S E A R C H A R T I C L E
Open Access
Spatial analysis of HIV infection and
associated individual characteristics in
Burundi: indications for effective
prevention
Emmanuel Barankanira
1,2,5*, Nicolas Molinari
3, Théodore Niyongabo
4and Christian Laurent
2Abstract
Background: Adequate resource allocation is critical in the battle against HIV/AIDS, especially in Africa. The determination of the location and nature of HIV services to implement must comply with the geographic, social and behavioral characteristics of patients. We therefore investigated the spatial heterogeneity of HIV prevalence in Burundi and then assessed the association of social and behavioral characteristics with HIV infection accounting for the spatial heterogeneity.
Methods: We used data from the 2010 Demographic and Health Survey. We analyzed these data with a geostatistical approach (which takes into account spatial autocorrelation) by i) interpolating HIV data using the kernel density estimation, ii) identifying the spatial clusters with high and low HIV prevalence using the Kulldorff spatial scan statistics, and then iii) performing a multivariate spatial logistic regression.
Results: Overall HIV prevalence was 1.4 %. The interpolated data showed the great spatial heterogeneity of HIV prevalence (from 0 to 10 %), independently of administrative boundaries. A cluster with high HIV prevalence was found in the capital city and adjacent areas (3.9 %; relative risk 3.7, p < 0.001) whereas a cluster with low prevalence straddled two southern provinces (0 %; p = 0.02). By multivariate spatial analysis, HIV infection was significantly associated with the female sex (posterior odds ratio [POR] 1.36, 95 % credible interval [CrI] 1.13-1.64), an older age (POR 1.97, 95 % CrI 1.26-3.08), the level of education (POR 1.50, 95 % CrI 1.22-1.84), the marital status (POR 1.86, 95 % CrI 1.23-2.80), a higher wealth index (POR 2.11, 95 % CrI 1.77-2.51), the sexual activity (POR 1.76, 95 % CrI 1.04-2.96), and a history of sexually transmitted infection (POR 2.03, 95 % CrI 1.56-2.64).
Conclusions: Our study, which shows where and towards which populations HIV resources should be allocated, could help national health policy makers develop an effective HIV intervention in Burundi. Our findings support the strategy of the Joint United Nations Programme on HIV/AIDS (UNAIDS) for country-specific, in-depth analyses of HIV epidemics to tailor national prevention responses.
Keywords: HIV, Prevalence, Heterogeneity, Spatial, Factors
* Correspondence:baremma2002@yahoo.fr
1
Département des Sciences Naturelles, Ecole Normale Supérieure, Bujumbura, Burundi
2TransVIHMI, IRD UMI 233 / INSERM U 1175 / Université de Montpellier,
Montpellier, France
Full list of author information is available at the end of the article
© 2016 Barankanira et al. Open Access This article is distributed under the terms of the Creative Commons Attribution 4.0 International License (http://creativecommons.org/licenses/by/4.0/), which permits unrestricted use, distribution, and reproduction in any medium, provided you give appropriate credit to the original author(s) and the source, provide a link to the Creative Commons license, and indicate if changes were made. The Creative Commons Public Domain Dedication waiver (http://creativecommons.org/publicdomain/zero/1.0/) applies to the data made available in this article, unless otherwise stated.
Background
Adequate resource allocation is critical in the battle against HIV/AIDS, especially in sub-Saharan African countries where 70 % of the people living with HIV worldwide currently reside [1]. These countries face major financial constraints, shortages of healthcare workers, and poorly developed healthcare systems [1, 2]. The determination of the location and nature of HIV services to implement must therefore be made according to the state of the epidemic and to the geographic, social and behavioral characteristics of patients. The ‘Know your epidemic’ strategy of the Joint United Nations Programme on HIV/AIDS (UNAIDS) underlines the need for country-specific, in-depth analyses of HIV epi-demic features to tailor national prevention responses to the people most at risk [3].
Because half HIV cases only are diagnosed in sub-Saharan Africa [4], most countries rely on Demographic and Health Surveys (DHS) to estimate HIV prevalence along with other data including social and behavioral characteristics [5]. DHS are population-based surveys and use a standardized methodology. They are per-formed in large, random, clustered samples of people. Since 2001, DHS include informed, anonymous, and vol-untary HIV testing in adult women and men. However, a major limitation of crude DHS estimations is that the spatial heterogeneity of HIV prevalence and the hotspots of the disease are hardly examined, although aggregated regional HIV prevalence data can mask large intra-regional differences. In addition, the spatial heterogen-eity of HIV prevalence has seldom been taken into ac-count when examining the factors associated with HIV infection.
By contrast to standard statistical tools, spatial analysis methods allow investigating the spatial heterogeneity and identifying the hotspots of diseases independently of administrative boundaries. They also allow accounting for the spatial heterogeneity in the assessment of risk factors. These methods thus provide crucial additional data to national health policy makers for developing ef-fective interventions and allocating financial and human resources based on the local situations. They have there-fore been increasingly used in the last years, especially in the field of HIV/AIDS (a disease with a well-known spatial epidemiology) [6–15].
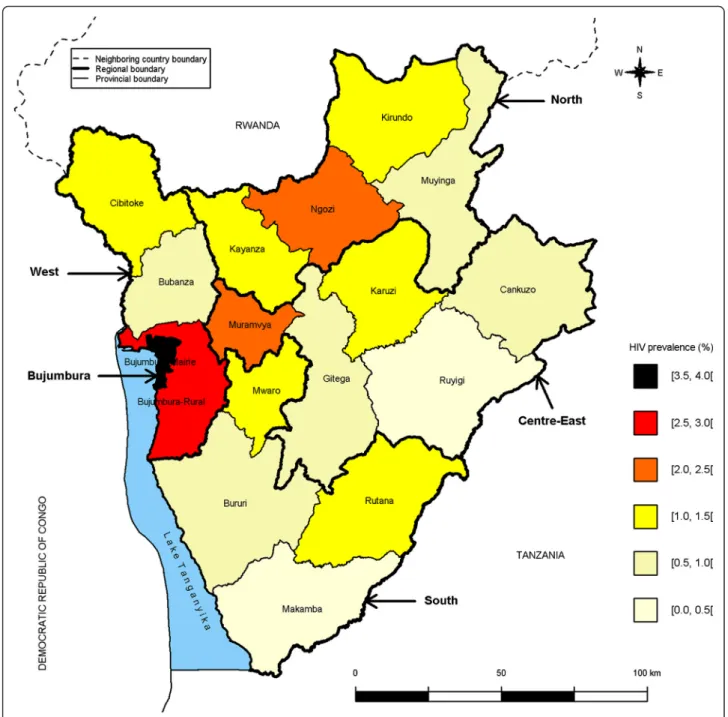
Burundi, in Eastern Africa, is among the world’s poor-est countries and was severely affected by a civil war from 1993 to 2003. It is bounded by Rwanda to the north, the Democratic Republic of Congo to the west, and Tanzania to the east and south-east (Fig. 1). The population is approximately 11 million inhabitants. The national AIDS program, launched in 1988, includes pre-vention, testing, care and treatment activities. HIV ser-vices have been progressively decentralized to primary
health centers throughout the country [16]. The 2010 Burundi DHS reported an overall HIV prevalence of 1.4 % among adults and suggested regional differences with HIV prevalence of 0.9 % in the South, 1.0 % in the Centre-East, 1.3 % in the North, 1.6 % in the West, and 3.7 % in Bujumbura-Mairie (the capital city) [17]. In September 2014, UNAIDS reported estimations of HIV prevalence at the smaller provincial level ranging from 0.4 % in two rural provinces to 3.6 % in Bujumbura-Mairie [18]. Based on individual-level data collected in the 2010 Burundi DHS, we further investigated the spatial heterogeneity of HIV prevalence and then assessed the association of social and behavioral charac-teristics with HIV infection accounting for the spatial heterogeneity.
Methods
Study design
We performed a cross-sectional study based on a secondary analysis of the 2010 Burundi DHS data.
Design and procedures of the 2010 Burundi DHS
The 2010 Burundi DHS was conducted by national au-thorities and ICF International between August 29, 2010 and January 30, 2011 following the standardized DHS methodology [5]. This methodology and crude results are described extensively elsewhere [17]. Briefly, the 2010 Burundi DHS used a stratified two-stage random cluster sampling design. Stratification was made at two levels: the provincial level (17 provinces) and the urban or rural area. At the first stage, 376 of the 8104 enumer-ation areas (i.e. groupings of households) identified in the 2008 national population and housing census [19] were selected with a probability proportional to their size (i.e. the number of households in each enumeration area). At the second stage, 24 households were selected in each enumeration area with an equal probability, leading to a total of 9024 eligible households. HIV tests were proposed to 50 % of the 9024 households. All women aged 15–49 years and men aged 15–59 years liv-ing in or havliv-ing spent the previous night in one of these households were eligible for HIV testing. The Institu-tional Review Board of ICF InternaInstitu-tional and the Na-tional Ethics Committee of Burundi approved the study protocol. After being provided with information, respon-dents aged 18 years or older and parents or guardians of minors aged 15–18 years gave their written consent to participate in the survey. Minors gave their oral assent.
Blood spot samples were collected from consenting household residents’ fingers and put on filter papers. Sero-logic screening for HIV infection was then performed on the dried blood spots at the Public Health National Insti-tute in Bujumbura-Mairie using an enzyme-linked im-munosorbent assay (ELISA; Vironostika HIV Uni-Form
Ag/Ab, Biomérieux, Marcy l’Etoile, France). All positive samples and 10 % of the negative samples (for quality con-trol) were further tested with a second ELISA (Enzignost HIV Integral II, Siemens, Erlangen, Germany). Samples with discordant results between both tests were reana-lyzed using a line immunoassay (INNO-LIA HIV I/II Score, Innogenetics, Gent, Belgium).
Social and behavioral characteristics of residents were collected using a standardized questionnaire and in-cluded gender (woman or man), age (continuous vari-able), level of education (no formal education, primary, secondary, or superior), marital status (single, married,
cohabiting, divorced, separated, or widowed), religion (Catholic, Protestant, Muslim, Adventist, Jehovah’s wit-ness, other, or none), wealth quintile (poorest, poorer, middle, richer, or richest), sexual activity (never had sex, active in the last four weeks, or not active in the last four weeks), the number of extramarital sex partners in the last 12 months, and a history of sexually transmitted infection (STI) in the last 12 months (yes or no).
The geographic coordinates (latitude and longitude) of the 376 enumeration areas were collected using the geo-graphic information system (GIS) and global positioning system (GPS) technologies. They were recorded at the
center of the enumeration areas. In order to preserve the confidentiality of the respondents, the GPS latitude/ longitude positions were randomly displaced (up to 2 km for the urban enumeration areas and up to 5 km for the rural enumeration areas, with 1 % of the rural enumeration areas being displaced up to 10 km).
Statistical analysis Study population
For the present study, the analyses were restricted to the 15–49 year age group because HIV testing had not been performed in women aged 50–59 years (by contrast to men) in the 2010 Burundi DHS. It is worth noting that UNAIDS also reports adult data in the 15–49 year age group [1, 18].
Data
All analyses used the individual-level data and their spe-cific weights provided in the DHS databases (available from the DHS program website [5]). As usual, the weights took into account the survey design of the 2010 Burundi DHS and the proportion of respondents in each enumeration area. They were equal to the inverse of the probability for a given resident of being included in the survey.
Spatial heterogeneity of HIV prevalence
First, we computed and mapped the crude estimations of HIV prevalence in the 17 provinces. We then used a non-spatial logistic regression model to assess the rela-tionship between HIV infection and the provinces, tak-ing the province with the lowest HIV prevalence as the reference category. These analyses were performed using the Stata software version 11 [20].
Second, we analyzed the spatial autocorrelation of HIV prevalence data by performing a global Moran test. Mor-an’s I statistic tests the null hypothesis that observed data at one location are independent of data at other lo-cations. Its value ranges from −1 (data perfectly dis-persed), 0 (data randomly dispersed) to 1 (data perfectly correlated). Because the Moran’s I statistic showed the existence of a significant spatial autocorrelation of our HIV prevalence data, we subsequently analyzed the data using a geostatistical approach which takes into account this spatial autocorrelation.
Third, we mapped HIV prevalence throughout the country independently of provincial boundaries using a Gaussian kernel density estimation with adaptive band-widths and the specific prevR package of R software (R Core Development Team, April 10, 2014) [21, 22]. This approach is promoted by UNAIDS and has been used to estimate HIV prevalence at a sub-national level in vari-ous countries including Burundi [18, 23]. It allows gen-erating a smoothed surface of HIV prevalence based on
observed data. In our study, we interpolated HIV preva-lence data in 449,065 points using the observed data in the 376 enumeration areas. As recommended by Larmarange and Bendaud [23], we set the number of observations at 500 so that the bandwidths adapt to capture this minimum number.
Finally, we identified the spatial clusters with high and low HIV prevalence using the Kulldorff spatial scan sta-tistics (SaTScan software version 9.3) [24]. This method has been widely used in the last years, especially in the field of HIV/AIDS [7, 10, 12, 15, 25–27]. It allows find-ing the location of areas with higher or lower numbers of HIV cases than expected under the hypothesis of uni-form spatial distribution of cases by gradually scanning circular windows of various sizes across the study area. We assumed that the number of HIV cases in each cir-cular window was an independent Bernoulli random variable. For the circular windows, we used a maximum radius of 15 Km for the detection of clusters with high HIV prevalence and of 50 Km for the detection of clus-ters with low prevalence. We chose these radii because high HIV prevalence was more likely in small, densely populated areas such as in Bujumbura-Mairie where the maximum distance between the centroid and the city’s boundaries is of 13 Km while low HIV prevalence was more likely in large, sparsely populated areas. We also used the default value of 50 % of the total study popula-tion for the maximal size of the clusters. The statistical significance of clusters was ascertained using the likeli-hood ratio test and its associated p-value obtained through 999 Monte Carlo simulations. The null hypoth-esis of uniform spatial distribution of HIV cases (no cluster) was rejected if the p-value was <0.05. When a cluster was identified, the strength of the clustering was estimated using the relative risk of excess HIV cases.
Factors associated with HIV infection
The association of social and behavioral characteristics with HIV infection (infected or not) was investigated using a spatial logistic regression model performed with the BayesX software version 2.1 [28]. This model allowed adjusting for the spatial and non-spatial random effects of provinces. The parameters were estimated using 400 Markov chain Monte Carlo simulations in re-stricted maximum likelihood regression models. Inde-pendent covariates associated with HIV infection with a conservative p-value of <0.2 in univariate analysis were subsequently tested in multivariate analysis [29]. A back-ward elimination procedure was used to determine the final model containing only the covariates significantly associated with HIV infection. The strength of associa-tions was estimated using the posterior odds ratios (PORs) and their 95 % credible intervals (CrIs). Finally,
the goodness-of-fit of models was assessed using the conditional Bayesian Information Criterion (BIC).
All statistical tests were interpreted at the 0.05 signifi-cance level.
Results
Characteristics of the study population
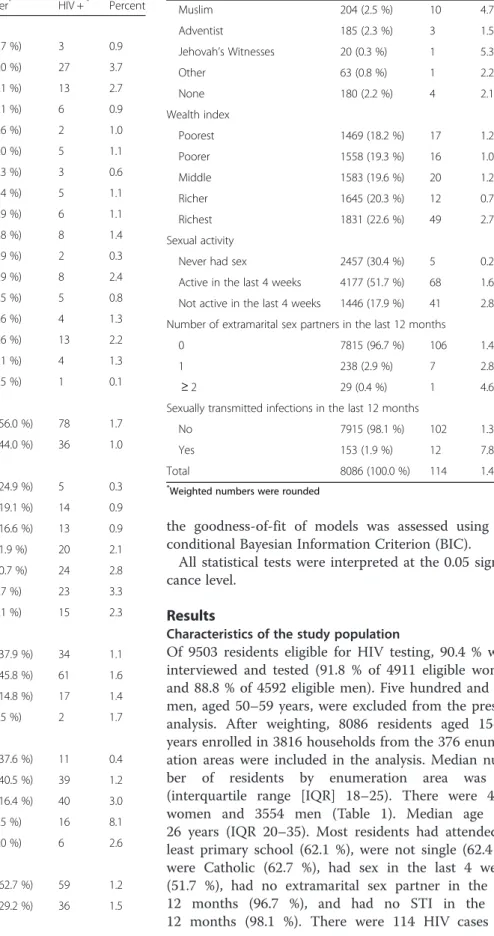
Of 9503 residents eligible for HIV testing, 90.4 % were interviewed and tested (91.8 % of 4911 eligible women and 88.8 % of 4592 eligible men). Five hundred and one men, aged 50–59 years, were excluded from the present analysis. After weighting, 8086 residents aged 15–49 years enrolled in 3816 households from the 376 enumer-ation areas were included in the analysis. Median num-ber of residents by enumeration area was 21 (interquartile range [IQR] 18–25). There were 4532 women and 3554 men (Table 1). Median age was 26 years (IQR 20–35). Most residents had attended at least primary school (62.1 %), were not single (62.4 %), were Catholic (62.7 %), had sex in the last 4 weeks (51.7 %), had no extramarital sex partner in the last 12 months (96.7 %), and had no STI in the last 12 months (98.1 %). There were 114 HIV cases (78 Table 1 HIV prevalence by province and resident’s characteristics
in adults aged 15–49 years in Burundi, 2010
Number* HIV +* Percent
Province Bubanza 379 (4.7 %) 3 0.9 Bujumbura-Mairie 731 (9.0 %) 27 3.7 Bujumbura-Rural 493 (6.1 %) 13 2.7 Bururi 654 (8.1 %) 6 0.9 Cankuzo 209 (2.6 %) 2 1.0 Cibitoke 489 (6.0 %) 5 1.1 Gitega 590 (7.3 %) 3 0.6 Karuzi 439 (5.4 %) 5 1.1 Kayanza 560 (6.9 %) 6 1.1 Kirundo 547 (6.8 %) 8 1.4 Makamba 474 (5.9 %) 2 0.3 Muramvya 313 (3.9 %) 8 2.4 Muyinga 610 (7.5 %) 5 0.8 Mwaro 288 (3.6 %) 4 1.3 Ngozi 613 (7.6 %) 13 2.2 Rutana 334 (4.1 %) 4 1.3 Ruyigi 362 (4.5 %) 1 0.1 Gender Women 4532 (56.0 %) 78 1.7 Men 3554 (44.0 %) 36 1.0
Age group (years)
15–19 2014 (24.9 %) 5 0.3 20–24 1544 (19.1 %) 14 0.9 25–29 1341 (16.6 %) 13 0.9 30–34 962 (11.9 %) 20 2.1 35–39 864 (10.7 %) 24 2.8 40–44 702 (8.7 %) 23 3.3 45–49 659 (8.1 %) 15 2.3 Level of education No formal education 3067 (37.9 %) 34 1.1 Primary school 3706 (45.8 %) 61 1.6 Secondary school 1197 (14.8 %) 17 1.4 Superior 116 (1.5 %) 2 1.7 Marital status Single 3040 (37.6 %) 11 0.4 Married 3272 (40.5 %) 39 1.2 Cohabiting 1329 (16.4 %) 40 3.0 Widowed 201 (2.5 %) 16 8.1 Divorced or separated 243 (3.0 %) 6 2.6 Religion Catholic 5066 (62.7 %) 59 1.2 Protestant 2359 (29.2 %) 36 1.5
Table 1 HIV prevalence by province and resident’s characteristics in adults aged 15–49 years in Burundi, 2010 (Continued)
Muslim 204 (2.5 %) 10 4.7 Adventist 185 (2.3 %) 3 1.5 Jehovah’s Witnesses 20 (0.3 %) 1 5.3 Other 63 (0.8 %) 1 2.2 None 180 (2.2 %) 4 2.1 Wealth index Poorest 1469 (18.2 %) 17 1.2 Poorer 1558 (19.3 %) 16 1.0 Middle 1583 (19.6 %) 20 1.2 Richer 1645 (20.3 %) 12 0.7 Richest 1831 (22.6 %) 49 2.7 Sexual activity
Never had sex 2457 (30.4 %) 5 0.2 Active in the last 4 weeks 4177 (51.7 %) 68 1.6 Not active in the last 4 weeks 1446 (17.9 %) 41 2.8 Number of extramarital sex partners in the last 12 months
0 7815 (96.7 %) 106 1.4
1 238 (2.9 %) 7 2.8
≥ 2 29 (0.4 %) 1 4.6
Sexually transmitted infections in the last 12 months
No 7915 (98.1 %) 102 1.3
Yes 153 (1.9 %) 12 7.8
Total 8086 (100.0 %) 114 1.4
*
women and 36 men), leading to an overall HIV preva-lence of 1.4 %.
Spatial heterogeneity of HIV prevalence
The crude estimations of HIV prevalence ranged from 0.1 % in the Ruyigi province to 3.7 % in Bujumbura-Mairie (Fig. 1 & Table 1). HIV prevalence was also high in the Bujumbura-Rural (2.7 %), Muramvya (2.4 %) and Ngozi (2.2 %) provinces. The logistic regression analysis further showed that HIV infection was significantly more frequent in six provinces (Bujumbura-Mairie, Bujumbura-Rural, Kirundo, Muramvya, Ngozi and Rutana) than in the Ruyigi province (Table 2).
Data of HIV prevalence were spatially auto correlated (Moran’s I = 0.03, p = 0.021). The interpolated data showed the great spatial heterogeneity of HIV preva-lence (from 0 to 10 %), independently of provincial boundaries (Fig. 2). The higher HIV prevalence was ob-served near Bujumbura-Mairie. Prevalence above 2.0 % was also observed in different locations throughout the country. By contrast, HIV prevalence was especially low in the Centre-East and South regions.
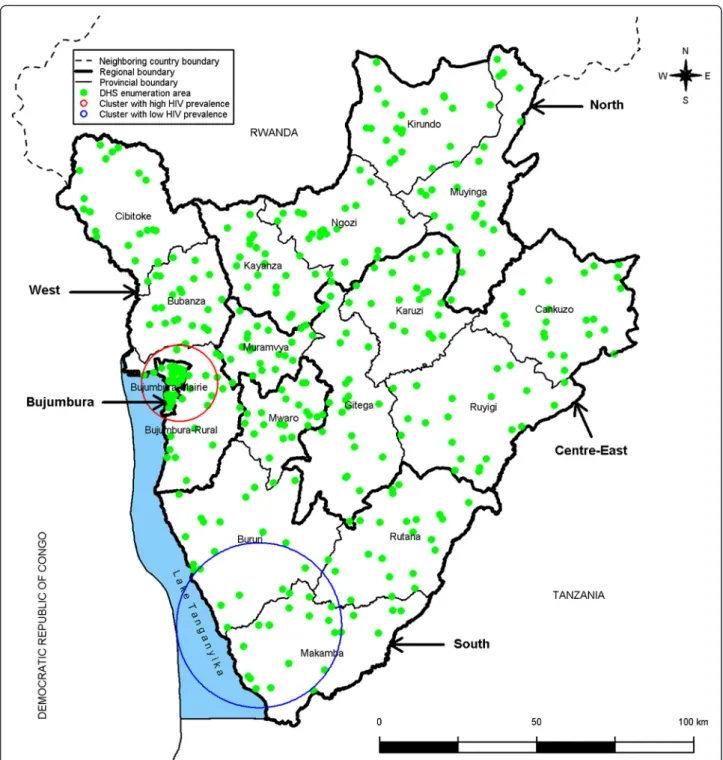
The spatial scan statistics analysis confirmed these findings (Fig. 3). It identified a cluster with high HIV prevalence with a 13.5 Km radius in Bujumbura-Mairie and adjacent areas. There were 37 HIV cases (32.5 % of all) giving a relative risk of 3.7 (p < 0.001). HIV preva-lence was thus 3.9 % among the 943 residents from 50
enumeration areas. The spatial scan statistics analysis also identified a cluster with low HIV prevalence with a 29.1 Km radius which straddled the Makamba and Bur-uri provinces (p = 0.02). No HIV case was detected in this cluster although the study included 651 residents from 23 enumeration areas. By contrast, no cluster was identified in the Centre-East region including the Ruyigi province.
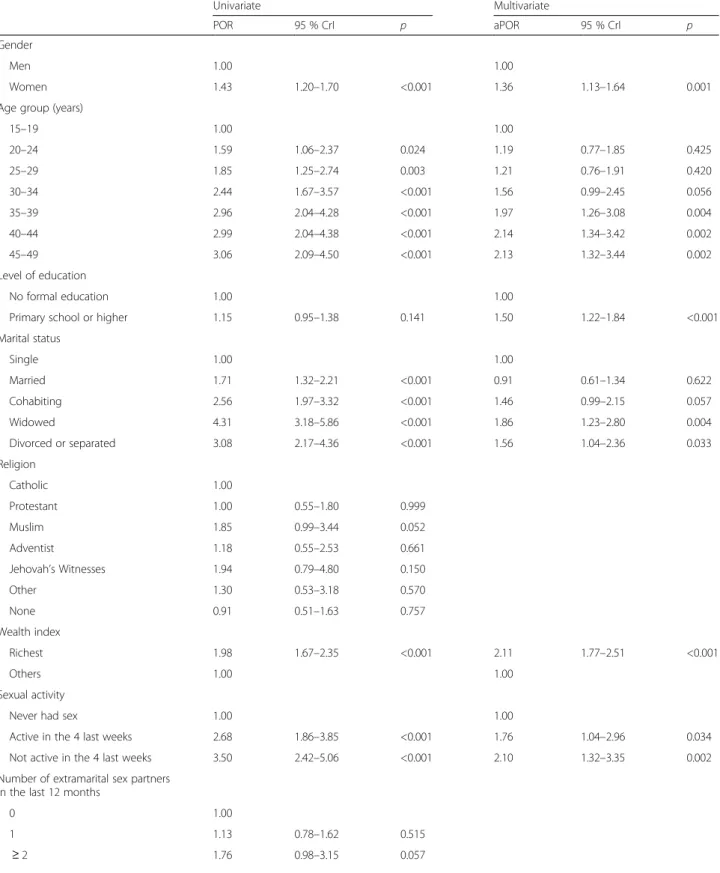
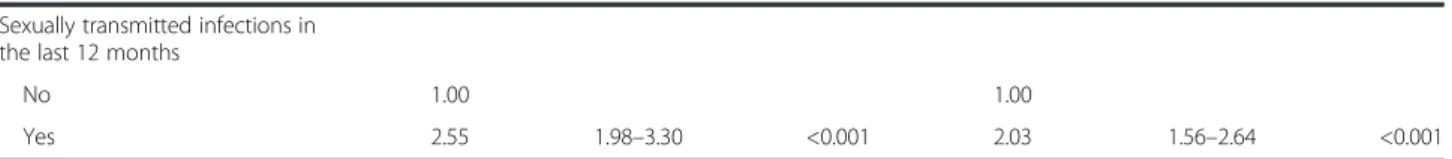
Spatial analysis of factors associated with HIV infection After controlling for the spatial heterogeneity (Table 3), HIV infection was strongly associated in the univariate analysis with the female sex (POR 1.43, 95 % CrI 1.20-1.70, p < 0.001), an older age (e.g. POR 2.96, 95 % CrI 2.04–4.28, p < 0.001 for 35–39 years versus 15–19 years), the marital status (e.g. POR 4.31, 95 % CrI 3.18–5.86, p < 0.001 for widowed versus single), a higher wealth index (POR 1.98, 95 % CrI 1.67-2.35, p < 0.001 for richest versus others), the sexual activity (e.g. POR 2.68, 95 % CrI 1.86–3.85, p < 0.001 for active in the last 4 weeks versus never had sex), and a history of STI in the last 12 months (POR 2.55, 95 % CrI 1.98–3.30, p < 0.001). HIV infection also tended to be associated with the religion (POR 1.85, 95 % CrI 0.99–3.44, p = 0.052 for Muslim versus Catholic), and the number of extramarital sex partners in the last 12 months (POR 1.76, 95 % CrI 0.98-3.15, p = 0.057 for ≥2 extramarital sex partners versus none) but the statistical significance was not reached. By contrast, HIV infection was not associated with the level of education (POR 1.15, 95 % CrI 0.95–1.38, p = 0.141).
By multivariate spatial analysis (Table 3), HIV infection remained significantly associated with the female sex (POR 1.36, 95 % CrI 1.13-1.64, p = 0.001), an older age (e.g. POR 1.97, 95 % CrI 1.26–3.08, p = 0.004 for 35–39 years versus 15–19 years), the marital status (e.g. POR 1.86, 95 % CrI 1.23-2.80, p = 0.004 for widowed versus single), a higher wealth index (POR 2.11, 95 % CrI 1.77-2.51, p < 0.001 for richest versus others), the sexual activity (e.g. POR 1.76, 95 % CrI 1.04-2.96, p = 0.034 for active in the last four weeks versus never had sex), and a history of STI in the last 12 months (POR 2.03, 95 % CrI 1.56-2.64, p < 0.001). HIV infec-tion was also significantly associated with the level of education, being higher in residents who had attended school than in those who did not (POR 1.50, 95 % CrI 1.22–1.84, p < 0.001).
Discussion
This spatial study allowed identifying populations at higher risk of HIV infection because of geographic, so-cial or behavioral characteristics in Burundi.
Thus, our study added important information on the spatial heterogeneity of HIV infection in this country. We first found a significant association between HIV Table 2 Relationship between HIV infection and provinces in
adults aged 15–49 years in Burundi, 2010
Province OR 95 % CI p* Bubanza 6.32 0.60–66.50 0.124 Bujumbura-Mairie 28.07 3.63–217.04 0.001 Bujumbura-Rural 20.41 2.42–172.16 0.006 Bururi 6.22 0.63–61.17 0.117 Cankuzo 6.97 0.74–65.74 0.090 Cibitoke 7.85 0.79–77.69 0.078 Gitega 4.18 0.34–51.37 0.263 Karuzi 8.03 0.89–72.14 0.063 Kayanza 7.90 0.89–70.33 0.064 Kirundo 10.16 1.13–91.22 0.039 Makamba 2.44 0.23–25.38 0.456 Muramvya 18.12 2.21–148.54 0.007 Muyinga 5.52 0.48–63.60 0.170 Mwaro 9.23 0.89–95.74 0.063 Ngozi 16.17 1.86–140.79 0.012 Rutana 9.72 1.08–87.44 0.043 Ruyigi 1.00
OR odds ratio, CI confidence interval. *P-value for the corresponding province versus the Ruyigi province
infection and the provinces. By contrast, the 2010 Burundi DHS report did not analyze HIV data by prov-ince [17]. UNAIDS recently reported HIV prevalence by province but did not assess the statistical significance of differences [18]. Our interpolated data further showed different locations with relatively high HIV prevalence, independently of provincial boundaries. Finally, we
identified a cluster with high HIV prevalence centered in Bujumbura-Mairie and a cluster with low prevalence in the southern part of the country. Cuadros et al. also found a significant cluster with high HIV prevalence in Bujumbura-Mairie but they did not detect any signifi-cant cluster with low prevalence (p = 0.069) probably because they performed their study in a slightly different
population including men aged 50–59 years and used unweighted data [7]. Overall, our findings in Burundi are consistent with the localized spatial clustering of HIV in-fection found in other countries [6–10, 15]. They highlighted that the crude regional estimations of the 2010 Burundi DHS report masked intra-regional hetero-geneities in HIV prevalence [17].
In our study controlling for this spatial heterogeneity, HIV infection was significantly more frequent in the
residents who were women, older than 35 years, edu-cated, widowed, divorced or separated, richest, sexually active, and in those who had had STIs in the last 12 months. These factors are well-known risk factors for HIV infection [30–34]. However, the novelty of our spatial analysis is that it provided better estimators of the strength of associations than a non-spatial analysis because the former takes into account the spatial auto-correlation of data.
Table 3 Univariate and multivariate spatial logistic regression analyses of factors associated with HIV infection in adults aged 15–49 years in Burundi, 2010
Univariate Multivariate
POR 95 % CrI p aPOR 95 % CrI p
Gender
Men 1.00 1.00
Women 1.43 1.20–1.70 <0.001 1.36 1.13–1.64 0.001
Age group (years)
15–19 1.00 1.00 20–24 1.59 1.06–2.37 0.024 1.19 0.77–1.85 0.425 25–29 1.85 1.25–2.74 0.003 1.21 0.76–1.91 0.420 30–34 2.44 1.67–3.57 <0.001 1.56 0.99–2.45 0.056 35–39 2.96 2.04–4.28 <0.001 1.97 1.26–3.08 0.004 40–44 2.99 2.04–4.38 <0.001 2.14 1.34–3.42 0.002 45–49 3.06 2.09–4.50 <0.001 2.13 1.32–3.44 0.002 Level of education No formal education 1.00 1.00
Primary school or higher 1.15 0.95–1.38 0.141 1.50 1.22–1.84 <0.001 Marital status Single 1.00 1.00 Married 1.71 1.32–2.21 <0.001 0.91 0.61–1.34 0.622 Cohabiting 2.56 1.97–3.32 <0.001 1.46 0.99–2.15 0.057 Widowed 4.31 3.18–5.86 <0.001 1.86 1.23–2.80 0.004 Divorced or separated 3.08 2.17–4.36 <0.001 1.56 1.04–2.36 0.033 Religion Catholic 1.00 Protestant 1.00 0.55–1.80 0.999 Muslim 1.85 0.99–3.44 0.052 Adventist 1.18 0.55–2.53 0.661 Jehovah’s Witnesses 1.94 0.79–4.80 0.150 Other 1.30 0.53–3.18 0.570 None 0.91 0.51–1.63 0.757 Wealth index Richest 1.98 1.67–2.35 <0.001 2.11 1.77–2.51 <0.001 Others 1.00 1.00 Sexual activity
Never had sex 1.00 1.00
Active in the 4 last weeks 2.68 1.86–3.85 <0.001 1.76 1.04–2.96 0.034 Not active in the 4 last weeks 3.50 2.42–5.06 <0.001 2.10 1.32–3.35 0.002 Number of extramarital sex partners
in the last 12 months
0 1.00
1 1.13 0.78–1.62 0.515
Our findings confirmed that in-depth analyses of local HIV epidemics are crucial for national AIDS programs when designing the most effective prevention responses [3]. Indeed, the reduction of the number of new HIV in-fections implies the need for a greater understanding of ‘where’ and ‘towards which populations’ efforts should be concentrated, in terms of primary and secondary preven-tion activities such as counseling, availability and acces-sibility of condoms, HIV testing, linkage to care, early antiretroviral treatment, and support. For instance in Burundi, our findings suggest that HIV activities should be especially reinforced in and around Bujumbura-Mairie. With regard to social or behavioral characteris-tics, greater efforts should be focused on higher risk groups such as women, people who are older than 35 years, educated, widowed, divorced or separated, richest, sexually active, and those with STIs. In addition, the reasons for the spatial heterogeneity of HIV preva-lence should be investigated.
One of the strengths of our study was the use of data collected in a DHS based on a standardized method-ology. A second strength was that this DHS was large, involving 8086 residents enrolled in 3816 households from 376 enumeration areas. Thus, although the 2010 Burundi DHS was designed to provide estimates of HIV prevalence at the national and regional level (as the other DHS), estimates at the provincial level have been found to be good or moderately good [18, 23]. Finally, we analyzed data using standardized geostatistical methods which take into account the spatial autocorrel-ation of data.
Our findings should be interpreted taking into account several study limitations. First, as HIV prevalence is quite low in Burundi, the spatial variability was relatively modest. In addition, there was zero HIV case in certain enumeration areas. This may have limited our ability to find significant associations with HIV infection at the provincial level (for instance, between the Cibitoke, Kar-uzi, Kayanza and Mwaro provinces and the Ruyigi prov-ince). Second, the spatial logistic regression method used here to assess the association of social and behav-ioral characteristics with HIV infection provides one sin-gle posterior odds ratio by characteristic assuming that the strength of the association is uniform over the study area. However, this hypothesis might be incorrect, espe-cially as our study area was large (the whole country).
An additional analysis using a geographically weighted regression method which would provide the posterior odds ratios specific to the cluster with high HIV preva-lence might be useful for identifying the populations most in need of interventions [35].
Conclusion
In conclusion, this study could help health policy makers develop an effective intervention in Burundi by showing where and towards which populations HIV resources should be allocated. Our findings support the need for in-depth analyses of HIV epidemics in every countries to tailor national prevention responses, as promoted by UNAIDS. This should encourage program managers in other countries to perform such studies in their own set-tings. This kind of study is not costly and is relatively rapid thanks to the availability of recurrent DHS data.
Abbreviations
AIDS:acquired immune deficiency syndrome; CrI: credible interval; DHS: demographic and health survey; GIS: geographic information system; GPS: global positioning system; HIV: human immunodeficiency virus; IQR: interquartile range; POR: posterior odds ratio; STI: sexually transmitted infection; UNAIDS: Joint United Nations Programme on HIV/AIDS. Competing interests
The authors declare that they have no competing interests. Authors’ contributions
E.B., N.M., and C.L. elaborated the study design. E.B. obtained the permission to use the 2010 Burundi DHS data, performed the statistical analysis and, with C.L., wrote the first draft of the paper. E.B., N.M., T.N. and C.L. contributed to the interpretation of the results, reviewed the draft, and approved the final manuscript.
Acknowledgments
We thank the Institut de Statistiques et d’Études Économiques du Burundi (ISTEEBU), the Ministère de la Santé Publique et de la Lutte contre le Sida [Burundi] (MSPLS), and ICF International which performed the 2010 Burundi DHS, Measure DHS which provided the databases, and Jude Sweeney (Rome, Italy) for the English revision and editing of the manuscript. Emmanuel Barankanira was the recipient of a doctoral fellowship from the Ministry of Higher Education and Scientific Research in Burundi.
Author details
1Département des Sciences Naturelles, Ecole Normale Supérieure, Bujumbura,
Burundi.2TransVIHMI, IRD UMI 233 / INSERM U 1175 / Université de
Montpellier, Montpellier, France.3IMAG, UMR 519 / Centre Hospitalier Régional Universitaire de Montpellier / Université de Montpellier, Montpellier, France.4Centre Hospitalier Universitaire de Kamenge, Bujumbura, Burundi. 5Institut de Recherche pour le Développement (UMI 233), 911 avenue
Agropolis, BP 64501, Montpellier 34394 cedex 5, France.
Received: 20 July 2015 Accepted: 20 January 2016
Table 3 Univariate and multivariate spatial logistic regression analyses of factors associated with HIV infection in adults aged 15–49 years in Burundi, 2010 (Continued)
Sexually transmitted infections in the last 12 months
No 1.00 1.00
Yes 2.55 1.98–3.30 <0.001 2.03 1.56–2.64 <0.001
References
1. UNAIDS. Global report on the AIDS epidemic. 2013 [July 15, 2015]. [http:// www.unaids.org/en/media/unaids/contentassets/documents/epidemiology/ 2013/gr2013/UNAIDS_Global_Report_2013_en.pdf].
2. Laurent C. Scaling up HIV treatment in resource-limited countries: The challenge of staff shortages. J Public Health Policy. 2011;32(2):211–8. 3. UNAIDS. Practical guidelines for intensifying HIV prevention: towards
universal access. 2007 [July 15, 2015]. [http://data.unaids.org/pub/Manual/ 2007/20070306_Prevention_Guidelines_Towards_Universal_Access_en.pdf]. 4. UNAIDS. 90–90–90 - An ambitious treatment target to help end the AIDS
epidemic. 2014 [November 10, 2015]. [http://www.unaids.org/en/resources/ documents/2014/90-90-90].
5. Measure DHS. Demographic and Health Surveys. [July 15, 2015]. [http:// www.measuredhs.com].
6. Tanser F, LeSueur D, Solarsh G, Wilkinson D. HIV heterogeneity and proximity of homestead to roads in rural South Africa: an exploration using a geographical information system. Trop Med Int Health. 2000;5(1):40–6. 7. Cuadros DF, Awad SF, Abu-Raddad LJ. Mapping HIV clustering: a strategy
for identifying populations at high risk of HIV infection in sub-Saharan Africa. Int J Health Geogr. 2013;12(1):28.
8. Wand H, Ramjee G. Targeting the hotspots: investigating spatial and demographic variations in HIV infection in small communities in South Africa. J Int AIDS Soc. 2010;13(1):41.
9. Messina JP, Emch M, Muwonga J, Mwandagalirwa K, Edidi SB, Mama N, et al. Spatial and socio-behavioral patterns of HIV prevalence in the Democratic Republic of Congo. Soc Sci Med. 2010;71(8):1428–35. 10. Tanser F, Barnighausen T, Cooke GS, Newell M-L. Localized spatial clustering
of HIV infections in a widely disseminated rural South African epidemic. Int J Epidemiol. 2009;38(4):1008–16.
11. Kandala N-B, Ji C, Cappuccio PF, Stones RW. The epidemiology of HIV infection in Zambia. AIDS Care. 2008;20(7):812–9.
12. Chimoyi LA, Musenge E. Spatial analysis of factors associated with HIV infection among young people in Uganda, 2011. BMC Public Health. 2014; 14(1):555.
13. Niragire F, Achia TNO, Lyambabaje A, Ntaganira J. Bayesian mapping of HIV infection among women of reproductive age in Rwanda. PLoS ONE. 2015; 10(3):e0119944. Schillaci G, éditeur.
14. Zulu LC, Kalipeni E, Johannes E. Analyzing spatial clustering and the spatiotemporal nature and trends of HIV/AIDS prevalence using GIS: the case of Malawi, 1994–2010. BMC Infect Dis. 2014;14(1):285.
15. González R, Augusto OJ, Munguambe K, Pierrat C, Pedro EN, Sacoor C, et al. HIV incidence and spatial clustering in a rural area of Southern
Mozambique. PLoS ONE. 2015;10(7):e0132053. Carr JK, éditeur. 16. Ministère de la Santé Publique et de la Lutte contre le Sida. Plan
Stratégique National de Lutte contre le sida 2012–2016. 2012 [Fabruary 3, 2016]. [http://www.ilo.org/wcmsp5/groups/public/—ed_protect/— protrav/—ilo_aids/documents/legaldocument/wcms_202048.pdf]. 17. Institut de Statistiques et d’Études Économiques du Burundi (ISTEEBU),
Ministère de la Santé Publique et de la Lutte contre le Sida [Burundi] (MSPLS), ICF International. Enquête Démographique et de Santé Burundi 2010. 2012 [February 3, 2016]. [https://dhsprogram.com/pubs/pdf/FR253/ FR253.pdf].
18. UNAIDS. Burundi - Developing subnational estimates of HIV prevalence and the number of people living with HIV. 2014 [July 16, 2015]. [http://www. unaids.org/sites/default/files/media_asset/2014_subnationalestimatessurvey_ Burundi_en.pdf].
19. Institut de Statistiques et d’Études Économiques du Burundi (ISTEEBU). Recensement Général de la Population et de l’Habitat du Burundi 2008: Synthèse des résultats définitifs. Bujumbura, Burundi, 2011 [July 17, 2015]. [https://www.usaid.gov/sites/default/files/documents/1866/
2008%20Burundi%20Population%20Census_ Summary%20of%20Final%20Results.pdf].
20. StataCorp, StataCorp. Stata statistical software: Release 11. College Station, TX: StataCorp LP; 2011.
21. Larmarange J, Vallo R, Yaro S, Msellati P, Méda N. Methods for mapping regional trends of HIV prevalence from Demographic and Health Surveys (DHS). 2011 [November 6, 2015]. [http://cybergeo.revues.org/24606]. 22. Larmarange, J. prevR: estimating regional trends of a prevalence from a
DHS. Paris: IRD; 2013. [November 10, 2015]. [http://cran.r-project.org/web/ packages/prevR/index.html].
23. Larmarange J, Bendaud V. HIV estimates at second subnational level from national population-based surveys. AIDS. 2014;28:S469–76.
24. Kulldorff M. A spatial scan statistic. Commun Stat - Theory Methods. 1997; 26(6):1481–96.
25. Westercamp N, Moses S, Agot K, Ndinya-Achola JO, Parker C, Amolloh KO, et al. Spatial distribution and cluster analysis of sexual risk behaviors reported by young men in Kisumu, Kenya. Int J Health Geogr. 2010;9(1):24. 26. Namosha E, Sartorius B, Tanser F. Spatial clustering of all-cause and
HIV-related mortality in a rural South African population (2000–2006). PLoS ONE. 2013;8(7):e69279. Vermund SH, éditeur.
27. Cuadros DF, Abu-Raddad LJ. Spatial variability in HIV prevalence declines in several countries in sub-Saharan Africa. Health Place. 2014;28:45–9. 28. Belitz C, Brezger A, Kneib T, Lang S, Umlauf N. BayesX - Software for
Bayesian Inference in Structured Additive Regression Models. Version 2.1. 21st edition. Munich, Germany; 2012 [May 21, 2015]. [http://www.statistik. lmu.de/~bayesx/bayesxdownload.html].
29. Maldonado G, Greenland S. Simulation study of confounder-selection strategies. Am J Epidemiol. 1993;138(11):923–36.
30. Barongo LR, Borgdorff MW, Mosha FF, Nicoll A, Grosskurth H, Senkoro KP, et al. The epidemiology of HIV-1 infection in urban areas, roadside settlements and rural villages in Mwanza Region, Tanzania. Aids. 1992;6:1521–8.
31. Chao A, Bulterys M, Musanganire F, Abimana P, Nawrocki P, Taylor E, et al. Risk factors associated with prevalent HIV-1 infection among pregnant women in Rwanda. Int J Epidemiol. 1994;23(2):371–80.
32. Bloom SS, Urassa M, Isingo R, Ng’weshemi J, Boerma JT. Community effects on the risk of HIV infection in rural Tanzania. Sex Transm Infect. 2002;78:261–6.
33. Parkhurst JO. Understanding the correlations between wealth, poverty and human immunodeficiency virus infection in African countries. Bull World Health Organ. 2010;88(7):519–26.
34. Msisha WM, Kapiga SH, Earls F, Subramanian S. Socioeconomic status and HIV seroprevalence in Tanzania: a counterintuitive relationship. Int J Epidemiol. 2008;37(6):1297–303.
35. Kauhl B, Heil J, Hoebe CJ, Schweikart J, Krafft T, Dukers-Muijrers NH. The spatial distribution of hepatitis C virus infections and associated determinants—An application of a geographically weighted poisson regression for evidence-based screening interventions in hotspots. PLoS ONE. 2015;10(9):e0135656.
• We accept pre-submission inquiries
• Our selector tool helps you to find the most relevant journal
• We provide round the clock customer support
• Convenient online submission
• Thorough peer review
• Inclusion in PubMed and all major indexing services • Maximum visibility for your research
Submit your manuscript at www.biomedcentral.com/submit